Chapter 25
Magnetic Resonance Imaging of the Orbit
JAN W. KRONISH, MARK J. LUCARELLI, LINDELL R. GENTRY and RICHARD K. DORTZBACH
Main Menu   Table Of Contents

Search

PHYSICAL PRINCIPLES OF MAGNETIC RESONANCE IMAGING
MAGNETIC RESONANCE IMAGING SYSTEMS
CLINICAL APPLICATIONS
ADVANTAGES AND DISADVANTAGES OF MAGNETIC RESONANCE IMAGING
FUTURE APPLICATIONS
REFERENCES

The evaluation and management of patients with orbital disease have improved significantly in the past three decades as a result of the technologic advances in diagnostic imaging techniques. In the 1970s, computed tomography (CT) quickly became the method of choice for orbital imaging and largely replaced previously available investigative techniques that were relatively uninformative or potentially dangerous, such as plain films, polytomography, orbitography, venography, and arteriography. Although CT provides excellent anatomic information, it also has significant shortcomings, including a lack of tissue specificity and potential adverse effects from the use of ionizing radiation. Standardized echography of the orbit was developed a few years later and can determine the dynamics and acoustic reflectivity of lesions; however, this ultrasonographic technique has limitations, particularly in the study of diseases of the orbital apex, bony orbit, and periorbital structures.

In the early 1980s, magnetic resonance imaging (MRI) was introduced as a new and innovative technique that provides anatomic and physiochemical information. This technique had previously been used for many years in basic science research of enzymatic reactions and molecular structure using spectroscopy. It was not until 1973 that Lauterbur published the first two-dimensional image produced by MRI techniques, and 1977 when the first medical image, one of a human finger, was revealed by Mansfield.1–4 Since that time, the improvement of equipment, advances in computer technology, and increasing investigative interest in clinical applications have resulted in the development of an imaging technique of great potential for the assessment of pathophysiologic states in humans.

Magnetic resonance (MR) images are obtained by placing a patient within a strong and highly uniform static magnetic field. The tissue being examined contains numerous hydrogen atoms consisting of one proton, neutron, and electron. The hydrogen atoms behave like small dipole magnets within the magnetic field and become aligned with the magnetic field. Radiofrequency (RF) waves tuned to the Larmor frequency of hydrogen are then applied to the tissue, and these nuclei absorb a portion of the RF energy to enter a state of excitation. The RF pulse is then turned off, allowing the hydrogen nuclei to return to their normal state of equilibrium by giving up energy to the environment (relaxation). The rate, degree, direction, and pattern of resonant energy emission by the relaxing protons can be localized, quantitated, and transformed into diagnostic images.5 Unlike CT images, which are based on differential radiographic absorption, MR images depend on the proton density (hydrogen ion content) and proton relaxation dynamics that are representative of the tissue's physical and chemical properties.5,6

MRI can provide anatomically detailed images of the orbit that are comparable and, in many cases, superior to high-resolution CT scans. Recent technical developments, including orbital surface coils, fat suppression techniques, fast gradient-echo pulse sequences, and MR contrast agents, allow this noninvasive modality to provide excellent spatial and contrast resolution of the orbital soft tissues with direct multiplanar imaging.7–9 In addition, MR spectroscopy, used to evaluate tissue metabolic dynamics at a biochemical level, has tremendous potential in the study of orbital diseases and their response to treatment.5,10

This chapter is organized to provide readers first with a basic background of the physical principles of MRI. An understanding of the “language” associated with this modality, its operating parameters, and its limitations is important for clinicians who consider using this diagnostic method. We then present the MRI findings of the normal orbit and various orbital diseases, based on the experience of the authors and the current literature. Finally, a comparison of MRI with other imaging techniques and future potential applications are discussed.

Back to Top
PHYSICAL PRINCIPLES OF MAGNETIC RESONANCE IMAGING

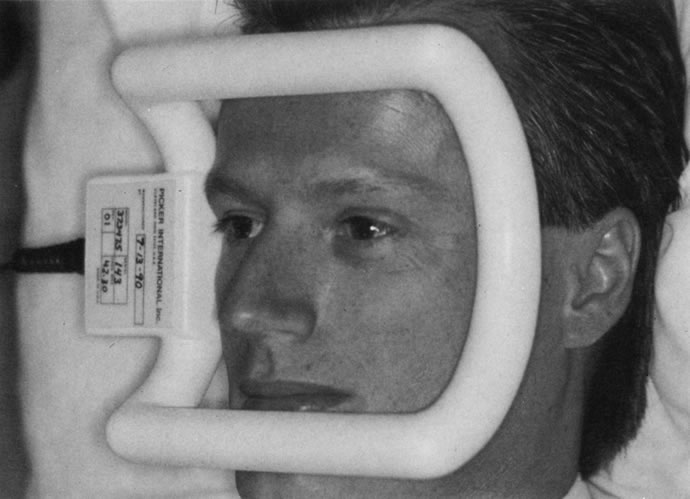
FUNDAMENTAL PRINCIPLES

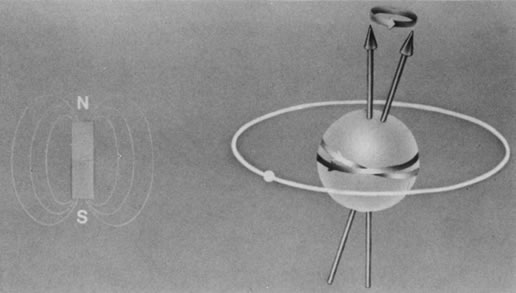
The nucleus of an atom contains protons (positive charge) and neutrons (no charge), and each of these elementary particles spins on its own axis. Because of a relationship between electricity and magnetism, the electric charge and spin of these particles produce a small local nuclear magnetic field. In nuclei with an even mass number (an even number of protons and neutrons), the spinning particles are paired and their magnetic properties cancel. However, in nuclei with an odd mass number, such as hydrogen, sodium, and phosphorus, these spinning particles produce a net magnetic moment. Such nuclei behave as magnetic dipoles and respond to external magnetic fields (Fig. 1).1,5,11–14

Fig. 1. A hydrogen atom contains a proton that spins on its own axis and an electron in orbit around the nucleus. The rotating nucleus behaves as a magnetic dipole, similar to the bar magnet illustrated on the left. The magnetic moment of the nucleus, denoted by the arrows, is determined by the sum of its magnetic forces. (Dortzbach RK, Kronish JW, Gentry LR: Magnetic resonance imaging of the orbit. Part I. Physical principles. Ophthal Plast Reconstr Surg 5:152, 1989)

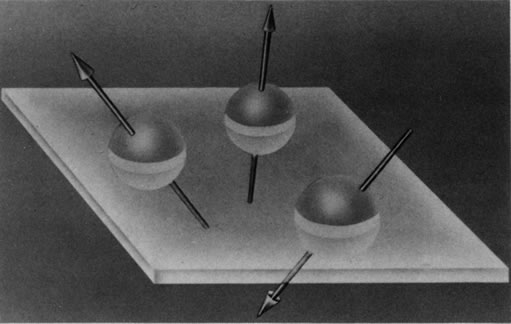
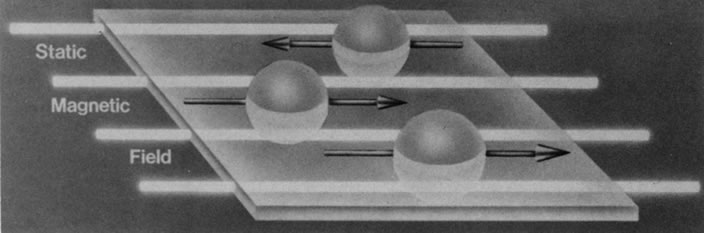
Hydrogen, which contains a single proton, has the largest magnetic moment of all stable atomic nuclei and is highly prevalent throughout biologic tissues. For these reasons, hydrogen forms the basis for MRI and exemplifies its principles. In nature, the magnetic moments of the hydrogen nuclei in biologic tissues are randomly oriented and therefore exhibit no net magnetic effect (Fig. 2). When these nuclei are placed in a strong static magnetic field, such as that produced in an MRI unit, they line up parallel or antiparallel to the field. Slightly more align parallel to the main magnetic field, because this is a lower energy state, and produce a net magnetic vector in this direction (Fig. 3).1,5,8

Fig. 2. The magnetic moments of hydrogen nuclei are randomly oriented in nature. (Dortzbach RK, Kronish JW, Gentry LR: Magnetic resonance imaging of the orbit. Part I. Physical principles. Ophthal Plast Reconstr Surg 5:152, 1989)

Fig. 3. A net magnetic vector is produced by the nuclei that align parallel to a strong stane magnetic field. (Dortzbach RK, Kronish JW. Gentry LR: Magnetic resonance imaging of the orbit. Part I. Physical principles. Ophthal Plast Reconstr Surg 5:153, 1989)

RADIOFREQUENCY WAVES

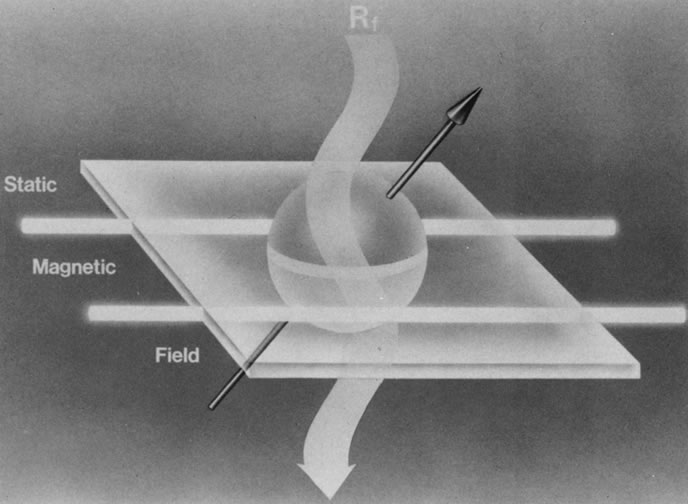
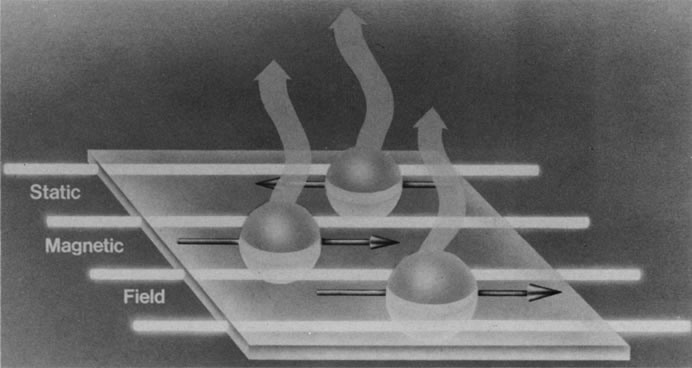
When a properly tuned pulse of RF energy is applied to the tissues in the static magnetic field, the nuclei absorb energy and can shift from parallel to antiparallel alignment (Fig. 4). The energized nuclei are said to “resonate” as they flip to a higher energy state. The duration and amplitude of the RF pulse determine the degree of change of the magnetic moment of each nucleus and the direction of the net magnetic vector. When the RF pulse is turned off, the nuclei “relax” and return to the equilibrium state with the net magnetic vector again parallel in alignment to the direction of the static magnetic field (Fig. 5). The energy released as the nuclei realign at the lower energy state is received as an RF signal by a receiver RF coil, and this signal is processed by a computer to generate an image.1,5,8,12,14

Fig. 4. A radiofrequency (RF) wave applied perpendicular to the static magnetic field is depicted by the undulating arrow directed downward. This RF energy is absorbed by the nuclei, causine them to till out of parallel alignment to an antiparallel orientation and to “resonate” at a higher energy level. (Dortzbach RK. Kronish JW, Gentry LR: Magnetic resonance imaging of the orbit. Part I. Physical principles. Ophthal Plast Reconstr Surg 5:153, 1989)

Fig. 5. When the radiofrequency (RF) wave is turned off, the excited nuclei realign parallel to the static magnetic field. The excess energy released as the nuclei “relax” to a lower energy stare is emitted as an RF signal. (Dortzbach RK, Kronish JW, Gentry LR: Magnetic resonance imaging of the orbit. Part I, Physical principles. Ophthal Plast Reconstr Surg 5:153, 1989)

GRADIENT COILS

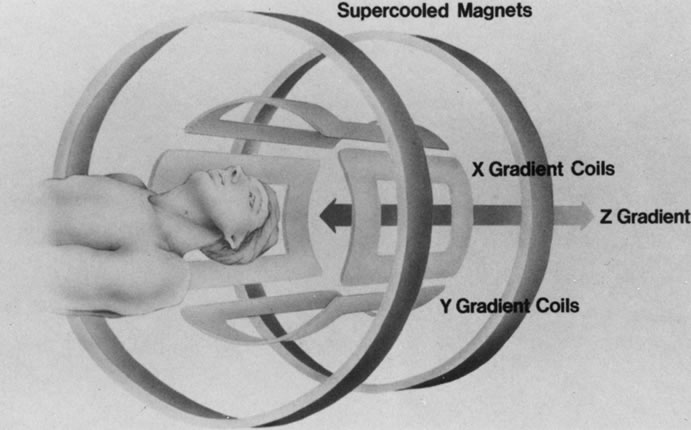
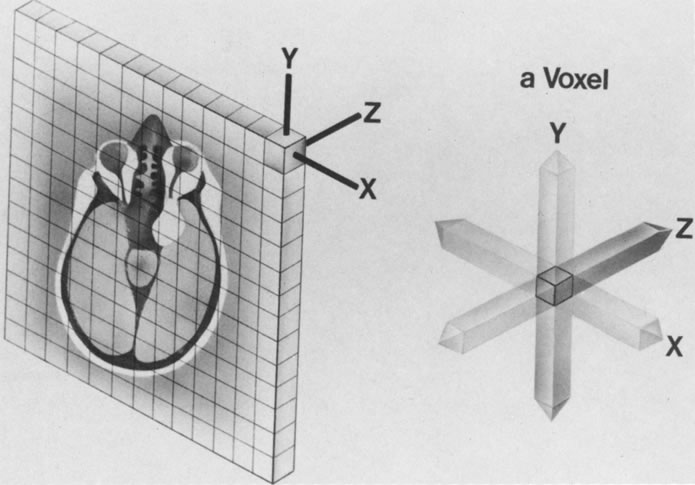
The spatial encoding information required for imaging the MR signal is achieved by use of gradient coils. These coils surround the patient's body in the MRI unit and select the plane (axial, coronal, sagittal, or oblique) to be studied (Fig. 6). A gradient magnetic field is applied by these coils perpendicular to the specified tissue section and isolates the desired plane's RF signal. These signals are further localized by additional manipulation of the magnetic fields parallel to the tissue section into multiple-volume units called voxels (Fig. 7). Each voxel represents a group of hydrogen nuclei with a unique sum of frequencies and phases. A computer reconstructs the signals from these individual three-dimensional voxels into corresponding pixels that compose the two-dimensional image of that plane. The intensity, or whiteness, of each pixel is proportional to the strength of the RF energy obtained from the corresponding voxel.5,15

Fig. 6. X, Y, and Z gradient coils surround the area being studied and correspond to the planes chosen to be imaged. (Dortzbach RK, Kronish JW, Gentry LR: Magnetic resonance imaging of the orbit. Part I. Physical principles. Ophthal Plast Reconstr Surg 5:153, 1989)

Fig. 7. A thin slice of the area to be studied is divided evenly into multiple 3D voxels. The distinct radiofrequency signal emitted from these voxels determines the intensity of the corresponding pixels, which compose the total image of the slice. (Dortzbach RK, Kronish JW, Gentry LR: Magnetic resonance imaging of the orbit. Part I. Physical principles. Ophthal Plast Reconstr Surg 5:154, 1989)

SPATIAL RESOLUTION

Spatial resolution in MRI refers to the discrimination between two points in the image and is dependent on the number and size of pixels; thus, a larger number of smaller pixels in a given field of view yields better spatial resolution. For examinations of the orbits that involve a relatively small area, the field of view can be diminished, thereby reducing the pixel size and improving spatial detail. A reduction of the slice thickness of the plane under study (represented by voxel volume) also improves anatomic delineation by limiting partial volume effects. However, a decrease in the field of view, pixel size, or slice thickness may also adversely affect image quality by causing a concomitant reduction in the signal-to-noise ratio (SNR). Therefore, a compromise of the appropriate parameters must be chosen by the MRI operator to achieve the best image quality for a particular area to be studied.5,15,16

CONTRAST RESOLUTION

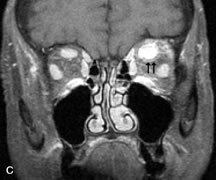
To distinguish between different anatomic structures as well as pathologic processes, disparate tissues must differ sufficiently in contrast. Contrast resolution is defined as the relative signal difference between two adjoining anatomic structures. Inherent properties of different tissues make MRI a powerful tool because their individual rates of relaxation in a magnetic field result in excellent contrast resolution on MR images. The intrinsic biologic properties that are used as parameters for imaging include the T1 relaxation time constant, the T2 relaxation time constant, the concentration of hydrogen (proton density), and the rate of flow of moving fluids in tissues. Extrinsic parameters used by the MRI operator to further improve tissue contrast include pulse sequences, contrast agents, and fat suppression techniques. Each of these parameters is discussed hereafter.5,8,16

Intrinsic Factors

T1 RELAXATION TIME

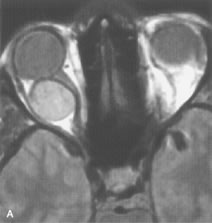
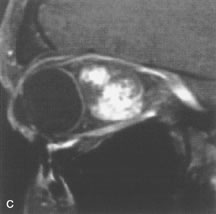
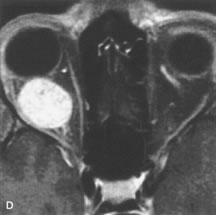
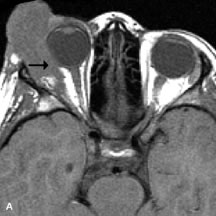
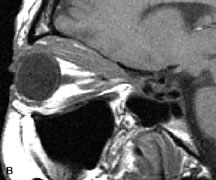
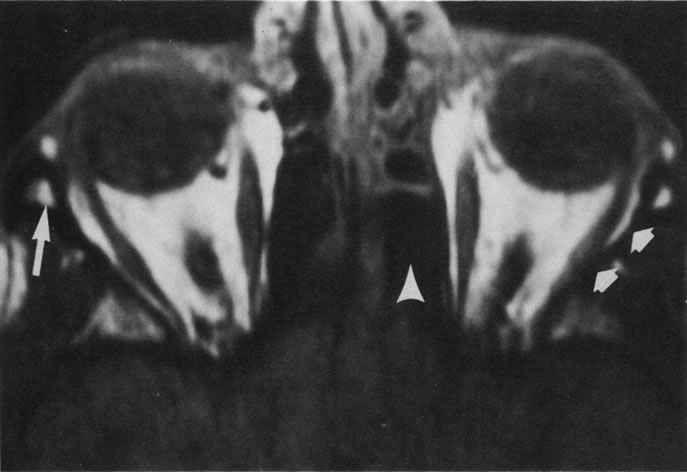
Tl relaxation time is the time required for the energized nuclei to give up the excess energy that was acquired from the RF pulse (high-energy state) and re-establish equilibrium (low-energy state) with the main magnetic field. The excess energy is released by these excited nuclei to the surrounding molecular environment, or lattice, and results in T1 relaxation, also called spin-lattice relaxation time. In different biologic tissues, hydrogen has a Tl ranging from a few hundred milliseconds to a couple of seconds. This range exists because local tissue factors affect the ability of specific protons to give up energy to the surrounding tissues. For example, hydrogen atoms attached to the carbon atoms of fat molecules relax much more rapidly than those attached to the oxygen atoms of water molecules. Viscosity, concentration, temperature, and molecular environment of the hydrogen atoms in the tissues also affect the T1 relaxation time. On a T1-weighted orbital image, fat, which has a very short T1 relaxation time, yields a high-intensity signal; the rectus muscles, which have an intermediate T1, yield an intermediate-intensity signal; and the vitreous, which has a long T1, yields a low-intensity signal (Fig. 8).5,8,16

Fig. 8. T1-weighted image shows the excellent contrast resolution of the soft tissues of the orbit. Note the contrast between the high-intensity (bright) signal of orbital fat and intermediate signal of the extraocular muscles and optic nerves. The lens, vitreous, and sclera can also be easily distinguished. The air in the ethmoidal sinuses emits no signal and therefore appears dark (arrow-head). The left lateral orbital wall also appears dark because of the low proton density and free-water content of cortical bone (short arrows). The bone marrow in the right orbital rim is depicted by a bright signal as a result of its fat contents (long arrow). (Dortzbach RK, Kronish JW, Gentry LR: Magnetic resonance imaging of the orbit. Part II. Clinical applications. Ophthal Plast Reconstr Surg 5:161, 1989)

T2 RELAXATION TIME.

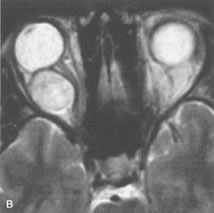
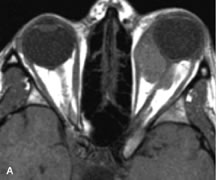
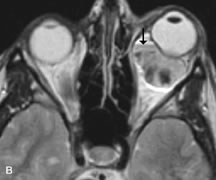
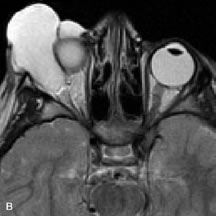
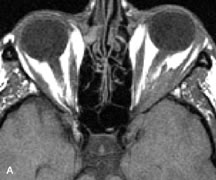
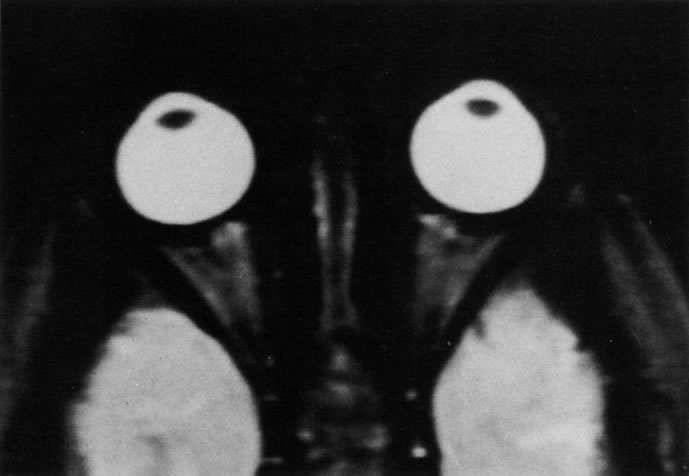
Application of a 90° RF pulse brings the excited nuclei into phase so that the net vector of their magnetic moments is directed perpendicular to the static magnetic field. Shortly thereafter, the magnetic moments of the nuclei spread out and point in different directions, leading to a loss of phase coherence and a resultant decay in signal intensity amplitude. The T2, or spin-spin relaxation time, is the rate of decrease in the signal of these excited nuclei as a result of the interaction and transfer of energy to unexcited adjacent nuclei. T2 ranges from a few milliseconds to a few hundred milliseconds and, for a given tissue, is always less than the Tl relaxation time. T2-weighted orbital images are easily recognized by a high-intensity signal from the vitreous (Fig. 9).5,8,16

Fig. 9. T2-weighted image of the orbits does not delineate normal anatomic details well. The lens can be visualized in the bright vitreous. (Dortzbach RK, Kronish JW, Gentry LR: Magnetic resonance imaging of the orbit. Part II. Clinical applications. Ophthal Plast Reconstr Surg 5:161, 1989)

PROTON DENSITY

If enough time is allotted between RF excitations, all of the protons eventually relax and the signal is no longer primarily dependent on the previously mentioned time constants. Images obtained with these parameters are called proton density weighted. These images usually show less contrast resolution than T1- and T2-weighted images because the difference in hydrogen concentration (proton density) of soft tissues is relatively small.5,16

FLOW OF PROTONS

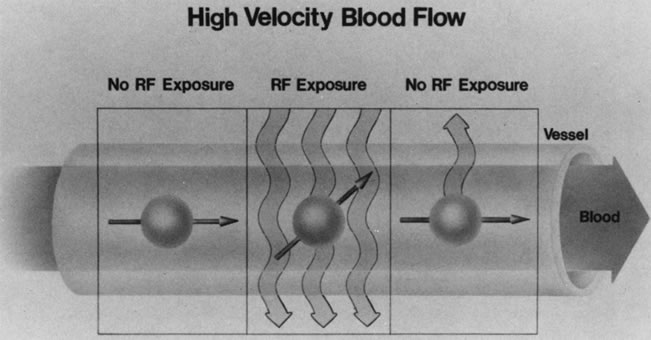
Blood vessels with rapidly flowing blood usually appear as regions of low intensity in contrast to the surrounding tissues. This phenomenon is explained by the fact that excited protons in the blood within the imaging slice that received the RF pulse pass outside the slice before their signal is detected by the RF receiver coils (Fig. 10). By the time the slice is imaged, the replacement blood, which has not received the RF energy stimulus, does not yield a signal, and consequently the blood vessel appears dark.5,17

Fig. 10. The lumina of blood vessels containing rapidly flowing blood appear dark because the excited protons in the blood leave the imaging slice before the emitted signal can be detected. This phenomenon is illustrated by dividing a blood vessel into three frames. The nucleus in the central frame energized by the radiofrequency (RF) signal passes out of the imaging plane into the right frame before it relaxes and emits a signal. In the left frame, the hydrogen nucleus is not exposed to the RF waves and therefore cannot give a signal as it enters the imaging plane in the central frame. Therefore, no signal is detected in the blood vessel, which consequently appears dark, (Dortzbach RK, Kronish JW, Gentry LR: Magnetic resonance imaging of the orbit, Part I, Physical principles. Ophthal Plast Reconstr Surg 5:156, 1989)

Extrinsic Factors

PULSE SEQUENCES

Varying the amplitude, power, and timing of successive RF pulses can alter MRI soft tissue contrast. This technique, known as pulse sequencing, allows the MRI operator to selectively weight the signal contributions of disparate tissues to enhance image contrast. Numerous pulse sequences as well as innumerable variations have been developed by MRI vendors to optimize visualization of different orbital tissues, each of which has different strengths and limitations. Some of the major types of pulse sequences include saturation recovery (SR), also known as partial saturation; inversion recovery (IR); and conventional spin echo (SE), fast spin echo (FSE), and gradient echo (GE). SR images are primarily weighted for Tl and proton density and produce detailed images of normal anatomy. The IR pulse sequence is a T1-weighted sequence that provides excellent contrast resolution but requires a longer imaging time. The conventional SE technique can be used to obtain high quality T1-, T2-, or proton density–weighted orbital scans. This pulse sequence, however, requires relatively long imaging times and has almost been completely replaced by the FSE pulse sequence. The latter can provide similar types of contrast weighting as SE at about one-fourth the imaging time. It is the most common pulse sequence currently used to evaluate pathologic conditions of the orbit. FSE scans utilize a similar TR interval but acquire a “train” of eight to 16 echoes from each excitation. T1-weighted scans are generated from the early group of echoes and T-2-weighted scans from the later group of echoes. FSE images can be weighted toward Tl, T2, or proton density, depending on the selected time parameters. The repetition time (TR), which is the time interval between subsequent RF pulses, and echo delay (TE), which is the time interval between the RF excitation and detection of the signal emitted from relaxing protons, are time parameters that can be altered in any pulse sequence to accentuate differences in the intrinsic responses of tissues being imaged. Gradient-echo pulse sequences are especially useful for rapidly obtaining images of the orbit. Normally, a spin-echo image is generated using at least two RF pulses: a 90° excitation pulse and a refocusing 180° pulse. The latter is used to produce the echo which, in turn, is used to form the image. Alternatively, an echo can be formed by the application of a transient magnetic field gradient after the 90° pulse. Gradient echoes can be produced much more rapidly but are more susceptible to artifacts. Fast, fairly high-quality orbital images that are T1-, T2-, or proton density weighted can be obtained using gradient echoes and RF pulses that are shorter (5° to 60°) in duration than the typical 90° pulses used in SE imaging. These pulse sequences bear different names depending on the specific MRI vendor and specific pulse sequence parameters (GRASS, SPGR, FLASH, FISP, MPGR, etc.).5,8,12–14,16,18,19

CONTRAST AGENTS

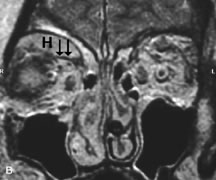
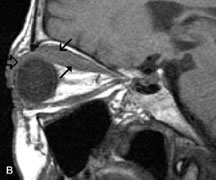
Contrast agents composed of paramagnetic or superparamagnetic materials can alter tissue properties to improve the MRI detection and characterization of certain pathologic lesions. Gadolinium diethylenetriaminepentaacetic acid (Gd-DTPA), the only paramagnetic agent currently approved in the United States for clinical applications, shortens the relaxation times of adjacent protons (hydrogen nuclei) and results in a bright signal on T1-weighted images. Gadolinium, like most heavy metals, is toxic in its nonchelated form but is safe when strongly bound to DTPA, which serves to eliminate its biologic toxicity. It is administered intravenously and is generally considered safer than iodinated radiographic contrast materials used for CT scans and arteriograms. It has little immunologic, systemic, and renal toxicity.20 Gd-DTPA has been shown to effectively detect disruption of the blood–brain barrier and delineate orbital tumors, such as meningiomas, gliomas, hemangiomas, and metastases (see Lacrimal Gland Tumors and Inflammatory and Lymphoproliferative Lesions in the section on Orbital Diseases). It also appears promising in identifying areas of altered circulation due to inflammation, ischemia, soft tissue injury, and neoplasia.7,8,21,22

FAT SUPPRESSION TECHNIQUES

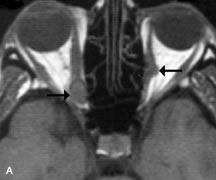
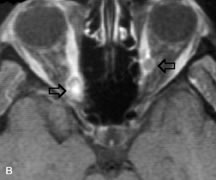
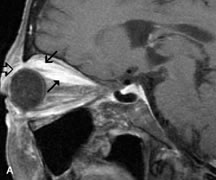
MR images are produced by signals arising primarily from protons attached to either lipids or water. The protons from water and lipid resonate at slightly different frequencies. Spatial encoding of the x and y coordinates of the MR image from a given pulse sequence requires both phase and frequency information to properly map the signal information to its respective pixel. A well-known phenomenon, chemical shift artifact, is produced when water and fat protons lie in close proximity to each other. Because of the slight difference in the resonate frequencies of the adjacent fat and water protons, they are spatially mismapped in the frequency-encoded direction of the MR image, producing a dark artifactual band on one side of the interface and a bright band on the other side. This results in loss of anatomic detail in MR images of body parts, such as the orbit, that contain both lipid and water. Numerous techniques have been devised to suppress fat signals and improve visualization of lesions that develop in areas of high fat content, such as the orbit (see Intraocular Tumors, below). Three basic methods are in current use: T1-adependent suppression (e.g., short inversion time inversion recovery [STIR]), frequency-selective methods (e.g.,chemical shift selective imaging [CHESS]), and phase-dependent methods (e.g., Dixon, Chopper methods).8,22–24

MAGNETIC RESONANCE ANGIOGRAPHY AND VENOGRAPHY

The MR angiography (MRA) technique uses fast gradient-echo scans to provide a noninvasive alternative for evaluating the carotid bifurcations and intracranial vessels. The time-of-flight MRA sequence is most commonly used and consists of a series of very thin, flow-sensitized, two-dimensional images that are acquired and subsequently reconstructed into a three-dimensional data set. The three-dimensional data can be rotated into any imaging plane by the computer software, providing images in multiple angiographic projections. MRA has recently become a fixture for noninvasive vascular imaging of the brain, face, and orbit. Advancements in spatial resolution and reduction in examination time has led to routine use of MRA for initial evaluation of vascular abnormalities such as aneurysms, arteriovenous malformations, and vascular tumors.25–27 The spatial resolution, however, remains inferior to that of conventional angiography. Angiography is still required for detection of aneurysms less than 2 to 3 mm since these are not reliably detected by MRA. Magnetic resonance venography (MRV) is considered the study of choice for evaluation of cerebrovascular veno-occlusive diseases, such as dural venous or cavernous sinus thrombosis.28

Back to Top
MAGNETIC RESONANCE IMAGING SYSTEMS

MAGNETIC RESONANCE IMAGING UNITS

The largest component of an MRI unit is the magnet, which has a central internal bore into which patients are placed. Superconductive magnets are the most common type of magnet used for medical imaging to generate a uniform magnetic field of sufficient strength. They are cooled by liquid helium and nitrogen to reduce electrical resistance, and most operate between 0.5 and 3 tesla (T). (The tesla is a unit of magnetic field strength. One tesla is approximately 16,000 times greater in magnitude than the earth's magnetic field.29) Although clinical images can be obtained with much weaker magnets (e.g., 0.2 T), the image quality increases and acquisition time shortens with greater field strengths. Also, spectroscopy and imaging of elements other than hydrogen require high-magnitude magnetic fields.5,15,29,30

Gradient coils are located within the bore of the magnet, and transmitter/receiver RF coils are positioned within the gradient coils. The remainder of the MRI unit is set up similarly to a CT scanner. Patient-handling equipment and gantry are found in the room containing the magnet, and a separate room houses the diagnostic stations and the control panel for the operator. Computers are linked to the system for image reconstruction, analysis, display, and storage.15

SURFACE COILS

Surface coils are RF receiver coils that are exclusively designed for specific areas of study. The smallest diameter coil possible is chosen for the selected region to be imaged and is placed close to that surface in order to reduce the transmission of signals emitted from surrounding tissues not of interest. The SNR from the area of study thus is effectively increased, allowing thinner slices and improved spatial resolution. The primary advantage of a surface coil is improved SNR; the primary disadvantages are limited depth of view and varying signal intensity over the field of view.5,6,8,16,30,31 An orbital coil (Fig. 11) or head coil may also be chosen for high-resolution orbital imaging.

Fig. 11. An orbital surface coil is placed over the face to improve the signal-to-noise ratio of the image signal.

SITE SELECTION

The nearby environment may have a significant impact on the functional aspects of the MRI system, and the surroundings must be considered when selecting an MR unit site. Large iron structures, such as steel girders, elevators, and cars, may affect the magnetic field and impair the image quality. External RF noise, such as radio waves, could alter the RF signals received for image production. In order to reduce these outside influences, MR units must be shielded by enclosing the room with copper and aluminum. Iron-containing items, such as hip prostheses and even certain eye makeup, could cause image artifact if located in the area of study.5,29,32,33

Conversely, the powerful MRI magnet can have a major effect on its surrounding environment. MRI units are constructed with iron or steel magnetic shields to reduce exposing persons in the immediate area to the magnetic fields. Within the room containing the superconductive magnet, which is “on” all the time, electronic equipment (e.g., cardiac monitors and pacemakers) may not function properly, credit card magnetic strips might become erased, and watches may become magnetized. More important are the potential effects of the magnetic fields on metallic objects within the room or incorporated in body tissues. Ferromagnetic items as small as a paper clip or as large as an oxygen tank can become dangerous flying missiles. Surgical implants (e.g., stainless steel vascular clips) or intraocular foreign bodies that contain iron could move or dislodge and cause damage to surrounding tissues. Biologic effects of the magnetic field, such as electrocardiographic alterations, nerve conduction changes, and tissue heat production, are not considered harmful at the level of field strength produced for clinical imaging.5,20,29,34

Back to Top
CLINICAL APPLICATIONS

PATIENT PREPARATION

Before MRI is performed, patients must be screened and prepared to avoid the potential hazards associated with the strong magnetic field. Patients who have ferrous aneurysm clips or cardiac pacemakers, who depend on life-support equipment, or who retain a possible metallic intraocular foreign body are not candidates for this imaging modality. MRI cannot be performed on obese patients who cannot fit into the bore of the magnet. Patients who are claustrophobic may not tolerate a prolonged period of study within the confines of the magnet, whereas others might do well if given a mild sedative. All worn metallic objects (e.g., necklaces, watches) should be taken off, credit cards set aside, and eye makeup removed before entering the room containing the magnet.5,20,34,35,36

NORMAL ORBITAL ANATOMY

T1-weighted images provide the best anatomic details of the orbit because they display superior contrast resolution between normal structures (see Fig. 8). The vitreous has a long T1, resulting in an intermediate signal similar to brain, whereas the crystalline lens and sclera appear dark because of a longer T1 and short T2. The extraocular muscles, like all skeletal muscles, demonstrate a moderately long T1 and short T2 and highly contrast with the intense signal of the surrounding orbital fat (adipose tissue has an extremely short T1). The lacrimal glands appear as mottled areas of reduced intensity of the signal from the orbital fat in the lacrimal fossa. The optic nerves are seen with the same signal intensity as brain white matter and are hypointense relative to the orbital fat because their Tl is longer than the Tl of fat but shorter than the Tl of water.

Cortical bone is not well delineated because it contains little free water, yielding minimal signal in MRI, and thus appears dark on all pulse sequences. This feature explains why MR images of the orbital apex and intracanalicular portion of the optic nerves are superior to comparable CT scans. Partial volume averaging of the bones in these regions obscures soft tissue details on CT images, whereas MRI reveals the signals only from the soft tissue structures with no cortical bone input. Bone marrow, on the other hand, is seen as a relatively intense signal because of its high fat content (see Fig. 8).37,38

T2-weighted pulse sequences are not ideal for imaging normal anatomy; however, they are particularly useful in revealing pathologic conditions (see Fig. 9). T2-weighted studies are most easily recognized by a bright vitreous signal.

ORBITAL DISEASES

Vascular Lesions

Cavernous hemangiomas appear as well-circumscribed, smooth, usually intraconal masses that are isointense to muscle on T1-weighted images and hyperintense on T2-weighted images (Fig. 12). Patchy early enhancement is typically followed by diffuse, more homogeneous enhancement.39 The internal architecture of the mass, including septation and internal vasculature, may often be appreciated with high-quality orbital imaging.40

Fig. 12. A. T1- and (B) T2-weighted MR scans demonstrate a well-circumscribed intraconal mass causing severe optic nerve displacement. These lesions are usually intermediate in signal intensity on T1-weighted scans and very hyperintense on T2-weighted Images. C and D. Postcontrast fat-suppressed T1-weighted scans demonstrate characteristic patchy intense enhancement that becomes more complete from the initial postcontrast scan (C) to a more delayed scan (D).

Lymphangiomas consist of ectatic vascular channels within a connective tissue stoma with varying degrees of lymphoid cellularity. On MRI, these tumors are typically poorly circumscribed, multicompartmental, and heterogeneous, often showing cystic dilations with fluid levels (Fig. 13). The signal characteristics within lymphangiomas vary considerably, reflecting cystic and solid components and the varying paramagnetic characteristics of blood at different stages of degradation.40–42 Acute hemorrhage appears hypointense on both T1- and T2-weighted formats. Methemoglobin present in subacute hemorrhage (3 to 14 days) leads to hyperintense signal on both T1- and T2-weighted images.41 A small percentage of lymphangiomas appear radiologically indistinct from orbital cavernous hemangiomas.43

Fig. 13. A. T1- and (B) T2-weighted MR scans demonstrate a moderately well-circumscribed intraconal mass enveloping the optic nerve. The lesion is hyperintense to vitreous on the T1-weighted scan. A fluid-fluid level (arrow) and patchy hypointense areas are seen within the mass on T2-weighted scan due to the presence of subacute blood products. C and D. Postcontrast fat-suppressed T1-weighted scans demonstrate no significant enhancement within the lesion, although there is minimal peripheral enhancement in surrounding orbital tissues.

Orbital varices are venous malformations that expand with increased systemic venous pressure, such as with Valsalva maneuvers. Because rapid acquisition of images during a Valsalva maneuver is important in imaging such a lesion, conventional or spiral CT is currently the modality of choice.44

MRI is an excellent modality for demonstrating enlargement of the cavernous sinus and dilation of the superior ophthalmic vein in patients with high-flow carotid-cavernous fistulas (Fig. 14).37MRA may be helpful in the evaluation of the venous outflow pattern. The rapidly flowing blood in these vascular structures carries the excited protons out of the section before they can be imaged, resulting in their dark appearance.5 In low-flow dural arteriovenous malformations, MRA may help define the arterial feeding vessels.45

Fig. 14. Patient with Ehlers-Danlos syndrome who presented with abrupt onset of severe proptosis. A-C. Postcontrast fat-suppressed T1-weighted MR scans demonstrate marked proptosis and engorgement of the extraocular muscles and superior ophthalmic vein (arrows). D. T2-weighted scan through the cavernous sinus demonstrates enlargement and arterialized flow void within the right cavernous sinus (open arrow).

Neural Lesions

MRI is more effective than CT in delineating the intracranial optic nerves, chiasm, and optic tracts and, for this reason, is the preferred imaging modality in the evaluation of optic nerve disorders. The spatial relationships and image contrast of the orbital tissues with intraorbital optic nerve tumors is comparable between the two imaging modalities. The normal nerve is isointense to brain and appears enlarged and kinked owing to infiltration of an optic nerve glioma on T1-weighted images. Gliomas appear hyperintense on T2-weighted images and may be heterogeneous owing to cystic areas within the tumor. Contrast enhancement is variable.46

Intraorbital and intracranial optic nerve sheath meningiomas are usually isointense to cortical gray matter on Tl-weighted images and remain isointense on proton density studies (Fig. 15). Gd-DTPA is useful in delineating the intracranial extension of optic nerve meningiomas.7,47 The hyperostosis of bone and calcification associated with meningiomas are not demonstrated as well on MRI studies as on CT scans.20,37 Gd-DTPA–enhanced MRI also appears promising in the study of the permeability of the blood–brain barrier in selected optic neuropathies.22,48 MRI may reveal an enlarged optic nerve and some degree of contrast enhancement in cases of optic neuritis.49

Fig. 15. A. T1- and (B) T2-weighted MR scans demonstrate a mass causing fusiform enlargement of the optic nerve sheath complex. The peripheral portion of the mass, representing the meningioma, is isointense to brain on the T1-weighted scan and notably hypointense on the T2-weighted scan. The central portion of the mass, representing an edematous optic nerve, is very hyperintense on the T2-weighted scan (arrow), C and D. Postcontra fat-suppressed T1-weighted scans demonstrate intense peripheral enhancement of the meningioma surrounding the central nonenhancing optic nerve (arrow). Also note the enhancing Intracranial “dural tail” (double arrow).

Muscle Disorders

Extraocular muscle enlargement in patients with thyroid-associated orbitopathy is demonstrated equally well with CT and MRI studies. However, the superior tissue contrast on MR images reveals better details of the relationships of the optic nerve to the thickened muscles at the orbital apex (Fig. 16).50 In addition, MRI may be able to differentiate between muscles that are enlarged as a result of edema and active inflammation and those enlarged because of fibrosis by their T2 relaxation times.21 Quantitative MRI was not found to be accurate in predicting the success of low-dose orbital irradiation.51 However, a muscular index relating the diameters of the rectus muscles to the bony orbital dimensions was useful in predicting optic nerve compression.52

Fig. 16. A-C, T1-weighted MR scans obtained with a high-resolution surface coil demonstrate fusiform enlargement of the extraocular muscles. The medial, lateral, and inferior rectus muscles are especially involved. Note the relative sparing of the tendinous insertions, a finding characteristic of this disease process, as well as fatty infiltration of the lateral and inferior rectus muscles. There is marked proptosis, best visualized on the sagittal image (A), and mild crowding of the optic nerve at the orbital apex.

MRI is also effective in imaging orbital tumors of mesenchymal origin, such as rhabdomyosarcoma, particularly in the assessment of extension into the anterior and middle cranial fossae (Fig. 17).37 The lack of any pathognomonic radiologic features necessitates rapid orbital biopsy when rhabdomyosarcoma is suspected.

Fig. 17. A. T1- and (B) T2-weighted MR scans demonstrate a preseptal and extraconal mass displacing the globe medially. The mass is slightly hyperintense on the T1-weighted scan and very hyperintense on the T2-weighted scan owing to the high extracellular water content of the neoplasm. The lesion abuts the globe and appears to infiltrate the lateral rectus muscle (arrow). C and D. Postcontrast fat-suppressed T1-weighted scans demonstrate intense enhancement of the highly infiltrative lesion that is invading the lateral rectus, superior rectus, and levator palpebrac superioris muscle (double arrows).

Osseous Lesions

In general, CT is the imaging modality of choice when details of quantity and quality of bone are needed; however, abnormalities of bones can be detected indirectly by MRI. Cortical bone appears black (signal void) on MR images because of its low proton density and free-water content. The absence or discontinuity of the signal void of the orbital walls may represent bony destruction or fracture. Hyperostosis associated with prostate metastases or meningioma is visualized as areas of black smudging.50,53 Diseases in which the bone is replaced by pathologic tissues with a high free-water content, such as fibrous dysplasia, are well demonstrated on MRI. An intermediate signal intensity on T1-weighted images and hypointense signal on T2-weighted images is representative of fibrous dysplasia. Enhancement on post–Gd-DTPA MR scans is seen and is more evident in areas that are less mineralized.54

Cystic Lesions

Dermoid cysts appear as rounded, well-defined lesions typically contiguous with an orbital bony suture. The high-intensity signal on T1-weighted images is attributed to the sebaceous-produced lipid contents (Fig. 18).31,50 Mucoceles may demonstrate a hypointense or hyperintense signal on MR images, depending on the concentration of proteinaceous or inflammatory fluid components. The integrity of the bony walls of the expanded sinus cavities cannot be assessed on MR as well as by CT.37,50,55,56 A high-signal intensity on Tl- and T2-weighted images is characteristic of orbital chronic hematic cysts because of the blood-breakdown products within the cysts.57

Fig. 18. A. T1-weighted, (B) T2-weighted fat-suppressed, and (C) T1-weighted fat-suppressed MR scans demonstrate a small dermoid cyst arising near the palpebral portion of the lacrinal gland (arrows). The lesion is similar in signal intensity to fat on the T1-weighted scan (A) consistent with a high adipose tissue content. The lesion shows fat-suppression and low signal intensity on the two fat-suppressed sequences (B and C) confirming its high lipid content.

Trauma

Although soft tissue relationships are usually better demonstrated on MRI, the evaluation of craniofacial bony trauma is preferable with CT. For example, prolapse of orbital fat through a fracture site and hemorrhage of adjacent tissues are demonstrated in an MR image, but the actual fractured bone is not imaged. Three-dimensional MRI of the orbit in subacute trauma has been described,58 although its precise role is not currently established. MRI has been suggested to be superior to CT in detecting intraorbital wooden foreign bodies.59,60 In a series of penetrating orbital injuries with organic foreign bodies, however, MRI was able to identify the foreign body in only four of seven cases.61 With an in vitro model for wood foreign body, McGuckin and colleagues concluded that CT was the imaging modality of choice.62 A careful history and, in selected cases, plain films to rule out a metallic foreign body are crucial before MRI is considered in patients with periocular trauma.

MRI is particularly helpful in the detection and characterization of subperiosteal hematomas of the orbit (Fig. 19). They are most commonly seen in the subperiosteal space of the superior orbit as well-defined masses following a traumatic injury. The signal intensity varies depending on the acute, subacute, or chronic nature of the hematoma, based on the stage of blood degradation. Fresh hemorrhages are hypointense on T1-weighted images and hyperintense on T2 images. Hematomas that are 1 to 7 days old are hypointense on both T1- and T2-weighted images. T1-weighted images of hematomas more than a week old are hyperintense due to the oxidation of deoxyhemoglobin to methemoglobin, whereas the T2 images remain hypointense.63

Fig. 19. A. T1- and (B) T2-weighted MR scans demonstrate a large acute subperiosteal hematoma (H) that lies between the cortical bone of the orbital roof and the inferiorly displaced periorthira (double arrow). The extracopal fat (arrow) and levator muscle are displaced inferiorly.

Metastatic Tumors

Breast carcinoma metastatic to the orbit has been demonstrated to be hypointense to the surrounding orbital fat on T1-weighted studies and hyperintense on T2-weighted images and has an affinity to the extraocular muscles (Fig. 20).50,64 The MRI characteristics of prostate carcinoma metastatic to the orbit have been described as involving the greater and lesser wing of the sphenoid, orbital roof, and optic canal. Diffuse bone hypertrophy with isointense or slightly hyperintense tissue on T1-weighted images represents the osteoblastic carcinomatous bone infiltration. Contrast enhancement is variable on T1-weighted and fat-suppressed images.65

Fig. 20. A. T1-weighted MR scan demonstrates nodular enlargement of both medial rectus muscles (arrows). B. T1-weighted fat-suppressed contrast-enhanced scan confirms the presence of small metnstatic deposits within the muscles (open arrows).

Most other metastatic tumors also have a lower intensity signal on T1-weighted images and appear to displace or infiltrate normal orbital structures; however, their signal characteristics are variable on T2-weighted MR images.66 Many metastatic tumors demonstrate bright contrast enhancement with Gd-DTPA.

Infectious Disorders

MRI findings of preseptal and orbital cellulitis typically include increased signal intensities on T2-weighted images of the eyelids and orbital fat, respectively, due to the increased water content of the tissues. Since most cases of bacterial orbital cellulitis are associated with paranasal sinusitis, hyperintense signals of the affected sinuses may also be found on T2-weighted images as well as enhancement of polyps and granulation tissue on postgadolinium T1-weighted MR images. Subperiosteal abscess formation may occur due to contiguous spread of infection from the paranasal sinuses and appear on MRI as an area of intermediate signal on T1-weighted and proton-weighted MR images. The abscess may appear slightly hyperintense compared with muscle on T2-weighted scans with the necrotic contents having the greatest intensity.67

MRI and MRV are more sensitive than CT in revealing cavernous sinus thrombosis. Engorgement of the cavernous sinus, extraocular muscles, and ophthalmic veins is seen with hyperintensity of the thrombosed sinuses evident on all pulse sequences. The enlarged, thrombosed superior ophthalmic vein appears less hypointense than the normal contralateral ophthalmic vein, and hyperintensity within the lumen of the vessel may be seen on T1- and T2-weighted MR images.68

Inflammatory and Lymphoproliferative Lesions

Inflammatory conditions of the orbit, both idiopathic (inflammatory pseudotumor) and those of known causes, have been found to be hypointense to fat and isointense to muscle on Tl-weighted studies and isointense or slightly hyperintense to fat on T2-weighted images (Fig. 21).50,64,69 The more fibrous or sclerosing varieties have less signal intensity on T2-weighted images. Marked enhancement is seen in pseudotumor infiltrates after gadolinium administration.70 The same signal characteristics are demonstrated in patients with Tolosa-Hunt syndrome, with mass lesions seen in the cavernous sinuses and orbital apices.71

Fig. 21. A. T1-weighted MR scan demonstrates diffuse enlargement of both the superior rectus and levator palpebrae superioris muscles (single arrows). The involvement of the tendinous insertions and preseptal soft tissues (open arrows) as well as lack of involvement of other muscles helps differentiate this entity from thyroid-associated orbitopathy. B and C. Postcontrast fat-suppressed T1-weighted MR scans demonstrate extensive enhancement of the involved muscles as well as the preseptal (open arrows) and perinuscular tissues (double arrows).

Lymphomas have MRI characteristics similar to those of inflammatory lesions in that they are hypointense to fat and isointense to muscle on T1-weighted images (Fig. 22). They may appear hyperintense to fat on T2-weighted images, perhaps owing to less fibrosis than that seen in orbital inflammatory pseudotumor, although this is not a consistent finding.31,50,66 Lymphoid tumors typically enhance moderately after contrast injection. Unfortunately, studies have shown that tumor density and homogeneity are similar between inflammatory and malignant orbital infiltrates, and MRI cannot differentiate these lesions.72,73

Fig. 22. A and B. T1- and (C) T2-weighted MR scans demonstrate a poorly defined multicompartmental mass enveloping the lateral rectus, superior rectus, and levator palpebrac superioris muscles. The lesion is isointense to brain on T1- and T2-weighted scans, as is typical for highly cellular neoplasms. D. Postcontrast fat-suppressed T1-weighted scan demonstrates intense enhancement of the infiltrating intraconal and extraconal tumor.

Lacrimal Gland Tumors

Lacrimal gland lesions present special problems in diagnosis and management. Pleomorphic adenoma (benign mixed tumor) should not be biopsied, but rather excised in toto. On the other hand, for lymphoma and inflammatory infiltrates, incisional biopsy is more appropriate than complete excision of the lacrimal gland. Thus, preoperative clinical and radiologic evaluation are especially crucial in planning appropriate surgical management.

Pleomorphic adenomas demonstrate long T1 and T2 signal characteristics. They may show heterogeneity on T2-weighted images74 and moderate to marked enhancement with contrast.75 Signal characteristics of adenoid cystic carcinoma include hypointensity to fat on T1-weighted images, hyperintensity to fat with increased T2 weighting, and isointensity to fat on proton density-weighted studies (Fig. 23).31,75 Secondary bony alterations of the lacrimal fossa associated with lacrimal gland tumors, such as remodeling (benign mixed tumor) or destruction (adenoid cystic carcinoma), are seen indirectly on MR images; however, bone windows on CT scans provide better delineation of these changes. In contrast to the round or globular appearance of benign or malignant epithelial tumors of the lacrimal gland, lymphoproliferative tumors usually appear to be molding or draping onto the globe and the surrounding bony orbit.

Fig. 23. A. T2-weighted and (B and C) postcontrast fat-suppressed T1-weighted MR scans demonstrate an infiltrative lacrimal region mass than invades the lateral rectus muscle (arrows). This highly cellular lesion is seen to have a very hypointense appearance on the T2-weighted scan.

LACRIMAL DRAINAGE SYSTEM DISORDERS

MRI with surface coils provides excellent spatial resolution and tissue-specific signal intensities of the lacrimal drainage system. These parameters have been found useful to more accurately demonstrate the extent of lesions in the lacrimal sac and differentiate long-standing mucoceles from solid tumors than CT.76 Physiologic studies in patients with tearing disorders now include MR dacryocystography, in which Gd-DTPA is either placed topically in the conjunctival fornix or injected by cannulation into the lacrimal sac. They provide a detailed morphologic and functional analysis of the lacrimal excretory system; however, they are no more sensitive than digital-subtraction dacryocystography or CT dacryocystography.77–79

INTRAOCULAR TUMORS

On MRI, uveal melanomas have a typical appearance that helps to differentiate them from other primary and secondary intraocular tumors as well as choroidal detachments. Pigmented melanomas are hyperintense on Tl-weighted images, hypointense on T2-weighted studies, and hyperintense on proton density–weighted examinations (Fig. 24).30,31,50,80–82 These signal characteristics have been attributed to the paramagnetic properties of melanin because of stable free radicals that shorten the T1 and T2 relaxation times. Moderate enhancement is seen on postgadolinium T2-weighted images. Gadolinium-enhanced T1-weighted images are particularly sensitive in detecting choroidal melanomas.83 MRI may be less sensitive in detecting extrascleral extension of tumor than echography performed by an experienced ultrasonographer.84

Fig. 24. A. T1- and (B) T2-weighted MR scans demonstrate a small nodular intraocular mass (arrows) that is very hyperintense on the T1-weighted scan and hypointense on the T2-weighted image. This signal intensity pattern is due to the presence of free radicals within melanin granules. C and D. Postcontrast fat-suppressed T1-weighted scans demonstrate homogeneous intense enhancement of the lesion and no evidence of seleral penetration or optic nerve invasion.

Tumors metastatic to the choroid are hyperintense on T1- and T2-weighted images.24 The signal characteristics, however, may be similar to those seen with choroidal melanoma. Choroidal hemangiomas, on the other hand, have an intermediate signal on T1-weighted sequences and become hyperintense on T2-weighted images50 as well as proton density–weighted images.81

Retinoblastomas display moderate signal intensity on T1-weighted studies and a low signal on T2-weighted images.31,80,85 Calcification can be easily detected by CT and ocular ultrasonography but is not imaged by MRI.25,50 The presence of optic nerve involvement is best evaluated by MRI.

ACQUIRED ANOPHTHALMIA

When an eye is removed owing to tumor or trauma, an implant is typically placed in the intraconal space. MRI may be useful in defining the size, shape, and position of such orbital implants.86 Porous hydroxyapatite or polyethylene implants are preferred by many surgeons performing enucleation or evisceration. A porous implant offers the possibility of supporting a motility coupling peg to increase the movement of the overlying prosthesis. MRI with contrast is used by some surgeons to evaluate the degree of fibrovascular ingrowth in hydroxyapatite87 and porous polyethylene88 implants prior to motility peg placement.

Back to Top
ADVANTAGES AND DISADVANTAGES OF MAGNETIC RESONANCE IMAGING
When choosing between MRI and CT to image orbital disorders, a clinician should consider the advantages and disadvantages of each modality. Following are characteristics of MRI as compared with CT.

ADVANTAGES

Absence of Ionizing Radiation

CT images are produced with ionizing radiation, whereas MRI depends on magnetic fields and RF waves. The lack of the potential side effects characteristic of radiation exposure makes MRI the imaging modality of choice if repeated studies are required. No serious adverse biologic effects have been reported to date.20,25

Direct Multiplanar Imaging

Sectional MR images in axial, coronal, sagittal, and oblique planes can be obtained directly, without the need to move patients. CT scans, on the other hand, require additional patient positioning. Semicoronal orbital CT scans are usually obtained, rather than true coronal sections, to avoid beam-hardening artifacts of dental fillings.20,37,50 An alternative is reconstructed images, but these are of inferior quality.

Superior Contrast Resolution

Soft tissue differentiation is better with MRI than CT because of the distinct inherent properties, such as proton density and relaxation rates, of normal and pathologic tissues. Also, blood vessels with rapid flow are imaged on MRI studies, allowing identification of normal or abnormal flow states. Operator-dependent instrument parameters and the use of paramagnetic contrast agents further contribute to MRI contrast sensitivity.20,37

Lack of Bone Artifacts

Beam-hardening artifacts caused by the high density of cortical bone and partial volume averaging on CT scans obscure the details of soft tissues that are surrounded by bone. Because cortical bone emits a low RF signal, the orbital apex, intracanalicular optic nerve, and structures in the parasellar and posterior fossa areas are particularly well depicted on MR images.7,8,37,50

Safer Contrast Agents

Intravenous administration of Gd-DTPA has been found to be safer than iodinated radiographic contrast agents. In addition, paramagnetic or superparamagnetic materials not only demonstrate contrast enhancement related to increased vascularity but also can identify disturbances of the blood–brain barrier and changes in tissue circulation.20,37

Bone Marrow Visualization

MRI offers excellent imaging of diseases of the bone marrow, such as primary tumors and infection, and is more sensitive than CT and radionuclide bone scanning for identification of metastases.37

Superior Central Nervous System Imaging

MRI is the imaging modality of choice for evaluation of the central nervous system. Its multiplanar capabilities and excellent contrast resolution provide superior detection of lesions in the infratentorial, parasellar, and cervicomedullary areas; lesions of the cervical spine; small brain tumors; secondary effects of mass lesions, such as herniation; and early hypoxic changes. It is especially sensitive in detecting plaques of demyelination for the diagnosis of multiple sclerosis.20,37,89

DISADVANTAGES

Inferior Imaging of Cortical Bone and Calcification

MRI only indirectly delineates cortical bone, thus CT is the study of choice for examination of bony details in conditions such as orbital fractures and tumor-induced hyperostosis. On the other hand, tumor invasion of bone is depicted on MRI by the bright tumor signal replacing the dark signal void of the cortical bone. Pathologic calcification of meningiomas, phleboliths, and retinoblastomas is not reliably depicted on MR images.37,50

Prolonged Examination

Longer scanning times of MRI can lead to problems with motion artifacts and limit the use of this modality to patients who can remain cooperative for up to 1 hour. Recent advances in MR technology, such as fast scanning techniques, have decreased the examination time to some extent.20,37,50

Specific Imaging Artifacts

Chemical shift artifact seen at the interfaces of orbital fat and soft tissue structures may obscure details of normal anatomy and pathologic processes.4 Patient movement, vascular pulsation, and physiologic motion of the globe contribute to image artifacts. Metallic artifacts from eye makeup and lid tattoos may also obscure orbital imaging.33,37,50

Limited Patient Selection

Patients who are claustrophobic or obese may not be candidates for MRI because of the small bore of the magnet. MRI is also contraindicated in patients with pacemakers, ferrous intracranial vascular clips, and intraocular metallic foreign bodies. It requires special equipment and precautions for those who require cardiac monitoring or life-support equipment.37,50

Higher Cost of MRI Units and Examinations

MRI equipment is expensive to purchase, maintain, and operate; therefore, MRI examinations may cost two or three times more than comparable CT scans.37

Back to Top
FUTURE APPLICATIONS
Advancements in MRI technology are rapidly proliferating, and the full potential of MRI is yet to be realized. Anticipated improvements in equipment include development of higher field strength magnets, improvements in magnet construction, more efficient receiver RF surface coils, development of new pulse sequences, and further refinement of computer software. Certain applications, discussed next, appear especially capable of making promising contributions to the study of disease.

SPECTROSCOPY

Localized in vivo spectroscopy uses MRI technology to analyze the physiochemical processes of body tissues. Ions of hydrogen, carbon, sodium, and phosphorus can provide information about the physiology, biochemistry, and metabolism of normal and disease states. Very strong magnetic fields are necessary to process the weak signals emitted by these nuclei, which are in relatively small concentrations. This information may be presented by either quantitative graphic representation or two-dimensional slice images. Hydrogen spectroscopy is currently in widespread use for evaluation of brain disease. Its use in the orbit is hindered by the relatively low spatial resolution and artifacts related to bone and air surrounding the orbit.37,90,91 Thus far, there has been limited investigational use of carbon, sodium, and phosphorus spectroscopy for evaluation of central nervous system pathology because of the relatively low abundance of these substances in the tissues as compared with hydrogen atoms. Its use for evaluation of orbital disease has not yet been established.

This noninvasive method of studying disease has the potential to help differentiate certain pathologic processes and their response to therapy in the future. For example, the sodium ion plays a major part in the initiation of mitosis and the maintenance of cellular proliferation; thus, sodium MR images have demonstrated an increased sodium signal in malignant tumors. Phosphorus-containing compounds, such as adenosine triphosphate, are involved in numerous metabolic processes and may provide information about intracellular pH, tissue metabolic rates and energy states, and the concentration of particular metabolites.20,37,92

CINE–MAGNETIC RESONANCE IMAGING

A new method called cine-MRI uses gradient-echo images acquired in short millisecond scan times providing information about blood and cerebrospinal fluid flow in the spine and brain. Abnormal flow patterns of cerebrospinal fluid have been identified in patients with Chiari I malformations and syringomyelia.93 Cine-MRI can also be used to dynamically observe extraocular muscle movements. These images typically have lower spatial and contrast resolution than conventional scans, however.

NEW CONTRAST AGENTS

Although Gd-DTPA is the only currently available contrast agent for clinical MRI, other classes of agents are being investigated. Paramagnetic-labeled monoclonal antibodies and pharmaceuticals appear promising for studies of immunology, physiology, and pharmacology.20 Particulate iron oxide agents may provide new information about the reticuloendothelial system.29

Back to Top
REFERENCES

1. Lezzoni LL, Grad O, Moskowitz MA: Magnetic resonance imaging. Overview of the technology and medical applications. Int J Technol Assess Health Care 1:481, 1985

2. Steinberg EP, Cohen AB: NMR: Historical and technical background. In: Nuclear Magnetic Resonance Imaging Technology: A Clinical, Industrial, and Policy Analysis (OTA Health Technology, Case Study 27), pp 15–22. Washington, DC, US Congress Office of Technology Assessment, 1984

3. Morgan CJ, Hendee WR (eds): The evolution of nuclear magnetic resonance. In: Introduction to Magnetic Resonance Imaging, pp 1–11. Denver, Multi-Media Publishing, 1984

4. Persson BR: Magnetic resonance imaging: Present application and projected development. Int J Technol Assess Health Care 1:585, 1985

5. Dortzbach RK, Kronish JW, Gentry LR: Magnetic resonance imaging of the orbit. Part I. Physical principles. Ophthal Plast Reconstr Surg 5:151, 1989

6. Azar-Kia B, Naheedy MH, Elias DA, et al: Optic nerve tumors: Role of magnetic resonance imaging and computed tomography. Radiol Clin North Am 25:561, 1987

7. Zimmerman CF, Schatz NJ, Glaser JS: Magnetic resonance imaging of optic nerve meningiomas. Ophthalmology 97:585, 1990

8. Jay WM: Advances in magnetic resonance imaging. Am J Ophthalmol 108:592, 1989

9. Council on Scientific Affairs: Magnetic resonance imaging of the central nervous system. JAMA 259:1211, 1988

10. Steinberg EP, Cohen AB: NMR: Historical and technical background. In: Nuclear Magnetic Resonance Imaging Technology: A Clinical, Industrial, and Policy Analysis (OTA Health Technology, Case Study 27), pp 25–35. Washington, DC, US Congress Office of Technology Assessment, 1984

11. Council on Scientific Affairs: Fundamentals of magnetic resonance imaging. JAMA 258:3417, 1987

12. Sassani JW, Osbakken MD: Anatomic features of the eye disclosed with nuclear magnetic resonance imaging. Arch Ophthalmol 102:541, 1984

13. Tomsak RL: Magnetic resonance imaging in neuro-ophthalmology.In: Focal Points 1986: Clinical Modules for Ophthalmologists, Vol IV, Module 10, pp 1–12. San Francisco, American Academy of Ophthalmology, 1986

14. Morgan CJ, Hendee WR: Introduction to Magnetic Resonance Imaging, pp 13–42. Denver, Multi-Media Publishing, 1984

15. Elliott DO: Magnetic resonance imaging fundamentals and system performance. Radiol Clin North Am 25:409, 1987

16. Wehrli FW, Kanal E: Orbital imaging: Factors determining magnetic resonance imaging appearance. Radiol Clin North Am 25:419, 1987

17. Wolf CL, Popp C: Understanding the influence of blood flow on nuclear magnetic resonance images. In Moss AA, Ring EJ, Higgins CB (eds): NMR, CT, and Interventional Radiology, pp 203–208. San Francisco, University of California Printing Department, 1984

18. Haacke EM, Frahm J: A guide to understanding key aspects of fast gradient-echo imaging. J Magn Reson Imaging 1:621, 1991

19. Elester AD. Gradient echo imaging: Techniques and acronyms. Radiology 186:1, 1993

20. Consensus Conference: Magnetic resonance imaging. JAMA 259:2132, 1988

21. Hosten N, Sander B, Cordes M, et al: Graves ophthalmopathy: MR imaging of the orbits. Radiology 172:759, 1989

22. Guy J, Mancuso A, Quisling RG: Gadolinium-DTPA–enhanced magnetic resonance imaging in optic neuropathies. Ophthalmology 97:592, 1990

23. Simon J, Szumowski J, Totterman S, et al: Fat-suppression MR imaging of the orbit. AJNR Am J Neuroradiol 9:961, 1988

24. Atlas SW, Grossman RJ, Hackney DB, et al: STIR MR imaging of the orbit. AJR Am J Roentgenol 151:1025, 1988

25. Ross JS, Masaryk TJ, Modic MT, et al: Intracranial aneurysms: Evaluation by MR angiography. AJNR Am J Neuroradiol 111:449, 1990

26. Pernicone JR, Siebert JE, Potchen EJ, et al: Three-dimensional phase-contrast MR angiography in the head and neck: Preliminary report. AJNR Am J Neuroradiol 11:457, 1990

27. Ruggieri PM, Laub GA, Masaryk TJ, Modic MT: Intracranial circulation: Pulse-sequence considerations in three-dimensional (volume) MR angiography. Radiology 171 :785, 1989

28. Vogl TJ, Bergman C, Villringer A, et al: Dural sinus thrombosis: Value of venous MR angiography for diagnosis and followup. Am J Roentgenol 162:1191, 1994

29. Council on Scientific Affairs: Fundamentals of magnetic resonance imaging. JAMA 258:3417, 1987

30. Chambers RB, Davidorf FH, McAdoo JF, et al: Magnetic resonance imaging of uveal melanomas. Arch Ophthalmol 105:917, 1987

31. Sullivan JA, Harms SE: Surface-coil MR imaging of orbital neoplasms. AJNR Am J Neuroradiol 7:29, 1986

32. Morgan CJ, Hendee WR: Introduction to Magnetic Resonance Imaging, pp 59–64. Denver, Multi-Media Publishing, 1984

33. Smith FW, Crosher GA: Mascara: Unsuspected cause of magnetic resonance imaging artifact. Magn Reson Imaging 3:287, 1985

34. Shellock FG: Biological effects and safety aspects of magnetic resonance imaging. Magn Reson Q 5:243, 1989

35. Lagouros PA, Langer BG, Peyman GA, et al: Magnetic resonance imaging and intraocular foreign bodies. Arch Ophthalmol 105:551, 1987

36. Persson BR, Stahlberg F: Safety aspects of magnetic resonance examinations. Int J Technol Assess Health Care 1:647, 1985

37. Dortzbach RK, Kronish JW, Gentry LR: Magnetic resonance imaging of the orbit. Part II. Clinical applications. Ophthal Plast Reconstr Surg 5:160, 1989

38. Moseley I, Brant-Zawadski M, Mills C: Nuclear magnetic resonance imaging of the orbit. Br J Ophthalmol 67:333, 1983

39. Thorn-Kany M, Arrue P, Delisle MB, et al: Carvernous hemangiomas of the orbit: MR imaging. J Neuroradiol 26:79, 1999

40. Bilaniuk LT: Orbital vascular lesions: Role of imaging. Radiol Clin North Am 37:169, 1999

41. Bond JB, Haik BG, Taveras JL, et al: Magnetic resonance imaging of orbital lymphangioma with and without contrast enhancement. Ophthalmology 99:1318, 1992

42. Kazim M, Kennerdell JS, Rothfus W, Marquardt M: Orbital lymphangioma: Correlation of magnetic resonance images and intraoperative findings. Ophthalmology 99:1588, 1992

43. Selva D, Strianese D, Bonavolonta G, Rootman J: Orbital venous-lymphatic malformations (lymphangiomas) mimicking cavernous hemangiomas. Am J Ophthalmol 131:364, 2001

44. Rubin PA, Bilyk JR, Shore JW, et al: Magnetic resonance imaging of the lacrimal drainage system. Ophthalmology 101:235, 1994

45. Aletich V, Misra M, Shownkeen H, et al: Evaluation and endovascular treatment of juxtaorbital vascular anomalies. Radiol Clin North Am 37:123, 1999

46. Hollander M, FitzPatrick M, O'Connor S, et al: Optic gliomas. Radiol Clin North Am 37:59,1999

47. Naheedy MH, Haag JR, Azar-Kia B, et al: MRI and CT of seller and parasellar disorders. Radiol Clin North Am 25:819, 1987

48. Guy J, Fitzsimmons J, Ellis A, et al: Gadolinium-DTPA–enhanced magnetic resonance imaging in experimental optic neuritis. Ophthalmology 97:601, 1990

49. Mafee M, Goodwin J, Dorodi S: Optic nerve sheath meningiomas. Radiol Clin North Am 37:37,1999

50. Bilaniuk LT, Atlas SW, Zimmerman RA: Magnetic resonance imaging of the orbit. Radiol Clin North Am 25:409, 1987

51. Prummel MF, Gerding MN, Zonneveld FW, Wiersinga WM: The usefulness of quantitative orbital magnetic resonance in Graves' ophthalmopathy. Clin Endocrinol (Oxf) 54:205, 2001

52. So NM, Lam WW, Cheng G, et al: Assessment of optic nerve compression in Graves' ophthalmopathy: The usefulness of a quick T1-weighted sequence. Acta Radiol 41:559, 2000

53. Wilbur AC, Dobben GD, Linder B: Paraorbital tumors and tumor-like conditions: Role of CT and MRI. Radiol Clin North Am 25:631, 1987

54. Wenig B, Mafee MF, Ghosh L: Fibro-osseous and cartilaginous lesions of the orbit and paraorbital region. Radiol Clin North Am 36:1241,1998

55. Weber AL, Mikulis DK: Inflammatory disorders of the paraorbital sinuses and their complications. Radiol Clin North Am 25:615, 1987

56. Tassel PV, Lee Y, Jing B, et al: Mucoceles of the paranasal sinuses: MR imaging with CT correlation. AJNR Am J Neuroradiol 10:67, 1989

57. Kersten RC, Kersten JL, Bloom HR, et al: Chronic hematic cyst of the orbit. Ophthalmology 95: 1549, 1988

58. Kleinheinz J, Stamm T, Meier N, et al: Three-dimensional magnetic resonance imaging of the orbit in craniofacial malformations and trauma. Int J Adult Orthodon Orthognath Surg 15:64, 2000

59. Glatt HJ, Custer PL, Barrett L et al: Magnetic resonance imaging and computed tomography in model of wooden foreign bodies in the orbit. Ophthal Plast Reconstr Surg 6:108, 1990

60. Green BF, Kraft SP, Carter KD, et al: Intraorbital wood: Detection by magnetic resonance imaging. Ophthalmology 97:608, 1990

61. Nasr AM, Haik BG, Fleming JC, et al: Penetrating orbital injury with organic foreign bodies. Ophthalmology 106: 523, 1999

62. McGuckin JF Jr, Akhtar N, Ho VT, et. al: CT and MR evaluation of a wooden foreign body in an in vitro model of the orbit. AJNR Am J Neuroradiol 17:129, 1996

63. Dobben GD, Philip B, Mafee MF, et al: Orbital subperiosteal hematoma, cholesterol granuloma, and infection: Evaluation with MR imaging and CT. Radiol Clin North Am 36:1185, 1998.

64. Atlas SW, Grossman RI, Savino PJ, et al: Surface-coil MR of orbital pseudotumor. AJR Am J Roentgenol 148:803, 1987

65. Kattah J, Chrousos G, Roberts J: Metastatic prostate cancer to the optic canal. Ophthalmology 100:1711, 1993

66. Peyster RG, Shapiro MD, Haik BG: Orbital metastasis: Role of magnetic resonance imaging and computed tomography. Radiol Clin North Am 25:647, 1987

67. Eustis H, Mafee MF, Walton C, et al: MR imaging and CT of orbital infections and complications in acute rhinosinusitis. Radiol Clin North Am 36:1165, 1998

68. Igarishi H, Igarishi S, Fujio N, et al: Magnetic resonance imaging in the early diagnosis of cavernous sinus thrombosis. Ophthalmologica 209:292, 1995

69. Flanders AK, Espinosa GA, Markiewicz GA, et al: Orbital lymphoma. Radiol Clin North Am 25:601, 1987

70. Weber A, Romo L, Sabates N: Pseudotumor of the orbit. Radiol Clin North Am 37:151, 1999

71. Yousem DM, Atlas SW, Grossman RI, et al: MR imaging of Tolosa–Hunt syndrome. AJNRAm J Neuroradiol 10:1181, 1989

72. Cytryn A, Putterman A, Schneck G, et al: Predictability of magnetic resonance imaging in differentiation of orbital lymphoma from orbital inflammatory syndrome. Ophthal Plast Recontr Surg 13:129, 1997

73. Gufler H, Laubenberger J, Gerling J, et al: MRI of lymphomas of the orbits and the paranasal sinuses. J Comput Assist Tomogr 21:887, 1997

74. Mafee MF, Edward DP, Koeller KK, Dorodi S: Lacrimal gland tumors and simulating lesions: Clinicopathologic and MR imaging features. Radiol Clin North Am 37: 219, 1999

75. Mafee MF, Haik BG: Lacrimal gland and fossa lesions: role of computed tomography. Radiol Clin North Am 25:767, 1987

76. Rubin PAD, Bilyk JR, Shore JW, et al: Magnetic resonance imaging of the lacrimal drainage system. Ophthalmology 101:235, 1994

77. Kirchhof K, Hahnel S, Jansen O, et al: Gadolinium-enhanced magnetic resonance dacryocystography in patients with epiphora. J Comput Assist Tomogr 24:327, 2000

78. Manfre L, de Maria M, Todaro E, et al: MR dacryocystography: Comparison with dacryocystography and CT dacryocystography. AJNR Am J Neuroradiol 21:1141, 2000

79. Yoshikawa T, Hirota S, Sugimura K: Topical contrast-enhanced magnetic resonance dacryocystography. Radiat Med 18:355, 2000

80. Hunink MG, Slegte RGM, Hoogesteger MF: ROC analysis of the clinical, CT and MRI diagnosis of orbital space-occupying lesions. Orbit 8:173, 1989

81. Mafee MF: Uveal melanoma, choroidal hemangioma, and simulating lesions: Role of MR imaging. Radiol Clin North Am 36:1083, 1998

82. Mafee MF, Peyman GA, Peace JH, et al: Magnetic resonance imaging in the evaluation and differentiation of uveal melanoma. Ophthalmology 94:341, 1987

83. Bond JB, Haik BG, Mihara F, Gupta KL: Magnetic resonance imaging of choroidal melanoma with and without gadolinium contrast enhancement. Ophthalmology 98:459, 1991

84. Scott IU, Murray TG, Hughes R: Evaluation of imaging techniques for detection of extraocular extension of choroidal melanoma. Arch Ophthalmol 116:897, 1998

85. Kaufman LM, Mafee MF, Song CD: Retinoblastoma and simulating lesions: Role of CT, MR imaging and use of Gd-DTPA constrast enhancement. Radiol Clin North Am 36:1101, 1998

86. Ainbinder DJ, Haik BG, Mazzoli RA: Anophthalmic socket and orbital implants: Role of CT and MR imaging. Radiol Clin North Am 36:1133, 1998

87. De Potter P, Shields CL, Shields JA, et al: Role of magnetic resonance imaging in the evaluation of the hydroxyapatite orbital implant. Ophthalmology 99:824, 1992

88. De Potter P, Duprez T, Cosnard G: Postcontrast magnetic resonance imaging assessment of porous polyethylene orbital implant (Medpor). Ophthalmology 107:1656, 2000

89. Joynt RJ: Neurology. JAMA 261:2859, 1989

90. Greiner JV, Kopp SJ, Glonek T: Phosphorus nuclear magnetic resonance and ocular metabolism. Surv Ophthalmol 30:189, 1985

91. Kolodny NH, Gragoudas ES, D'Amico DJ, et al: Preliminary results on phosphorus-31 nuclear magnetic resonance evaluation of human uveal melanoma in enucleated eyes. Ophthalmology 95:666, 1988

92. Holman RE, Grimson BS, Drayer BP, et al: Magnetic resonance imaging of optic gliomas. Am J Ophthalmol 100:596, 1985

93. Leeds LE, Jacobson HG: Radiology. JAMA 261:2885, 1989

Back to Top