|
|
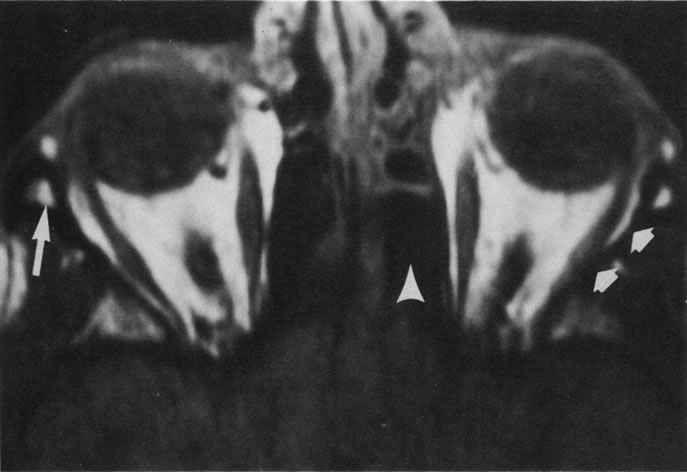
| Fig. 8. T1-weighted image shows the excellent contrast resolution of the soft tissues of the orbit. Note the contrast between the high-intensity (bright) signal of orbital fat and intermediate signal of the extraocular muscles and optic nerves. The lens, vitreous, and sclera can also be easily distinguished. The air in the ethmoidal sinuses emits no signal and therefore appears dark (arrow-head). The left lateral orbital wall also appears dark because of the low proton density and free-water content of cortical bone (short arrows). The bone marrow in the right orbital rim is depicted by a bright signal as a result of its fat contents (long arrow). (Dortzbach RK, Kronish JW, Gentry LR: Magnetic resonance imaging of the orbit. Part II. Clinical applications. Ophthal Plast Reconstr Surg 5:161, 1989) |