Chapter 2
Neuro-Ophthalmologic Examination: The Visual Sensory System
BARRY SKARF, JOEL S. GLASER and GARY L. TRICK
Main Menu   Table Of Contents

Search

ANATOMY AND PHYSIOLOGY OF THE SENSORY VISUAL PATHWAYS
NEURO-OPHTHALMOLOGIC EVALUATION OF VISUAL FUNCTION
VISUAL FIELDS AND PERIMETRY
ELECTROPHYSIOLOGY TESTS OF THE EYE AND VISUAL PATHWAY
REFERENCES

We have instruments of precision in increasing numbers with which we and our hospital assistants at untold expense make tests and take observation, the vast majority of which are but supplementary to the careful study of the patient by a keen observer using his eyes and ears, and fingers and a few simple aids.

Harvey Cushing

The goal of the neuro-ophthalmologic examination of the visual sensory system is to discover and diagnose abnormalities of the neural projections from the retina to the visual centers in the brain, and of disturbances of higher visual integration. In order to succeed at this task, we must take into account the physical properties of light and, more importantly, the anatomic and physiologic properties of the retina and the eye's optical system. Consequently, a review of relevant anatomy and physiology is essential.

Back to Top
ANATOMY AND PHYSIOLOGY OF THE SENSORY VISUAL PATHWAYS
Normal human vision is not a single unitary faculty, but rather a synthesis of multiple semiautonomous functional subsystems, segregated into sets of separate pathways or “channels” between the eye and brain.1,2 This functional division into multiple channels is evident for both subcortical visual processes and in the primary visual cortex. Although there is extensive interaction, these visual channels transmit particular classes of visual information.1–4 Visual deficits that arise from diverse disease processes can selectively disturb these subsystems at various levels, giving rise to localizing subjective and objective signs.

RETINA

There are an average of 57.4 million rods and 3.3 million cones in the human retina.5 The cones each contain one of three photopigments with a maximum absorption at about 440 nm (S, short wave length sensitive; blue) 535 nm (M, medium; green), and 577 nm (L, long; red), respectively. The fovea centralis contains approximately 200,000 cones/mm2. Outside the fovea, the average density of cones is about 5,000/mm2, but the distribution of cones is not uniform. Cone density declines rapidly with distance from the fovea. In contrast, the density of rods is nil at the foveola, increasing rapidly with eccentricity to peak at 3 mm (20°) from the fovea, where there are 150,000 rods/mm2. The concentration of rods then decreases more gradually than does cone density, to about 35,000 rods/mm2 at the periphery of the retina.

The photoreceptor cells of the retina connect to the ganglion cells via bipolar cells that respond either to increments (“on-type”) or decrements (“off-type”) in light. Rods connect only to on-type bipolar cells, whereas cones connect with both on and off types.6 One on-type and one off-type bipolar cell innervate each ganglion cell, with the on bipolar exciting an on ganglion cell or inhibiting an off ganglion cell and vice versa. Bipolar cells also provide lateral connections to horizontal, amacrine, and interplexiform cells.7

The distribution of retinal ganglion cells is even more uneven than that of rods and cones. In the foveola, approximately 150,000 cones are connected to twice as many ganglion cells, because each cone connects via bipolar cells to two ganglion cells, one on and one off type.8 With increasing eccentricity from the fovea, gradually more photoreceptors converge onto single bipolar and retinal ganglion cells, which decrease markedly in density toward the periphery.8,9 In the far retinal periphery, there may be as many as 10,000 rods connected in clusters to a single ganglion cell, with considerable overlapping of clusters so that a point stimulus of light can trigger responses from several ganglion cells at once.

Patterns of neural interactions among various cell types in the retina have been studied and described. Rods and cones differ substantially in the patterns of their respective connections. These different patterns result in low spatial frequency (large size) contrast sensitivity for rod (scotopic) vision and high spatial frequency (fine detail) sensitivity for cone (photopic) vision.10

Receptive Fields

As a result of this architecture, it is possible to define the receptive field as the unit area of retinal function. The receptive field of a neuron is the retinal area for which a visual stimulus causes a change in the activity of that neuron. Receptive field sizes are smallest at the fovea and enlarge with retinal eccentricity as a consequence of the increase in the ratio of photoreceptors to ganglion cells.11 Under photopic conditions, the size of the on-type receptive field center is 4.5' to 9' at the fovea, increasing to 60' to 90' at 10° to 15° beyond the fovea and to 120' to 200' at 60° to 70° from the fovea. Similar to the inverse relationship between receptive field size and ganglion cell density, the number of overlapping receptive field centers at a given retinal point also decreases toward the periphery, from 32 centers at 10° of eccentricity to 13 at 70° of eccentricity.12 As a result, visual sensitivity decreases gradually with distance from the fovea.13 The retinal ganglion cell population, like the number of photoreceptors, decreases with aging,14 along with neuronal loss in the visual cortex of the brain. These phenomena are reflected in the decrease in overall visual sensitivity that occurs with aging.

Ganglion Cells and On/Off Dichotomy

One million retinal ganglion cells can be subdivided into at least 11 different classes. An average of 85% of these cells have concentrically organized center-surround receptive fields with two antagonistic regions. There are two types: on-center cells have a center that is activated by light, with an inhibitory surround, whereas off-center cells are excited by decrements in light falling inside their center and are inhibited by light decrements in their surround zone.15 The remaining 15% of the ganglion cells have no antagonistic surround mechanism, and the receptive field is nonconcentric. Generally, the diameter of the ganglion cell excitatory receptive field center is equal to the field size of its dendritic distribution within the retina.16

Studies have shown that the surround area of a receptive field is formed by interactions among horizontal and amacrine cells and not by convergence of input from on and off ganglion cells.17 Furthermore, the on and off retino-geniculo-striate pathways remain segregated up to the visual cortex, where they first converge onto single cortical neurons. The organization of cortical receptive fields is likely the product of intracortical circuitry, and not the result of convergence of the on and off pathways.6,17

Retino-Cortical Visual Pathway

Visual information originating from the retinal ganglion cells is transmitted via the optic nerve, which is formed at the optic disc by the retinal nerve fiber layer. The retinal nerve fiber layer can be divided into three topographic sectors: (a) the papillomacular bundle, which serves the macula and hence the central field of vision; (b) the relatively thick superior and inferior arcuate bundles, which roughly parallel their respective vascular arcades; and (c) the nasal radial bundles, which expand outward from the nasal aspect of the disc (see Chapter 4, Fig. 2). Lesions affecting each of these topographic sectors of the retina or optic disc produce characteristic patterns of visual field loss. Disruption in the papillomacular bundle results in a central or centro-cecal scotoma. Lesions of the arcuate bundles cause nasal depressions that form a “step” border at the horizontal meridian and arcuate scotomas in the superior and inferior hemifields (see Chapter 5, Figs. 4 and 7). Lesions of the nasal bundles produce wedge-shaped, sectorial defects radiating from the temporal aspect of the blind spot.

The optic nerve leaves the eye at the lamina cribrosa of the optic disc and meets the fellow optic nerve intracranially at the optic chiasm, where the optic nerve fibers coming from the nasal hemiretina cross to join the temporal hemiretinal fibers from the fellow eye. Lesions of the optic chiasm characteristically lead to complete or incomplete bitemporal hemianopias that are morphologically limited, at least in part, by the vertical meridian of the visual field (see Chapter 6).

Behind the optic chiasm, the retinal ganglion cell axons form the optic tract and travel to synapse in the lateral geniculate nucleus (LGN) of the posterior thalamus. The LGN is a compact structure made up of six layers in which the projections from each eye remain segregated. Layers 1, 4, and 6 receive inputs exclusively from the contralateral eye, and layers 2, 3, and 5 are innervated only by the ipsilateral eye (see Chapter 4). LGN postsynaptic neurons project to the visual cortex via the optic radiations. Lesions affecting the optic tract, LGN, optic radiations, and visual cortex produce hemifield defects (hemianopia) that are homonymous (i.e., occupy the same side of the visual field in both eyes, respecting the vertical meridian) (see Chapter 7).

Parallel Visual Pathways

Visual stimuli are processed via multiple neural channels, or parallel pathways (see Chapter 4, Fig. 12), which are specialized to transmit specific visual information.1,2,4 These neural channels become differentiated in the retina, where complex interactions and processing begin. They project from the retinal ganglion cells to the cortex, which is ultimately responsible for subjective visual perception.

MAGNOCELLULAR AND PARVOCELLULAR PARALLEL PATHWAYS

Based on their morphology and response characteristics, retinal ganglion cells have been classified as P type, for those projecting to the parvocellular layers (layers 3 to 6) of the LGN; and M type, for those projecting to the magnocellular layers (layers 1 and 2) of the LGN.18 Parvocellular (P) retinal ganglion cells have small receptive field diameters, and small somal and axonal caliber, whereas magnocellular (M) retinal ganglion cells have large receptive fields (nearly six times larger than P cells), large cell bodies and axons.18 In accordance with their smaller receptive fields, P cells have higher spatial resolution.19 The conduction velocity of the visual signal is higher in M cells, as expected from their large axons, but M-type ganglion cells are 3 to 10 times less numerous than the P-type.20 The center-surround mechanism of M cells is more sensitive to achromatic luminance contrast as opposed to the dominant feature of color opponens in 80% of P-type cells. The sensitivity of M cells to achromatic contrast becomes most pronounced at short stimulus exposure durations, as they respond to visual stimuli transiently, at lower stimulus contrasts (below 15% contrast),20 and at lower levels of adapting background luminance.21

Most cones providing input to the center and surround of M cells are red and green types, and only some M cells appear to receive input from blue cones. The signals from blue (short wavelength sensitive) cones are transmitted via P cells and almost exclusively via the on pathway.22

In monkey eyes, selective lesions of the parvocellular system impair visual acuity, color vision, high spatial frequency (i.e., small size) and low temporal frequency (i.e., slow flicker) contrast sensitivity, brightness discrimination, pattern (shape and texture) discrimination, and stereopsis, whereas magnocellular lesions distort low spatial frequency contrast sensitivity, fast flicker, and low-contrast fast motion perception.2,23 In humans, the parvocellular system is affected by optic neuritis,24 and the magnocellular system is damaged preferentially in glaucoma.25

ON AND OFF PATHWAYS

On and off pathways also remain morphologically segregated in the LGN. On-center ganglion cells are concentrated in layers 5 and 6, and off-center cells are concentrated in layers 3 and 4 of the parvocellular LGN.25 The magnocellular layers 1 and 2 have a mixture of both types of cells.

On and off pathways provide equal sensitivity and rapid information transfer for both light increments and decrements and facilitate the transmission of high-contrast sensitivity information,6 which is processed mainly by the magnocellular system. On and off pathways that subserve brightness are important contributors to color contrast perception, which is mediated mainly by the parvocellular pathway.26

Visual Cortex and Magnification Fator

The scale with which the visual field is mapped onto the striate cortex is dependent on eccentricity; the fovea is represented by a large area of visual cortex, and the periphery claims a relatively much smaller portion (see Chapter 4, Fig. 11).27 The central 10° field is represented by at least 60% of the occipital cortex. The cortical magnification factor (M) indicates the surface area of cortex associated with each unit area of visual field and is determined by the following relationship28:

M2 = mm2 cortex/degree2

VISUAL ACUITY

Visual acuity refers to the overall sensitivity of the visual system to spatial detail and is typically measured by determining the threshold for detecting a spatial component of a visual stimulus. This concept was introduced by Helmholtz,29 who first coined the term minimum separable to indicate the minimum spatial interval between two points of light sufficient to permit the visual system to perceive their duality. He thought that a distance just greater than one cone diameter should allow stimulation of two cones in the foveola, each with its own ganglion cell and “private line” into the central nervous system. In actual testing, however, the frequency with which subjects correctly identify dual lines increases gradually as the actual separation is increased (a frequency-of-seeing curve is used to represent this phenomenon),30 and the threshold separation often is specified as an arbitrary percentage, somewhat greater than 50%, of correct responses that an individual theoretically could achieve by random guessing. Clinically, however, the term visual acuity has come to describe standard measures of “minimal angle of resolution,” the threshold or minimal separation between two distinct visual stimuli (measured in degree of visual angle) that can be perceived visually under certain controlled operative conditions.31

Visual acuity measures both the optical quality of the retinal image and the functionality of the neural structures carrying the foveal projections to the striate cortex. Therefore, reduced visual acuity can be produced either by degrading the optical quality of the eye or a disruption of the fovea or its neural projections to the brain. The optical system of the eye is adversely affected by refraction (focus), light-scattering, diffraction, and absorption by the preretinal media. Among optical factors, diffraction causes spreading of light even in a perfectly focused system, and it varies inversely with pupil size.31 With pupil diameters of less than about 2.5 mm, “spread” of an optimally focused single point becomes progressively larger; thus, acuity decreases as pupil size is reduced below this diameter. For eyes with pupils between 2.5 and 6 mm in diameter, acuity remains relatively constant, whereas with pupils larger than 6 mm, optical aberration degrades acuity.31 Optical aberration occurs when light rays entering a large pupil do not converge precisely to a point.

Campbell and Green32 showed that the human visual system is capable of resolving a higher–spatial frequency (finer) grating if the optics of the eye are bypassed by producing the grating directly on the retina using laser-generated interference fringes. Diffraction in the eye lowers contrast of an optical image grating, but not the contrast of a laser-generated interference fringe grating. Improvement of performance (resolution of higher–spatial frequency gratings) obtained with increased contrast indicates, for the foveolar cones, that contrast sensitivity is a key factor determinin the minimal angle of resolution (i.e., acuity). Another factor, the ultrastructure of the ocular media, can cause both backward and forward scattering of light that degrades the quality of the optical image. In addition, the ocular media are neither fully nor uniformly transparent to light, and some light is absorbed by these media. This absorption is wavelength dependent such that the shorter the wavelength of light entering the eye (i.e., toward the blue-violet), the greater the absorption.

Visual acuity also depends on the spatial arrangement and concentration of the photoreceptor mosaic in the foveola, which set an upper limit for spatial resolution. As Helmholtz first proposed, acuity is limited because of the finite size of the retinal receptors, but the neural connections among retinal cells may converge to produce larger summation areas less sensitive to fine detail.

The physical properties of the visual stimulus used to test acuity and the situation in which it is presented also influence discrimination. Most factors that affect light sensitivity influence visual acuity. Maximal acuity occurs in the range of photopic light levels at which the foveolar cones function optimally.33 These cone pathways have the highest light thresholds and operate poorly in dim (scotopic) light. Visual acuity falls off abruptly as light levels are reduced, principally because parafoveal cones and rods, which have greater light sensitivity, also have poorer spatial resolution.33 This is primarily a result of neural factors such as the larger summation area of the parafoveal receptor fields (greater numbers of cones and rods converging onto the same single ganglion cell). Visual acuity, maximal at the center of the fovea, decreases with eccentricity; for example, there is a 60% decrease in acuity at 1° off the foveola. Of course, adequate illumination is critical to cone function, and at very low light levels, when vision is dependent exclusively on rod function, acuity falls off abruptly. Maximal rod acuity is about 8 minutes of arc (20/160).33

Acuity is also dependent on background adapting luminance and stimulus contrast. The sensitivity of the eye for the detection of a stimulus varies with the level of adaptation to ambient light levels. The light and dark adaptation have two mechanisms, namely, a neural process that is completed in about 0.5 seconds and a slower photochemical process involving molecular changes in visual pigment that occurs in about 1 minute for light adaptation and 45 minutes for dark adaptation.34 Above the retinal illuminance level of 3.2 × 10⁻³ cd/m2, cones begin to contribute to visual sensitivity along with the rods (mesopic light level). Traditionally, rods are taken to be saturated at approximately 3 cd/m2, but above this level rods still contribute to color vision and pupil size.35 Nonetheless, the conventional adapting luminance used with the Goldmann perimeter, which is 10 cd/m2, is regarded as representative of the mesopic level.

The duration of stimulus presentation also influences measured acuity. For very brief presentations, acuity remains constant as long as the number of quanta absorbed remains constant (by increasing stimulus intensity in proportion to the decrease in the duration it is presented). For longer presentations, lasting 100 to 500 milliseconds, acuity improves with increasing duration, even though summation is no longer a factor.33

Finally, interactions between the stimulus used to test acuity and objects adjacent to it can also adversely affect acuity measures. This phenomenon often is referred to as “crowding” because visual acuity suffers when neighboring contours are too close (i.e., within a few minutes of arc).31 Detection acuity is a measure of the smallest stimulus object or pattern of elements that can be discriminated from a uniform background or distinguished as a single feature. Consequently, detection acuity typically is specified as minimum angle of detection or minimum angle visible. Resolution acuity refers to the smallest amount of spatial detail necessary to distinguish a difference between patterns or identify features in a visible target. When resolution acuity is measured, the size of the stimulus is increased or decreased to determine the threshold size that elicits a correct response. Resolution acuity is specified as minimum angle of resolution, or MAR. Identification (or recognition) acuity is a measure of the minimum spatial detail necessary to recognize an object (e.g., an optotype) or identify the relative location of visible features in an object (e.g., the open segment of a ring). Identification acuity also is specified in terms of MAR.

Traditional Snellen charts and similar displays of letters, numbers, or symbols (optotypes) have been used to measure visual acuity clinically. These charts provide a high-contrast, clearly visible target and require that the patient identify or recognize the letters or symbols based on the spatial arrangement of their components. The size (minimum angle subtended by the components of the stimuli) varies; hence, the patient's MAR is determined. However, as indicated, MAR can fluctuate depending on proximity or presence of adjacent stimuli. In order to control this effect, especially in clinical studies such as controlled trials, the standard types of acuity charts have been replaced by other types of charts, most notably the Bailey-Lovie logarithm of the minimum angle of resolution (logMAR) acuity chart,37 which was first widely used in the Early Treatment Diabetic Retinopathy Study (ETDRS).38 This system of acuity measurement addresses several key deficiencies of the standard clinical (Snellen-type) chart. It uses: (a) letters that are comparably difficult to identify, (b) an equal number of letters on each line, (c) proportional spacing between letters, and (d) logarithmic progression of size from line to line. These innovations adjust for the fact that not all letters of the alphabet are equally recognizable, and they attempt to standardize the effects of crowding while allowing proportional reductions of acuity to represent equivalent (logarithmic) decrements in resolution.

Other methods of evaluating visual acuity use letters or symbols of different contrast. The Pelli-Robson chart39 uses alphabetic letters of constant size that vary in contrast and measures the minimum contrast necessary for letter recognition. On the other hand, the chart devised by Regan and Neima40 resembles the Snellen and logMAR charts, with letters of decreasing size that are used as a measure of MAR. However, the Regan test provides a series of charts, each progressively decreasing in contrast (from black to medium to light gray optotypes on a white background) permitting measurement of low- as well as high-contrast acuity. Another sensitive index of visual–neural interactions is the measurement of hyperacuity, hich refers to certain spatial distinctions that can be observed for which the thresholds are lower than even normal acuity.33 The best-known example of hyperacuity is Vernier alignment, in which the displacement of one linear element (line segment) relative to another element, within the same target, must be judged.33 Hyperacuity thresholds can even exceed the upper limit for discrimination that is implied by the spatial arrangement of the foveal cones, a finding indicating that such testing measures a different mechanism than resolution acuity.

Although many useful and sensitive tests of visual acuity have been developed, none has succeeded in displacing high-contrast character acuity as the standard. Because Snellen (optotype) acuity remains the most widely used measure of visual function in clinical practice, it is important to understand its nomenclature, value, and limitations. Snellen acuity generally is reported in a fractional notation (e.g., 20/20) in which the numerator refers to the distance at which an individual can successfully read the letters, and the denominator refers to the distance at which “a normal eye” should distinguish the same letters. Therefore, an eye with 20/40 vision is able to read at a distance of 20 ft the letters a normal eye could read at 40 ft, but it is unable to read smaller letters. The fractional notation used for character acuity must be interpreted with caution for several reasons. First, Snellen notation cannot be treated mathematically as a fraction. Instead, the Snellen notation must be converted to decimal form (20/20 = 1.0, 20/30 = 0.66, 20/40 = 0.5, etc.) for mathematical treatment. However, even when this is done it must be realized that Snellen acuity is a logarithmic measure and that equal increments in the decimal notation do not represent equivalent changes in acuity. For example, acuity of 20/50 (= 0.40) represents twice the resolution of 20/100 (= 0.2), and it is represented by an incremental change of 0.2, whereas the doubling of acuity represented by a change from 20/200 (= 0.1) to 20/100 (= 0.2) is represented by an incremental change of 0.1. Perhaps more importantly, nominal changes in acuity do not reflect comparable changes in the health of the optical or neural substrates. Abnormalities resulting in 20/80 vision are not necessarily twice as severe as those producing 20/40 vision.

Another limitation on the interpretation of character acuity is that 20/20 is an excessively lenient criterion for “normal” MAR. Frisén and Frisén,41 in a normative study of 100 individuals at various ages, found that average performance was considerably better than 20/15, even for the elderly groups. An average normal subject had a 10% probability of discriminating letters just larger than 20/10 (decimal acuity 1.9) and a 90% probability of discriminating letters just larger than 20/15 (1.3). However, rather than using the usual office practice of requiring almost 100% performance on a line of letters, these authors chose a 50% probability-of-seeing (discriminating) criterion and a 10-letter Sloan chart as most suitable for this study. Whether one agrees with this choice or not, it is necessary to recognize that the criterion used in that study produces higher (better) acuities compared with the more stringent (90% to 100%) performance criterion used routinely in clinical practice.

CONTRAST SENSITIVITY

Standard tests of visual acuity (e.g., Snellen optotypes) generally measure resolution of fine detail at high contrast (black on white). However, common everyday visual experience is not a high-contrast phenomenon. Most objects are seen against a variable background or with other objects at a moderate or intermediate level of contrast. The visual scene typically is made up of large ad small objects with coarse outlines intermingled with fine detail and producing a mixture of stimuli that include gradual transitions between areas of light and dark, as well as abrupt transitions and sharp edges. This means that visual acuity as measured clinically does not begin to assess the capacity of our visual system to distinguish and identify a wide variety of different images. Selective loss of intermediate and low spatial frequencies may produce disturbing visual symptoms in patients with nominally “normal” visual acuity as measured with standard high-contrast, sharp-edged optotypes.

In visual physiology, contrast is defined as change in brightness across space or time. The change, whether spatial or temporal, may be gradual or abrupt (Fig. 1), single (only one transition) or repetitive (steady-state). If the visual stimulus consists of a repetitive pattern of varying luminance (e.g., a pattern of stripes or checks), then the pattern can be described in terms of spatial contrast. For most clinical and research purposes, the contrast of a visual stimulus is defined by the relationship between these intensities (I), such that

Fig. 1. Contrast sensitivity function. A. Sharp edge luminance change; square wave transition. B. Gradual luminance change; sine wave transition. (From Cornsweet, TN: Visual Perception. New York: Academic Press, 1970, with permission.)


Contrast =
(Imax − Imin)

(Imax + Imin)

Thus, contrast can vary from a minimum of 0 to maximum of 1.0. Using stimuli of decreasing contrast, visual function can be assessed by determining the minimum contrast or contrast sensitivity at which a specific test pattern can be detected. On the other hand, visual resolution is more directly related to the degree of spatial detail (i.e., the spatial frequency) of the pattern. Thus, spatial contrast sensitivity is a measure of the ability to resolve diverse patterns with a more obvious relationship to the range of everyday visual experience of discrimination and identification than is provided by routine clinical tests of visual acuity.

The most common stimuli for clinical evaluation of spatial contrast sensitivity are repetitive patterns of alternating light and dark bars in which the luminance of the bars varies sinusoidally along a single axis. This pattern is known as a sine wave grating (see Fig. 1B). The periodicity of the pattern is referred to as its spatial frequency and generally is specified in cycles (pairs of light and dark bars) per degree of visual angle. The spatial frequency is used to represent the degree of spatial detail in the stimulus. Thus, a relatively broad wave with cycles subtending 2° has a spatial frequency of 0.5 cycles per degree (cpd), whereas a narrower wave subtending 0.2° has a spatial frequency of 5 cpd. A true sinusoidal grating can be described by a single frequency and the contrast between the brightest and dimmest parts of the wave. On the other hand, a square wave grating is a pattern with sharp edges such as a series of dark and light bars (see Fig. 1A). Square wave gratings are complex visual stimuli made up of mixed spatial frequency components (many different waves of low and high frequencies). Similarly, a complex visual image in the real world, characterized by abrupt transition from bright to dark, is made of numerous high–spatial frequency components. In contrast, an image made up primarily of low–spatial frequency components should contain gradual transitions and little fine detail.

Human contrast sensitivity usually is tested using sine wave gratings of various frequencies. The contrast sensitivity for a particular spatial frequency grating is the inverse of the contrast threshold (i.e., the minimum contrast necessary for the pattern to be “just detectable”). The contrast sensitivity of the human visual systems varies with spatial frequency such that maximum sensitivity is normally for spatial frequencies of about 3 to 5 cpd; sensitivity falls off at both higher and lower spatial frequencies (Fig. 3). However, many factors affect the shape of the human contrast sensitivity curve (function), including background adaptation level, stimulus field size, retinal eccentricity, pattern orientation, pupil size, and defocus. Abnormalities of contrast sensitivity are known to occur in numerous retinal and optic nerve disorders as well as anterior segment disease, but the utility of contrast sensitivity testing for differentiating particular disorders remains an unresolved issue.

Fig. 3. Graphs of contrast sensitivity (ordinate) versus spatial frequency (abscissa). The normal range is shaded in gray. In the upper plot there is gradual fall-off of sensitivity at high spatial frequencies resulting from optical blur in the left eye. The lower plot illustrates selective loss of midspatial frequencies in a patient with optic neuritis of the right eye. (Courtesy Nicollet Co., Chicago.)

Color Vision

Within the limits of the visible spectrum (approximately 400 to 700 nm), the human visual system has a remarkably good sensitivity to differences in color. Color is largely determined by the physical properties of light energy entering the eye. However, the eye and visual pathways also influence subjective color perception. The physical properties of light (and their corresponding perceptual attributes) that characterize color are: (a) wavelength (hue), (b) intensity (luminance), and (b) colorimetric purity (saturation).42 Significantly, the color perceived also depends on the chromatic properties of surrounding objects and background.

Normal human color vision is trichromatic; an individual with normal color vision can match the color appearance of any colored field by appropriately adjusting the relative intensity of three suitably chosen unique primary colors. Indeed, Thomas Young in 1802 speculated that only three individual color-sensitive mechanisms, each with broad spectral sensitivity, are necessary to account for all color perception. However, it was not until 1964 that color matching experiments performed by the Nobel laureate George Wald43 revealed that mixtures of three primary colors are sufficient to produce the entire spectrum of perceptible colors. The trichromatic nature of normal human color vision is based on three distinct types of photopigments, each found in the outer segments of the specific cone photoreceptors. Each of the three photopigments has a broadband spectral absorption function with peak absorption in a distinct region of the visual spectrum, but with considerable overlap. This overlap provides for the fact that any given wavelength of light stimulates all three photopigments, but the strength of the photoreceptor response is at different levels for eachwavelength. Based on the unique absorption peak of the pigment in a particular cone photoreceptor, the designation of long- (L or red), medium- (M or green), and short- (S or blue) wavelength photoreceptors has become widely adopted. The population of cones with peak absorption close to the wavelength of a given light stimulus is activated most intensely, and the cones with peak sensitivity farthest from that wavelength respond least. It is the ratio of the activity generated by the three mechanisms that is specific for each wavelength of light. In this way, the retina can provide for discrimination of all wavelengths at each retinal locus by way of only three differentially sensitive cones at each locus.

The neural processing of color information is known to involve transformation of the signals from the three cone types such that, at the level of the optic nerve, color coding is not based on individual cone-specific responses, but it reflects excitatory (facilitatory) and inhibitory (opponent) interactions between the signals from the specific cone types. There are three color-opponent neural pathways that convey color information from the three classes of retinal cone photoreceptors: a red-green pathway that signals differences between L and M cone responses; a blue-yellow pathway that signals differences between S cone responses and a sum of L and M cone responses; and a luminance pathway that signals a sum of L and M cone responses. Functional magnetic resonance imaging suggests color-opponent encoding of cortical neurons with the strongest response to red-green stimuli in cortical areas V1 and V2.44 These concepts have implications on the nature of color deficits associated with optic nerve disease in which the photoreceptor response may be normal, but the interactions among the neural signals may be defective.

One of the major hurdles in understanding color vision is the obscure terminology that has evolved and persisted as physiologic concepts developed. For example, the three major types of congenital color defects were termed protan, deutan, and tritan, respectively, but these words mean only the “first, second, and third” defects and have nothing whatsoever to do with the pathology of the underlying color vision mechanisms. Color vision deficits (dyschromatopsias) are best understood in relation to the trichromacy of normal color vision. Dyschromatopsias are either congenital or acquired as a function of disease of the eye or visual pathways. Almost 10% of males and approximately 0.5% to 1.0% of females in the general population have congenital defects of color vision that impair their ability to make normal color discriminations. The least severe form is anomalous trichromacy, characterized technically by the ability match the color appearance of any colored field by adjusting three suitably chosen unique primary colors (similar to normal trichromats), but requiring significantly different relative radiances of the primary colors to do so. Such refined color sense is assessed on an anomaloscope, which permits variable combinations of two colored lights (usually red and green) that are adjusted subjectively to match a standardized yellow. Historically, anomalous trichromats are considered to have an abnormal photopigment in one of the three types of cone photoreceptors (L, M, or S). Consequently, anomalous trichromats typically are referred to as protanomalous, deuteranomalous, or tritanomalous depending on whether the abnormal photopigment is in L, M, or S wavelength photoreceptors, respectively. Depending on the extent of the anomaly in the photopigment absorption and the severity of the resulting color discrimination deficit, anomalous trichromats may be classified as having mild, moderate, or even severe deficiencies. Dichromats exhibit more pronounced color vision deficits than anomalous trichromats. Dichromasy is characterized by the ability to match the color appearace of any colored field by adjusting two, rather than three, primary colors. This feature suggests the failure, or perhaps absence, of one of the underlying photoreceptors types. Dichromats typically are referred to as protanomalous, deuteranomalous, or tritanomalous, depending on whether the defect is related to the response of L, M, or S wavelength photoreceptors, respectively. The smallest group of congenitally color-deficient individuals is the achromats. Achromacy is characterized by the ability to match the color appearance of any colored field by adjusting the radiance of any single primary color. Simplistically, these individuals may possess only a single cone photopigment or they may have no functioning cones at all. In the latter case, only rods are responsive and central vision also is reduced.

Acquired color vision deficits resulting from pathologic changes of the eye, retina, or visual pathways frequently are referred to as protan, deutan, or tritan defects. However, the use of this terminology, at least in part, has evolved from the application of tests originally designed to detect congenital color defects. It is important to recognize that, with the possible exception of diseases specifically affecting the cone photoreceptors, it is unlikely that similar mechanisms underlie acquired “protan, deutan, or tritan” defects. Other factors aid in differentiating congenital from acquired color vision defects. In particular, congenital anomalies are bilateral and symmetric, whereas acquired defects are rarely symmetric. Furthermore, congenital defects are nonprogressive, whereas acquired defects generally progress. Kollner45 originally proposed that acquired dyschromatopsia caused by optic nerve disease typically produces red-green deficits, whereas a loss of blue-yellow discrimination is more characteristic of retinal/macular disorders. There are numerous exceptions to this rule, and it should be considered no more than a casual guide. Indeed, some macular diseases may show red-green confusion deficits, whereas optic neuropathies have blue-yellow deficits early in their pathogenesis. In either instance, both red-green and blue-yellow deficits usually evolve as the disease progresses. Finally, in considering acquired color vision deficiencies, it is important to recognize that changes in the optical properties of the preretinal media (in particular, wavelength-specific changes in the absorption properties of the lens) can produce significant color discrimination defects. In addition, the normal aging process can contribute to a reduction in color discrimination that can confound the interpretation of color test results.

Back to Top
NEURO-OPHTHALMOLOGIC EVALUATION OF VISUAL FUNCTION
The neuro-ophthalmologic examination of the sensory visual system employs various strategies and examination techniques for the dual purpose of: (a) determining the probable cause or at least the topographic localization of the lesions causing a visual disturbance or symptom, and (b) documenting the character and extent of the visual disturbance. Frequently, these two objectives are so closely linked that they cannot truly be separated. By evaluating the character and extent of a visual deficit, the site of the lesion and the probable cause often can be deduced. A trivial example will suffice. If a patient's visual symptoms are found to be associated with a true bitemporal hemianopia, the disorder certainly is situated at the chiasm and the cause is most likely a tumor in or close to the sella turcica. The neuro-ophthalmologic examination of patients with occult visual problems or with otherwise unexplaind visual disturbances must use this goal-directed approach.

Frequently, the neuro-ophthalmologic approach involves considerable “detective work,” namely, collecting evidence and assembling clues that can identify the origin and nature of the visual disturbance with increasing certainty. The more supporting evidence that can be accumulated, the stronger is the likelihood of a correct diagnosis. Information that does not fit must first be rechecked, reconfirmed, modified, or discarded. All genuine findings should be explained and, if possible, reconciled. Failure to account for observations that appear incompatible with a diagnosis can be perilous.

The principles, examination procedures, and techniques described here are not restricted to the patient with a suspected neuro-ophthalmologic disorder. They are useful in localizing and diagnosing any disturbance of vision, and particularly those involving occult processes, because the systematic approach used in neuro-ophthalmology frequently results in the accurate diagnosis of optical, retinal, and anterior segment disorders. However, the emphasis here is on the basic maneuvers and techniques essential in the elucidation of neuro-ophthalmologic problems. Consequently, measurements of foveal and optic nerve function, sensitivity to color and brightness, and the visual field examination are of major importance and receive special attention.

The technology available to assess visual function and evaluate the sensory visual system is increasing dramatically from year to year. In addition to traditional Snellen and more recent logMAR optotype acuity, foveal function also can be scrutinized using various types of contrast sensitivity testing, suprathreshold contrast matching tests, spatial frequency-filtered acuity tests, and a variety of electrophysiologic tests, including focal, multifocal, and pattern electroretinography (ERG) and visual evoked potentials (VEPs). Visual fields now can be evaluated by a selection of computerized tests, performed using several different instruments, as well as by the more traditional methods. However, as always, the diagnostic process begins with history taking. The characteristics of visual symptoms, their evolution, and their associated neurologic and systemic problems provide important, often unique, clues to localization and etiology of visual pathway lesions, and they are arguably more critical for the accurate and timely diagnosis of lesions involving the sensory visual pathway than for diseases involving other parts of the visual apparatus.

Symptoms

Blurring is the most common complaint of patients with vision problems; unfortunately, it is also the most nonspecific. Blurring or indistinctness of boundaries and lines is produced by degradation of the optical image on the retina in refractive disorders and by opacities of the ocular media. These optical causes of blur must be distinguished from similar symptoms of neurologic lesions. Associated symptoms such as color loss or dyschromatopsia (hue desaturation) or dimness of vision should be sought to make this distinction.

The word scotoma implies a circumscribed area of darkness or dimness in the visual field. However, some patients refer to a scotomatous area as blurred rather than dark. Localized blur or otherwise degraded vision in the center of the visual field may indicate either macular changes or optic nerve disease with predominant involvement of the papillomacular nerve fiber bundle. Pronounced central field depression is not indicative of refractive errors or ocular media opacities, which rather produce diffuse or nonlocalized blurring of vision.

The sensory visual system is organized operationally into a series of neural channels having specific functions (see the discussion of parallel pathways). There are even separate channels for contrast perception of coarse, as opposed to fine, detail and there may be dminished sensitivity for one stimulus category and not for others. For instance, specific loss of sensitivity for medium spatial frequency visual information is a common residual dysfunction following recovery from optic neuritis. When viewed with the affected eye, objects appear faded or washed out, even though the contours still appear sharp. The latter aspect correlates with relatively normal function of high-spatial frequency channels that are responsible for encoding fine detail (see the preceding discussion of contrast sensitivity).

The term ghost image is used to describe a form of monocular diplopia in which an image appears to be edged or outlined by a secondary, usually dimmer, image; or the ghosting may appear as a line faintly duplicated in a second superimposed image. This type of symptom almost always is a result of irregularities in the optical media of the eye, often attributable to cataracts and even to uncorrected astigmatism. Ghost images always are visible monocularly, although they may be present for each eye, and they almost always are eliminated by the use of a pinhole aperture. Ghost images must be distinguished from small-angle diplopia, in which the second image disappears on occlusion of either eye. In addition, for true binocular diplopia resulting from muscle imbalance or paresis, the two images have equal visual density or clarity if vision in the two eyes is good. However, it should be noted that the combination of diplopia and reduced contrast sensitivity in one eye may mimic the faded ghost image seen with monocular diplopia.

Curvilinear distortion of straight lines or patterns is called metamorphopsia, and indicates the presence of macular edema, submacular fluid, epimacular membrane, retinochoroidal folds, or other retinal distortion that results in alteration of photoreceptor orientation. Objects may seem too large (macropsia) or too small (micropsia) as a result of abnormal compression or separation of photoreceptor elements in the fovea. Metamorphopsia usually is monocular, or at least asymmetric, and it cannot be a result of retrobulbar optic neuropathy.

A sense of darkness or dimmed light often accompanies optic neuropathy, even when central vision is relatively preserved. It seems as if the visual pathway has separate channels encoding brightness information that may be altered selectively in optic nerve disease. A sense of darkness is more strongly associated with depression of the entire field, rather than with small central scotomas. In addition, persons with central scotomas note relatively better vision in dim lighting46 because the paracentral and peripheral rod photoreceptors operate better at low light levels (scotopic conditions).

A dynamic sensation of continuous dimming or darkening of vision can be attributed more readily to retinal disease and can occur when retinal or choroidal perfusion is insufficient to meet the retina's metabolic demands. In such cases, an interval in darkness promotes temporary improvement, and an abnormal photostress test (see the following) confirms the diagnosis. Dimness also may be the principal complaint with hemianopia, particularly when the lesion involves the chiasm or optic tract.

Acquired disorders of the afferent visual pathways commonly disrupt color perception. Patients may report a sense of reduced vividness of colors, or they may state that colors are washed out (desaturated) or dull when they are questioned. Although red seems disproportionately susceptible to this subjective alteration, patients usually agree that all colors are less vivid. Some patients characterize the altered shades of color as darker—red is shifted toward amber or brown, whereas others say colors appear faded or lighter—red is shifted toward pink, orange, or yellow. This subjective variability may result from the degree to which the associated brightness channels in the afferent visual system are involved Central dyschromatopsia can occur rarely with lesions of the inferior occipital cortex. These lesions may produce color vision defects that are quite distinctive and always bilateral (see Chapter 7). Patients complain that color sensation is absent and the world appears to be black and white. Inability to name colors, but with intact color discrimination, characterizes alexia without agraphia (see the following) because color discrimination is a function of the right hemisphere, but naming requires transfer of visual information to the left hemisphere, which is blocked in this condition.

Reading, like walking, is a refined skill that requires complex sensory, perceptual, and motor coordination. Scrutinizing how a patient reads can be as useful as observing a patient's gait; it can provide the physician with a wealth of information on visual system function. Reading requires coordinated participation of the sensory visual system and the ocular motor apparatus. Patients with simple hemianopias that split fixation (i.e., that pass through the fovea) may complain of difficulty reading, particularly with the loss of the right hemifield, because they cannot scan forward adequately on the printed page. Patients with left hemianopia may read a line of text fluently, but they have difficulty finding the left-hand margin and the beginning of the next line. Hemifield loss may be evident when testing acuity as the patient may fail to see letters toward the side of the chart corresponding to the side of the hemianopia (Fig. 2).

Fig. 2. A patient with hemianopia may ignore half of the reading chart. Such defects can be asymptomatic.

Reading difficulties resulting from hemianopic field loss occur when there is loss of the macular representation in the hemianopic field and usually are not present when the central portion of the hemianopic field is preserved, as occurs with macular sparing (see the following). Conversely, patients with partial hemianopias involving only the paracentral region adjacent to fixation (i.e., half the macula) often complain of difficulty reading, and they may read the eye chart in the selective manner previously described, leaving out letters on the side of their hemianopic field defect (see Fig. 2). Patients who read the chart selectively in this way provide a strong clue to the nature of their field defect. This behavior may be critical in suggesting the correct diagnosis in patients with normal peripheral fields and a small, occult, central hemianopic defect. This type of limited central homonymous hemianopia can occur when the lesion is confined to the occipital pole of the visual cortex, or it can occur in one or both eyes in cases of chiasmal dysfunction.

Migraine frequently affects reading because visual auras at or close to fixation, with shifting patches of mixed negative and bright positive scotomas, can obscure one or two letters at a time. This transient hemianopic scotoma must be distinguished from the common running together of print as occurs with insidious presbyopia, and that is relieved with appropriate refractive correction for near vision.

Alexia without agraphia (see Chapter 7) is an extreme and specific reading disorder in which the right occipital cortex is disconnected from the language mechanism in the left hemisphere because of a lesion involving the splenium of the corpus callosum, where an extensive bundle of commissural fibers links the right and left visual association cortices. A second lesion, most commonly involving the left calcarine cortex,produces a dense right homonymous hemianopia, so that visual information enters only the right occipital cortex from the left hemifield. The written word is perceived accurately as a complex form in the right occiput, but linguistic analysis of the words, which requires participation of the left hemisphere in most individuals, is blocked by the callosal lesion. Auditory and tactile input to the language mechanism is intact, so the patient is not aphasic and can write spontaneously or in response to spoken dictation. This was one of the first disconnection syndromes to be demonstrated adequately in clinical neurology.

TESTS OF MACULAR AND FOVEAL FUNCTION

Visual Acuity

Visual acuity must be recorded each time a patient is examined. Standard acuity measures can be extremely helpful in diagnosing lesions of the visual pathway. However, paradoxically they may be relatively insensitive to pathologic processes involving the optic nerves, chiasm, and retro-chiasmal pathways. When a lesion of the optic nerve or chiasm reduces acuity by more than a few lines, there is also diminished color sense, a relative afferent pupillary defect (RAPD), and a significant field defect. Ocular disease, on the other hand, including most occult processes involving the macula, can reduce acuity substantially without necessarily producing dramatic deficits in color perception, pupillary response, or visual field.

Snellen letter visual acuity testing is firmly entrenched in clinical ophthalmology. It is measured using printed “eye charts” or facsimiles of these charts on projection slides, computer-generated displays, and light boxes. The individual characters (letters or numbers) on the acuity chart are called optotypes. Standards for the printing of charts and projection slides dictate that letters be high in contrast (usually >85% to 90%). Block characters (sans serif or Gothic fonts) and overall letter width and height should be nearly equal. By definition, the 20/20 letter subtends 5 minutes of visual angle at the retina, and each component stroke of the letter is 1 minute wide. Thus, 20/20 vision could be interpreted as the ability to resolve images with details subtending as little as 1 minute of arc. However, as discussed in the following, this is a gross oversimplification. The usual fractional notation (20/20), although easily recognized, is not a particularly useful designation because it is awkward to manipulate arithmetically and statistically (see Visual Acuity in the preceding section on Anatomy and Physiology). The numerator refers to the distance from which the patient reads the letters, and the denominator is the distance at which a “normal” eye could identify the same letters. As an observer moves from a viewing distance of 40 to one of 20 feet, the retinal image becomes twice as large. In a sense then, acuity of 20/40 is half as good as 20/20. Similarly, 20/80 can be considered half as good again as 20/40, but what is not clear is whether a pathologic process producing 20/80 vision is twice as severe as that which results in 20/40 vision. As discussed in the preceding, measured acuity depends greatly on the conditions under which the subject is tested, the criteria applied to subject performance on reading an eye chart, and the construction of the chart itself.

Because acuity can vary with environment and exposure to light, it should be measured under controlled conditions. Abnormalities of the ocular media and macular disease may adversely affect visual acuity depending on current and recent exposure to light, if such exposure can result in glare or prolonged recovery after bleaching of retinal photoreceptors (as occurs in macular edema, serous detachment, and photoreceptor degenerations). Thus, patients with vague visual complaints that may result from glare or dazzle may have normal auity in a dim room or after resting their eyes. When the symptoms occur under certain specific environmental conditions, the astute clinician is advised to test acuity and visual function under lighting conditions mimicking those prevailing during the offending situations. In this way, the circumstances that induce or aggravate visual disturbances can be used advantageously to help localize the cause of the visual disturbance (e.g., see Photostress Test, later).

When testing acuity or other aspects of visual sensory function, there is a tendency to be limited by the equipment at hand. This is an artificial constraint. A patient who cannot read the Snellen or equivalent distance chart needs to be evaluated further, and quantitative measures of acuity should still be sought. Some patients may be able to identify the large numbers or symbols on a reading card, especially at close range. Patients with central scotomas can often identify single letters presented within their paracentral field. Tests designed to evaluate acuity in children such as the Sheridan-Gardner, HOTV tests or a simple E card can be very useful. The most sensitive portion of the visual field can be identified at close range, and then the distance from the smallest symbol that can be reliably identified should be recorded. Thus, a patient who can see a 20/100 E card at 5 ft, fixing eccentrically with the superior nasal quadrant, should have acuity recorded as follows: “5/100 S(upra)N(asal) with single E card.” When presenting this type of stimulus at close range, appropriate near correction must be used with patients older than 40 years, and it may even be helpful in younger patients. These cards also are useful with the occasional patient who has a central disorder (e.g., dyslexia, aphasia, or agnosia) that limits the ability to name characters, although these characters can be seen and recognized. Anyone who can count fingers should be able to identify large single letters, but those patients who cannot should have acuity recorded as “counts fingers,” “hand movements,” or “perceives light” in a particular quadrant at a specified distance. Some patients who cannot see well enough to count fingers can see movement of just the fingers, so that “finger movement” can be used as an intermediate grade between count fingers and hand movements. When testing perception of movement or light, care must be taken to interrupt the stimulation and ask that the patient identify when, and not just if, he or she detects the stimulus. With hand movements, one can also inquire about the direction of movement. Many of these methods are also useful when testing acuity at the bedside and whenever a patient cannot be brought to an examining room. Specific techniques available for testing visual acuity in infants and children are addressed in Chapter 13.

Additional clues as to the nature of a visual disturbance can be derived from the actual process of obtaining a patient's acuity. Most practitioners recognize that the failure to see characters on the right or left side of an acuity chart should arouse suspicion of a hemianopia. However, patients frequently state that certain portions of a line of characters appear blurred, absent, distorted, doubled, or deviated. This information can be useful in determining the site of the disturbance. Diseases of the optic nerves, chiasm, and tracts, as well the posterior visual pathway, do not produce monocular metamorphopsia, whether it is described as distortion, doubling, or deviation of images. On the other hand, central lesions occasionally generate distorted images and visual illusions that mimic true metamorphopsia, but they are seen with either eye. Thus, unilateral metamorphopsia certainly is ocular in origin. Of course, ocular diseases include disturbances of the optic disc, such as papilledema, which can distort the retina and can cause metamorphopsia.

Depnding on a patient's symptoms, it may be advisable to determine best corrected visual acuity at distance and near, and both monocularly and binocularly, because some symptoms may appear only under selected circumstances. Any unexplained discrepancy in visual function should arouse concern. For example, a patient with latent nystagmus may have substantially better acuity when using both eyes as compared to the monocular acuity of each eye when the other is covered. Moreover, there may be significant inconsistencies in the findings when the visual problem is factitious or “functional,” thus providing a clue to its origin (see the following).

Contrast Sensitivity

The measurement of contrast sensitivity in a clinical setting has been simplified by the appearance of a variety of new charts and electronic devices. The scientific method for determining contrast sensitivity is to measure sensitivity thresholds at a series of different spatial frequencies using sine wave gratings (see Fig. 1B) displayed on a video monitor. The gratings are displayed while the contrast is varied, and the patient signals when the pattern is first detected. The mean and standard deviation of this threshold are calculated for various spatial frequencies, typically ranging from 0.5 to 23 cpd, and the graphic representation of these data determines the contrast sensitivity function or curve. In humans, there is a contrast sensitivity peak around 4 cpd (see Fig. 3). Although commercially designed equipment that simplifies this process is now available, determining contrast sensitivity functions is time consuming and impractical in most clinical settings. However, research studies39 using this method have led to the detection of four basic patterns of selective loss in pathologic states: (a) high-frequency loss, (b) broad or generalized loss at all frequencies, (c) mid-frequency (notch) defects, and (d) low mid-frequency loss. Thus, in practice, only two measurements are needed in order to detect all patterns of loss: (a) visual acuity, which is a measure of high-frequency contrast; and (b) an intermediate spatial frequency contrast threshold. Concentrating on developing a simplified test of contrast sensitivity in the intermediate-frequency range, Regan and Neima40 and Pelli et al39,47 developed charts using familiar optotypes, varying in contrast (black to light gray letters on a white background).

The Pelli-Robson chart was designed using optotypes of fixed size, but varying contrast (gray to black) to test for mid-range spatial-frequency loss.47 This technique reliably discriminates normal from abnormal peak contrast sensitivity.39 Regan and Neima40 also developed a set of low-contrast optotype acuity charts aimed at testing discrimination that depends on mid-range spatial frequencies. The charts are at least equal to sine wave grating tests in detecting spatial frequency loss in the mid-range of the contrast sensitivity function in patients with diabetes, glaucoma, ocular hypertension, and Parkinson's disease. Both tests offer the clinician a familiar, practical method of measuring contrast sensitivity at mid-spatial frequencies.

In contrast, the Vistech wall chart48 differs from the Pelli-Robson and Regan charts because it uses sine wave gratings presented at different orientations and contrasts. In place of individual letters, each grating is displayed as a small, circular spot on the chart, which consists of five rows, each with nine spots. The spatial frequency of the gratings in a particular row is constant, but it increases toward the bottom. The contrast of the individual grating decreases from left to right along each row. Subjects are asked to identify the orientation of the individual gratings. Rubin49 compared the Pelli-Robson, Regan, and Vistech charts and reported that the Pelli-Robson charts were the most sensitive in detecting loss of peak contrast sensitivity (at midrange spatial frequencies) and gave the most reproducible results. He found that measurement of peak contrast sensitivity alone was extremely effective in detecting pathologic states and concluded that, in clinical testing, it is not necessary to measure sensitivity to individual spatial frequencies using different sine wave gratings. The Optic Neuritis Treatment Trial found that Pelli-Robson contrast sensitivity testing is the most sensitive indicator of visual dysfunction in the setting of normal visual acuity,50 but this study did not compare Pelli-Robson with other tests of contrast sensitivity (see Chapter 5).

Color Vision

The subjective appreciation of color saturation or brightness is one of the most useful clinical components of the sensory neuro-ophthalmologic examination. As indicated, color sensitivity is typically reduced dramatically in inflammatory, infiltrative, and compressive optic and chiasmal neuropathies, even when acuity is relatively well preserved. Color sensitivity is depressed in ischemic optic neuropathy if both superior and inferior portions of the central field are involved. The effect of optic neuropathies on color is in marked contrast to the relatively well preserved color sensitivity in most acquired macular and ocular disease, in which acuity usually is more disturbed than is color vision.

Color vision can be evaluated clinical using a variety of simple or complex tests. Booklets of color plates such as the Hardy-Rand-Rittler (HRR) series (reissued in a new edition) or various versions of Ishihara's pseudoisochromatic plates, as well as a number of imitators, are simple to use and readily available. Because the neuro-ophthalmic color evaluation is concerned primarily with topical diagnosis and semiqualitative assessment of color sense rather than the determination of congenital color vision deficiencies, standardized lighting and viewing distances are less strictly enforced. The number of characters identified correctly is recorded (“16 of 25 digits”), so that credit is given when either one or two characters on a plate are recognized. It is important to note the ease and rapidity with which patients identify characters. Some patients may identify characters only after tracing them. (The patient preferably should point or use an artist's soft paintbrush because actually touching the color plates eventually produces damage.)

Patients may be asked to simply describe the color of different objects (e.g., bottle caps or colored sheets of paper) and the degree of color saturation of the objects should be noted. If one eye has normal or substantially better vision, comparison of gross color saturation between the two eyes and between paired quadrants of the visual field can be assessed (see Visual Fields and Perimetry). During such comparison testing, care must be taken to keep constant the size of the colored stimulus, the distance from the eyes, eccentricity in the visual field, and incident illumination. Overhead fluorescent lighting usually is sufficient. The patient must understand, however, that the task is to compare the relative intensity, color saturation, or brightness (e.g., “redness” of an object) when the stimulus is presented alternately to each eye, or at two positions in the visual field, usually to either side of the vertical meridian (Fig. 15). Inconsistent responses can occur, for example, when the subjective sensation of a darker, less saturated red, as seen with an impaired eye, is identified as “redder” than the brightly saurated hue of the stimulus seen with the normal, or less impaired, eye.

Exposure to bright light (pupil light reactions or ophthalmoscopy) or any significant asymmetry in the ocular media (e.g., the presence of unilateral pseudophakia, aphakia, cataract, or other opacity) may falsely diminish the subjective perception of hue and saturation of colors. In these situations, objective tests, such as the pupillary responses, are more reliable indicators of anterior pathway dysfunction.

Special mention must be made of patients who have congenital color deficiencies. Red-green color confusion affects approximately 10% of the male population, and many mildly and moderately affected patients unaware of their deficiency score poorly on the Ishihara series of plates. Therefore, patients should be asked about difficulty discriminating colors or whether color sense was tested previously (e.g., in the military service). If color vision in both eyes is symmetrically depressed, and there is no other reason to account for dyschromatopsia, a congenital deficit should be suspected. The HRR plates are very useful in these cases, because six of the 20 plates are designed to test non-red-green types of congenital color deficiency. Some symbols on these six plates are missed by patients with acquired anterior visual pathway disease affecting central vision, but they are easily identified by patients who have congenital red-green dyschromatopsia, whose vision is otherwise normal, and who have much greater difficulty with some of the more brightly saturated characters on the remaining 14 plates.

Formal testing of color vision with more complex tests usually is not required to diagnose neuro-ophthalmologic visual impairment. The Farnsworth D-15, Lanthony desaturated D-15, and Farnsworth-Munsell 100-hue (F-M 100) tests are primarily used to categorize (type) and determine severity of color deficits in patients with congenital dyschromatopsias. However, these tests can be useful in detecting subtle, central color defects in patients with optic neuropathies.51 The F-M 100, which actually consists of only 85 color caps that must be arranged in sequence according by color matching, is the most thorough test of color vision, but its clinical use is limited because it is lengthy and tedious. Nichols and co-workers52 found that testing with a subset of F-M 100, consisting of chips 22 to 42, had nearly the same sensitivity and specificity for detecting optic neuropathies as the standard F-M 100. These workers found that most of the clinical value of the standard test can be achieved in one-fourth of the time required for the standard F-M 100 test protocol.

PUPILLARY LIGHT RESPONSE

The pupillary light response is an objective indicator of anterior visual pathway function, in general, but it is a particularly practical and sensitive measure of optic nerve dysfunction. The speed and amplitude of the pupillary light reaction generally depend on the overall intensity and speed with which the afferent neural signal is transmitted to the brainstem. Diseases of the retina, optic nerve, chiasm, and tract produce definite decreases in pupillary reactivity that last as long as the lesion persists. Moderate media opacities, such as cataract, do not have this effect (see Chapter 15).

In practice, a pupillary reaction diminished by a lesion of the anterior visual pathway is most easily uncovered using the swinging flashlight test, probably the single most useful diagnostic test in neuro-ophthalmology. In a darkened room, each eye is alternately stimulated with a bright light stimulus, which is moved rhythmically from one eye to the other. The pupillary reactions elicited during stimulation of one eye are compared with the reactions produced during identical stimulation of the other eye. A pathologic process of the anterior pathway disrupting unction disproportionately on one side produces an RAPD, also known as a “Marcus Gunn” pupil. The characteristic observation is “release” or dilation of both pupils when the light is moved from the better to the affected eye.

Several principles apply regarding the swinging flashlight test:

  1. To avoid pupillary constriction associated with accommodation (the near response), the subject should fix on a distant target.
  2. Each eye must be stimulated identically in an alternating fashion, such that the brightness, incident angle, and duration of stimulation are the same for both eyes.
  3. The alternating swing interval from one eye to the other should be equally rapid in both directions.
  4. The direct reaction of each pupil to the stimulus can only be identical if the efferent motor pathway is intact and the irides are mechanically and structurally identical.
  5. If there is marked anisocoria or other pathologic changes of the globe that could influence the pupil's reaction, the direct and consensual reactions of only one pupil (usually the one with the better reaction or more preserved structure) should be observed while performing the swinging flashlight test.
  6. When in doubt, the test should be repeated using two alternation rates, “slow” and “fast,” approximately 1 second per eye for the fast rate and a 3-second stimulus for the slow rate.
  7. If an asymmetry in the response is noted, a grading system may be used to describe it (see Chapter 15 for detailed descriptions of qualitative and quantitative RAPD grading). For example, grades can be described as one plus (1+), two plus (2+), and so forth, with four plus (4+) corresponding to an amaurotic or nonreactive pupil in a blind eye. According to this scheme, a 3+ RAPD indicates that the pupils dilate readily or “release” when the affected eye is stimulated, and 2+ when the pupils fail to constrict or dilate slightly when the light swings to the weaker eye. A 1+ RAPD is a minimally detectable asymmetry. This grading system is subjective, and its reliability depends on consistency of the technique applied. Every clinician should establish a clear sense of what each grade represents.

Neutral density filters may be used to quantify the asymmetry in the afferent input from each eye. A set of progressive neutral density filters (usually incorporated into a bar holder) is used over the normal eye while performing the swinging flashlight test. The density of the filter that just balances (neutralizes) the defect in the abnormal eye is determined and the RAPD is then specified as the density in log units of this filter (see Chapter 15).

If the patient has strabismus, care must be taken to direct the light stimulus in the identical position with respect to the visual axis of each eye. The key factor that cannot be overemphasized is to provide the exact same stimulus to each eye. Under rigidly identical stimulating conditions, any asymmetry in the pupillary reaction to light is significant and usually implies a pregeniculate lesion. Rarely, afferent pupillary defects can be attributed to mid-brain lesions, but in these cases, visual function usually is preserved on all other tests. With relatively symmetric bilateral neural visual loss, both eyes may show sluggish pupillary light reactions, without a RAPD.

PHOTOSTRESS TEST

A variety of choroidal and retinal diseases, particularly those affecting the macula, can cause subjective visual disturbances. At times, funduscopy and fluorescein angiography can fail to reveal structural changes in the tissues and vessels sufficient to account for these symptoms. In these situations, the disturbance often is attributed erroneously to an occult optic neuropathy. The photostress test is one of themost useful techniques available to help distinguish a maculopathy from optic nerve dysfunction.

The photostress test records visual recovery after retinal bleach; as such it is a measure of photopigment regeneration. This, in turn, depends on the metabolic activity and general health of the retina, retinal pigment epithelium, and choroid. Recovery of vision after exposure to a bright light stimulus generally is not prolonged when visual dysfunction results from diseases affecting the optic nerve. Consequently, prolonged recovery after photostress effectively localizes the dysfunction to the macula.

The photostress test is a rapid and uncomplicated maneuver.53 A modified photostress test may be conducted as follows (Fig. 4):

Fig. 4. Photostress test. A. The retina is bleached with bright light as the patient occludes the other eye. B. The recovery phase is timed. C. The second eye is exposed to light. D. Photo-stress recovery times in macular and optic nerve disease. The dotted line represents 50 seconds, the upper limit of normal for 99% of control eyes. CSR, central serous retinopathy, RPE, retinal pigment epithelium; SMD, senile macular degeneration. (From Glaser JS, Savino PJ, Sumers KD: The photostress recovery test: A practical adjunct in the clinical assessment of visual function. Am J Ophthalmol 83:255, 1977)

  1. Best corrected visual acuity is recorded in each eye.
  2. With the defective eye covered, the normal or “better” eye is subjected to a strong light directed into the pupil for a specific time (e.g., 10 to 15 seconds).
  3. The light is removed, and the patient is instructed to begin reading the chart as soon as any letters can be identified. The end point is the interval until the “next largest” line (just above the one for best acuity) is read. This recovery period is timed and recorded.
  4. Now the defective or “worse” eye is exposed to the same bright light directed into the pupil for the same length of time.
  5. The light is removed, and the recovery period (i.e., the interval until the patient can again begin to read the “next largest” line) is recorded.
  6. The recovery period of the two eyes is compared. Normal recovery depends on age, but in a young, healthy eye it is usually 15 to 30 seconds. In older individuals, normal recovery can take 30 to 50 seconds. Markedly asymmetric recovery periods for each eye or periods longer than 60 seconds are definitely abnormal. For example, if decreased acuity is caused by retinal edema, central serous choroidopathy (retinopathy), or similar macular lesions, recovery time in the abnormal eye will be prolonged to 90 to 150 seconds (see Fig. 4D). In contrast, if the deficit of central vision results from retrobulbar neuritis or compression of the optic nerve, visual recovery following light stress to the eye with decreased vision occurs over approximately the same period as recovery in the normal eye.

There are ample experimental and clinical data to support the concept of prolonged recovery time following light stimulation of the retina in the presence of defects in the choriocapillaris, retinal pigment epithelium, and outer retinal layers.53,54 For example, in the case of a small serous detachment of retinal pigment epithelium or retina, a positive scotoma is iduced after exposure of the fundus to bright light. The afterimage is prolonged until visual pigments are regenerated. Similarly, a primary maculopathy or inadequate macular perfusion can markedly prolong the recovery of a bleached retina producing symptoms of glare, visual washout or whiteout, or a perception of continual dimming of the environment.54 With mild macular dysfunction, symptoms only may be present during or after exposure to bright surroundings. More advanced maculopathies may produce symptoms at normal indoor light levels, but in a dark or dim room, affected patients can be virtually asymptomatic and they may continue to score well on standard eye tests performed under these idealized conditions. Photostress also can be used to elicit or enhance a central scotoma during visual field examination or when the patient is tested using the Amsler grid.

STEREOPSIS AND BINOCULAR FUSION

Binocular depth perception and fusion are not tested routinely in adults, but their determination can be useful in certain situations. Patients with mild to moderate reduction in visual acuity that cannot be explained and those complaining of intermittent diplopia, but with eyes that appear to be aligned, should be evaluated using standard clinical tests of binocular fusion, such as the Worth 4-dot test and the 4-diopter base-out prism test. Binocular depth perception and stereoacuity can be estimated with simple stereographic tests, such as the Titmus Fly and Randot tests. These tests may help to uncover mild occult amblyopia, microtropias, or intermittent decompensated strabismus. Such testing can also be extremely helpful in situations of feigned or hysterical visual loss, when the patient's subjective near and distant monocular acuity as determined using standard acuity charts is seemingly grossly abnormal, but measured stereoacuity or depth perception is intact.55 Descriptions of these and other tests of binocular function are beyond the scope of this chapter.

OTHER TESTS OF VISUAL FUNCTION

Acuity at Reduced Illumination

A practical technique to determine whether reduced acuity results from long-standing functional amblyopia or an organic lesion (macular or optic nerve disease) is to use a neutral density filter.56 If a 2-log (20 dB) filter (Kodak No. 96, ND 2.00) is placed before a normal eye, vision is reduced approximately two lines (e.g., from 20/20 to 20/40). With an optic nerve conduction defect such as retrobulbar neuritis, vision is usually drastically reduced when a neutral density filter is used, for example, from 20/60 to 20/200 or 20/400. The effect of such reduced contrast testing on functional amblyopia is of great interest because vision in such eyes decreases minimally or not at all. Thus, the use of neutral density filters can distinguish between functional amblyopia and an acquired retrobulbar lesion. However, if amblyopia is severe, this test is difficult to interpret.

Motion Sensitivity

Motion perception refers to the visual inference that objects have changed relative position. It is a fundamental visual attribute involved in many aspects of visually guided behavior. Motion perception provides information about movements in space, the motion of objects relative to one's position in space, the three-dimensional structure of objects, and depth perception. Impaired motion perception can adversely affect activities as simple as pouring a glass of water and as complex as flying an airplane. Although motion perception is an important visual capacity with obvious survival value, there has been limited consideration of the clinical utility of assessing motion perception. Most studies on motion blindness in humans hve dealt with individual case reports of specific patients who developed reduced motion sensitivity following cortical lesions. However, more recent studies have shown that motion sensitivity deficits are not limited to brain injury but also occur with retinal damage that limits neural input to higher-order motion detection centers. Impaired motion sensitivity has been reported in patients with retinitis pigmentosa,57 diabetic retinopathy, and glaucoma.58 Furthermore, there is evidence that the motion perception deficits of patients with Alzheimer-type dementia59 and Parkinson's disease60 are at least partially attributable to retinal dysfunction. Comparison of the perceptual and ocular motor response to motion also demonstrates dissociation between motion sensitivity deficits and ocular motor abnormalities in patients with senile Alzheimer's dementia.61

Back to Top
VISUAL FIELDS AND PERIMETRY
Traquair's classical definition of the visual field is “that portion of space in which objects are visible at the same moment during steady fixation of the gaze in one direction.”62 Perimetry measures the visual field and involves recording visual function of the eye at topographically defined loci in space. Understanding the visual field as it relates to neuro-ophthalmologic diagnosis is a complex subject requiring knowledge of: (a) the anatomy of the optic pathways and contiguous, related structures; (b) the intrinsic organization of retinal projection through the pathways and in the cortex; and (c) the nature of various lesions and the mechanisms by which they produce field defects. The specific localizing characteristics of field defects are discussed subsequently in the chapters dealing with topical diagnosis in the visual sensory system.

The visual field is too often considered a description of peripheral visual space, representing extrafoveal visual function, exclusive of central vision, which is described by acuity. However, according to Traquair's definition, the visual field is more appropriately thought of as a three-dimensional “island of vision surrounded by a sea of blindness” crowned by a sharp pinnacle of central vision (Fig. 5). Certainly in the context of neurologic dysfunction, the central 
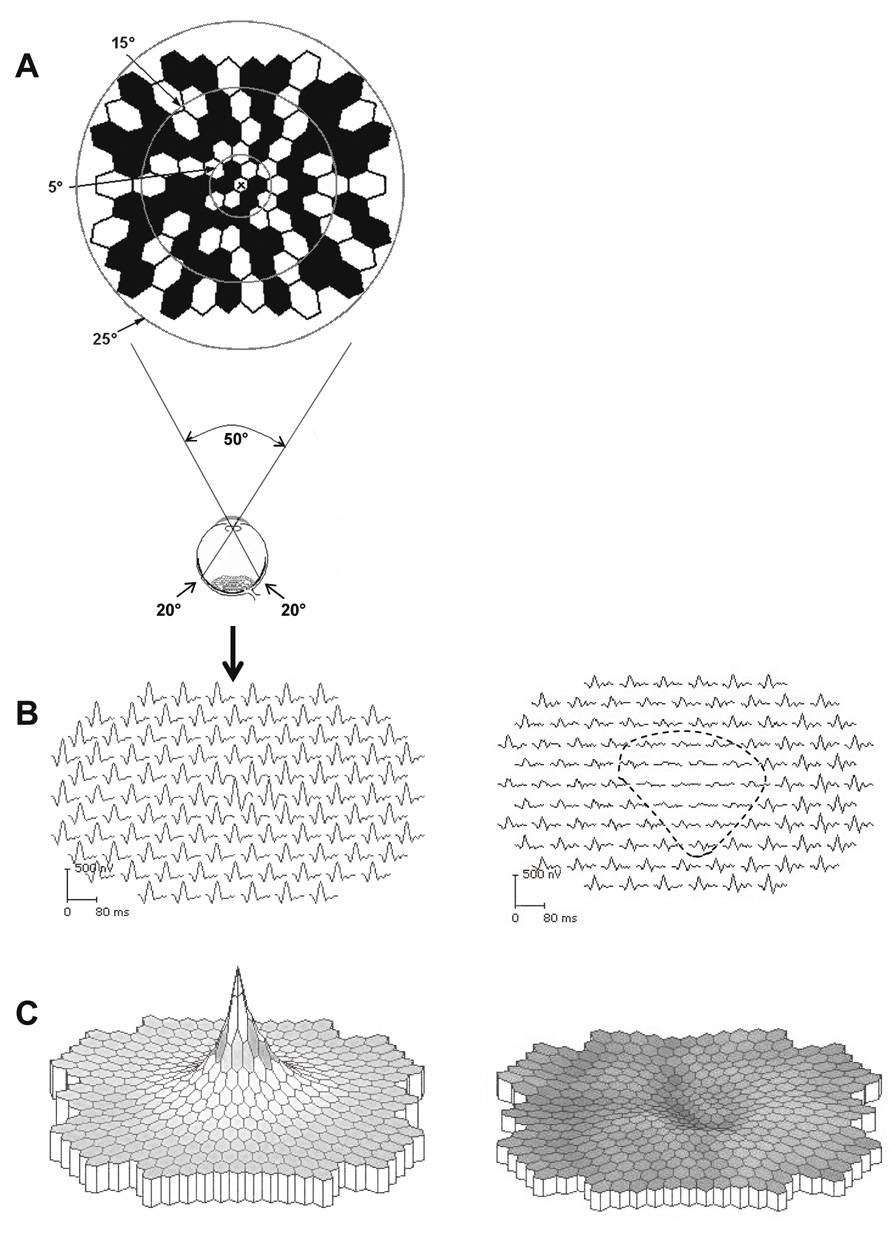
portion of the visual field is at least as important as the periphery.

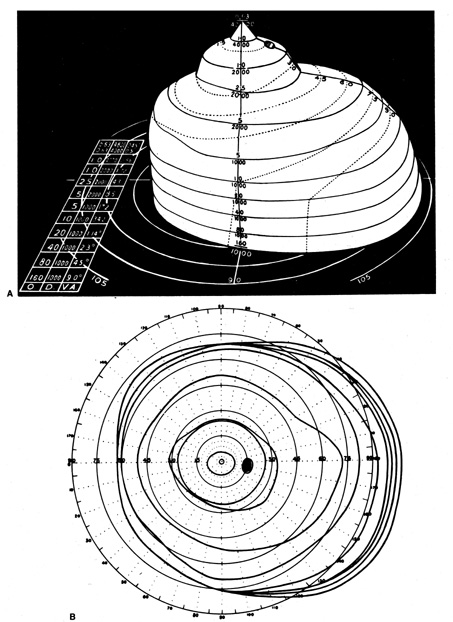
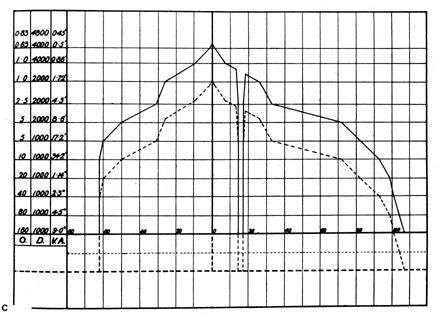
Fig. 5. A. Three dimensional model of Traquair's “Island of Vision.” The visual field of the right eye is shown. B. Standard flat plot of isopters, as if viewed from above. C. Vertical cross-section along horizontal meridian. O, target size in mm; D, distance from eye in mm; VA, visual angle. (From Scott GI: Traquair's Clinical Perimetry. London: Henry Kimpton, 1957)

There are many techniques and a variety of equipment available for evaluating visual fields. However, in essence all methods depend on the patient's subjective response to a visual stimulus. The threshold of perception (i.e., the threshold sensitivity) for a specific visual stimuus is determined either qualitatively or quantitatively by varying the size, brightness, color, position, or some other physical attribute of the stimulus until that stimulus is just perceived. When recording Goldmann-type kinetic perimetry, a line is drawn connecting points of equal threshold sensitivity, thereby defining the isopter for that specific stimulus. This method is roughly analogous to the isobar lines on weather maps that define areas of equal atmospheric pressure. Complex manual and computerized perimeters have been developed to determine threshold sensitivity to a variety of stimuli and represent these data graphically, either by plotting the position and shape of isopters or creating grayscale maps of threshold sensitivity. However, before dealing with these devices some basic principles of visual field measurement and the relatively simple, yet sensitive, confrontation techniques that are easily available to any clinician, at any time, and in all clinical settings are considered.

ANATOMIC CONSIDERATIONS

In general, field defects resulting from lesions of the retina, optic nerve, chiasm, and visual pathways conform to a limited set of patterns. The variations in these patterns are elaborated elsewhere in discussions of topical diagnosis (see Chapters 5, 6, and 7), but several anatomic concepts necessary for understanding the basic principles of perimetry are considered here.

Pathologic processes involving the retina may produce general or geographically focal field defects or areas of diminished sensitivity (i.e., scotomas); these deficits frequently correspond to lesions visible on funduscopy. Macular lesions produce central scotomas at fixation, sparing the periphery, whereas widespread tapetoretinal degenerations result in generalized field constriction, often sparing central fixation (see Chapter 5).

Lesions of the optic nerve head or immediate peripapillary region, as well as some vascular diseases, tend to produce retinal nerve fiber bundle defects, which are segmental defects extending radially outward from the blind spot. The configuration of these defects depends on the involved portion of the optic disc. Temporal, wedge-shaped scotomas result when the lesion is at the nasal aspect of the disc. Damage to axonal bundles at the superior or inferior poles of the optic disc produces arcuate defects that curve toward the nasal periphery. These superior or inferior arcuate scotomas point to, or originate at, the blind spot and can extend no further than the horizontal nasal meridian, which represents the anatomic temporal raphe of nerve fiber bundles that stretches from the fovea to the temporal retinal periphery. These defects frequently spare central vision, leaving acuity intact. Lesions at the temporal aspect of the optic disc result in centrocecal scotomas that encompass the blind spot and the central (macular) region, resulting in decreased visual acuity. Large lesions on or near the optic disc may result in areas of visual field loss that combine two or more of these segmental patterns.

Typically, and rather consistently, retrobulbar disorders of the optic nerves (e.g., optic neuritis, toxic neuropathies) especially depress function of the central core of the nerve. This central core is occupied predominantly by small caliber myelinated fibers subserving the cone system of the fovea and macular area of the retina (the papillomacular nerve fiber bundle). Defects in this system cause diminished visual acuity, depression of central field, and alterations in color vision. A central scotoma occurring in the absence of macular disease is the classic, but not exclusive, of a lesion involving the optic nerve (see Chapter 5).

At the chiasm, all afferent nerve fibers from both eyes are segregated into crossed and uncrossed systems (Fig. 6). It is at the chiasm that the visual system becomes fnctionally divided by a vertical demarcation through the fixation point, the retinal–cortical projections representing the left hemifields of both eyes blending and coursing toward the right cerebral hemisphere and the projections representing the right homonymous halves of the field joining and coursing to the left. In the optic nerve (i.e., anterior to the chiasm), there is no functional vertical demarcation of right and left hemifields. At the chiasm and in the pathways posterior to it there is an inviolate lateralizing separation of homonymous hemifields. Thus, it is that the vertical meridian dividing the hemifields assumes critical importance in the elucidation and exploration of field defects resulting from lesions of the chiasm, optic radiations, and occipital cortex.

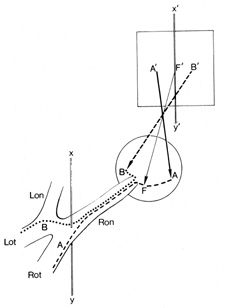
Fig. 6. Visual field of the right eye divided into a temporal (B') and nasal (A') hemifield, by a vertical line (X', Y') through the point of fixation (F'). There is no anatomic or functional segregation of crossed (nasal retinal) fibers, B (···········), and uncrossed (temporal retinal) fibers, A (−−−−−−−), before the junction of the optic nerve with the chiasm at the vertical line (X,Y). Therefore, lesions anterior to the chiasm produce defects that extend across the vertical, whereas chiasmal and retrochiasmal lesions produce defects confined to one hemifield. Lon, left optic nerve; Lot, left optic tract; Ron, right optic nerve; Rot, right optic tract.

The optic tract forms a compact fascicle of fibers that passes to the LGN of the thalamus. Lesions of this tract or of the LGN are relatively infrequent, and when they occur, they typically produce fairly incongruent (unequally sized) homonymous hemianopic field defects, unless, of course, the hemianopia is complete and total. Lesions of the retrogeniculate pathways also can produce partial or complete homonymous hemianopias. Partial hemianopias tend to be more congruent when the lesions responsible are situated more posteriorly toward the occipital lobe. Lesions involving the temporal lobe are associated with somewhat incongruent defects in the superior portion of the contralateral hemifields, whereas disturbances of the pathway in the parietal lobe characteristically cause slightly incongruent homonymous defects in the inferior part of the hemifield. Lesions of the visual cortex in the occipital lobe have three localizing characteristics: (a) they are exquisitely congruent; (b) they can give rise to true homonymous quadrantanopias that respect both horizontal and vertical meridians because anatomically the genicular–cortical projections representing the upper and lower visual field quadrants become segregated to the lower and upper gyri of the calcarine cortex, respectively; and (c) macular sparing is frequently a characteristic feature when occipital homonymous hemianopia is otherwise complete, and this is a consequence of the differential blood supply to the anterior and posterior portions of the visual cortex.

PHYSIOLOGIC CONSIDERATIONS

The utility of Traquair's concept of an island or a hill of vision (see Fig. 5) has proved consistent throughout the 50-year period during which Goldmann-type kinetic perimetry dominated clinical testing. Remarkably, Traquair's analogy remains current as an excellent way of conceptualizing automated static perimetry that has now largely superseded formal kinetic perimetry in clinical and investigational protocols.

p>Traquair's three-dimensional representation (see Fig. 5A) sits on a base plane, represented as a circular grid identical to that for plotting Goldmann isopters. This plane represents the horizontal and vertical dimensions of visual space. The third dimension, rising upward from the base plane is differential light sensitivity (DLS), which is the degree to which the visual system, at each point, is capable of detecting a circular spot of light that is brighter than the background. The foveal pinnacle is the most sensitive point in the field where the dimmest target (least different from background) can be detected. Traquair's various slopes and rises are zones within the visual field where DLS varies from point to point. In a gently sloping region (e.g., the temporal side of fixation), sensitivity changes gradually along the horizontal meridian, whereas in a steeply sloped region (e.g., the nasal periphery), there is a precipitous drop of sensitivity across a short lateral distance.

Traquair likened the process of perimetry to a geographic survey of an elevated surface wherein the lines encircling the island at various levels indicate a certain elevation above sea level. In perimetry, the lines encompass zones within the field that have achieved a certain elevation of DLS above the base plane, that is, above sea level. These isopters lines refer to points or zones of equal visual sensitivity. In kinetic perimetry of the Goldmann type, isopters are determined by moving projected light points across the inner surface of a bowl-shaped hemisphere; the light stimulus is moved from a nonseeing to a seeing region, at various locations around the island, and the patient signals when the moving light is first detected. This corresponds to mapping the isopter by choosing a DLS level and moving horizontally at this fixed DLS altitude above the base plane toward the island, noting where contact would occur with the rising slope of land.

Figure 5B shows the aerial view Traquair's hypothetical observer would have just above the foveal pinnacle, with the isopters now projected on the base plane. The series of concentric circles indicate discrete levels of DLS, each elevation (sensitivity) determined by a specific stimulus size and brightness. Although several stimulus levels are required to adequately map the surface of Traquair's island, generally no more than three isopters are plotted. A vertical slice (see Fig. 5C) through the island along the horizontal midline shows a steep nasal side (left) and the more gently sloping temporal field (right). On the temporal side of fixation is the physiologic blind spot, a dark shaft (bottomless pit) extending to the base plane.

One category of visual field loss, generalized depression, implies that all points on the DLS surface are displaced downward by an equal proportion; that is, sensitivity is depressed equally at all points. This is represented as a concentric contraction of all isopters, as Traquair's island sinks in the sea (see Fig. 5C, dotted profile). With depression of the entire field, a stimulus target would have to move further inward to be detected.

Traquair used the geologic term erosion to describe the consequences on the visual field of disease of the afferent pathways. For example, a dense inferior altitudinal field defect resulting from anterior ischemic optic neuropathy is illustrated in Figure 7 showing Traquair's island with a steeply excavated cliff face along the nasal horizontal midline, where the field undergoes transition to nearly zero DLS as a result of the nerve infarction. Small localized depressions (pits) on the surface could be missed if flanked by two isopters that are too widely spaced. For this reason, it is common practice in Goldmann perimetry to prsent blinking but static light targets positioned well within the peripheral isopters in order to search for small focal depressions or scotomas. Because the light target used to determine a particular isopter should be brighter than threshold for field zones within the isopter, any missed points can be considered as within a field defect. This technique of presenting target lights statically within their isopter is referred to as suprathreshold static perimetry. The concept of slope may be applied to the DLS contour of field defects in the same way as it is applied to the slope of normal field regions.

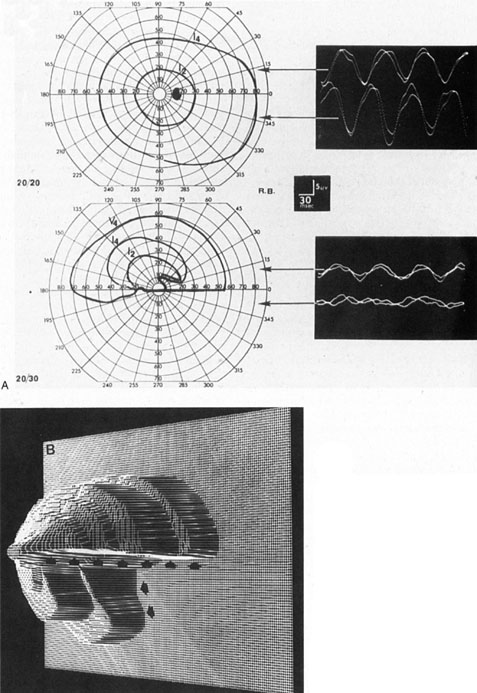
Fig. 7. Dense inferior altitudinal field defect resulting from anterior ischemic 
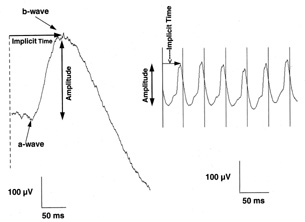
optic neuropathy of left eye. A. Goldmann visual fields and VEP tracings for right eye (top), which is normal, and left eye (middle), which shows almost complete loss of the lower hemifield. Steady-state VEPs are in response to 8 Hz pattern reversal stimulation of upper or lower half of the visual field and are normal and symmetrical in both half-fields of the right eye and are diminished, especially in the inferior field, of the left eye. B. Three-dimensional computer reconstruction field defect in the left eye; arrows define the sharp edge of the absolute defect. (Courtesy H. Stanley Thompson, MD.)

Imagine a temporal lobe infarction in which a central zone is necrotic and even the brightest stimulus is not perceived in the corresponding field; surrounding the necrotic zone are edematous, partially compressed visual fibers that are not functioning at peak efficiency but permit some visual function. This translates into a region of reduced DLS (a relative scotoma) surrounding the absolute visual field defect (an absolute scotoma). The area of nonseeing field in the upper right quadrant (Fig. 8A) is considerably enlarged with reduced stimulus intensity. This is a gently sloped area of field defect that is consistent with an acute lesion surrounded by a zone of relative dysfunction. When the pathologic changes have stabilized and the secondary edema has cleared, the absolute scotoma persists, corresponding to the necrotic zone (see Fig. 8B). The visual field defect mapped with the two weaker stimuli is now the same size as the absolute defect (i.e., the relative scotoma has cleared). This produces a steeply sloped defect along the horizontal meridian, which is characteristic of a stable established lesion.

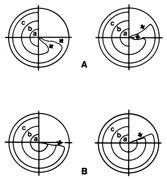
Fig. 8. Right homonymous upper quadrant visual field defect resulting from a left temporal lobe infarction. A. In the acute stage, the field defect is moderately incongruous (greater in left eye) and shows a relative slope along the horizontal edge (arrows). B. In the chronic stage, the defect is steep along the horizontal edge (single arrow).

CLINICAL TESTING OF THE VISUAL FIELD

Confrontation Methods

Innumerable and ingenious methods can be employed to screen patients for field defects. Screening generally involves rapid testing, which is usually done without special equipment, but at some sacrifice of sensitiity. Using confrontation screening, examiners compare patients' fields with their own while in a face-to-face position and without using the tangent screen or perimeter.

Confrontation screening of fields provides a rapid, practical, and readily available technique that can be used at the bedside or in the office, with either children or adults (Table 1). When used knowledgeably, it is both sensitive and accurate. However, it is critical to realize that confrontational methods are most useful in uncovering field defects such as central scotomas, altitudinal defects, and bitemporal and homonymous hemianopias, but generally they are not sensitive enough to reveal subtle defects resulting from glaucoma or minor peripheral retinal lesions. Fortunately, most neurologic field defects do not fall into that category and frequently can be detected using confrontational methods. It is also obvious that these techniques may uncover retinal detachments, choroidal tumors, and dense glaucomatous defects. However, this discussion is confined to lesions involving the optic nerves, chiasm, and posterior pathways.

TABLE 1. Confrontation field techniques


Visually elicited eye movementsInfants
Obtunded, dysphasic adults
Finger mimickingToddlers (3–5 yr)
Dysphasic adults
Finger countingYoung children (5–8 yr); Adults*
Hand comparisonChildren (8–12 yr); Adults*
Color comparisonChildren (8–12 yr); Adults
ThreatInfants; Obtunded adults

*Although highly subjective, comparison testing is very sensitive.


Determining the best corrected visual acuity usually is a prerequisite for proceeding with the visual field examination. However, in infants, toddlers, and bedridden, semiobtunded, and confused patients, the inability to determine acuity neither invalidates nor excuses the performance of confrontation fields. Table 1 indicates the approximate age at which reasonable cooperation for various types of confrontation testing may be expected.

VISUALLY ELICITED EYE MOVEMENTS

The foveation reflex, in which reflex eye movements are made to bring a stimulus presented in the peripheral field onto the central area (fovea) of the retina, develops at a very young age. The eye movement that accomplishes refixation is objective evidence that the stimulus was perceived in the periphery. Therefore, such involuntary visually provoked fixational movements provide a mechanism to test gross function of the peripheral retina (field) (Fig. 9). Clearly, this technique can be used to test infants, but it is also valuable with semiobtunded patients who may have homonymous or bitemporal hemianopic field defects.

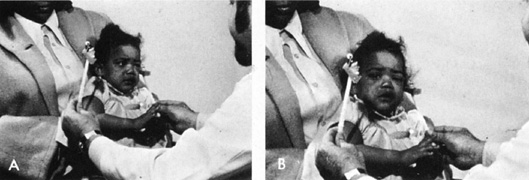
Fig. 9. Visually elicited eye movements provide gross estimate of field function and are demonstrated here in an 11-month-old infant. A. Infant watches the face of a cooing examiner while a brightly colored object is moved into her peripheral field. B. The head and eyes perform a fixation reflex, which is objective evidence of field function.

FINGER MIMICKING

Even before the “E game” can be learned, a young child can be shown how to mimic fingerpatterns by playing “Do this!” (Fig. 10) first with both eyes opened, then with each alternately occluded. This technique does not require the ability to either count or conceptualize spatial orientation and provides good approximations of field function. Because a young child has great difficulty in controlling ocular fixation, finger targets should be flashed (i.e., briefly exposed before the child looks toward the hand). In the temporal field, fixation can be further controlled by turning the child's face toward the opposite side, carrying the eye into abduction and rendering further movement toward the temporal field anatomically impossible. For the nasal field, this maneuver is more difficult because the nose and the object occluding the other eye may obscure the examiner's fingers. Finger patterns should be limited to the presentation of one, two, or five fingers, or the fist, because other combinations are difficult to distinguish.

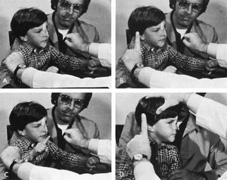
Fig. 10. Finger-mimicking fields in a 3-year-old boy. A press-on occluder may be used for monocular testing. A. Child and examiner face each other with both hands poised. B. With child fixating examiner's face, a number of fingers (1, 2, or 5) is “flashed.” C. The child responds. D. When fixation is a problem, the face may be turned such that the abducted eye can move no farther to the side.

FINGER COUNTING

Most children and adults are able to identify accurately the number of fingers presented in each quadrant of the monocular field. Visual acuity 10° from fixation is roughly 20/200; at 30°, it falls to 20/400. Therefore, because the fingers represent an approximation of the 20/200 “E” optotype, finger counting at an eccentric point between 10° and 20° from fixation should be accomplished easily at confrontation distances (approximately 0.5 m).

If a patient seems to have some difficulty counting fingers in a quadrant or hemifield, simultaneous testing (Fig. 11) may help confirm a field defect. Simultaneous presentation of visual stimuli also may elicit a response similar to other sensory extinction phenomena. When the defective hemifield is tested alone, it may appear quite intact, but simultaneous presentation of stimuli to both hemifields may suppress the perception on one side, revealing the deficit.

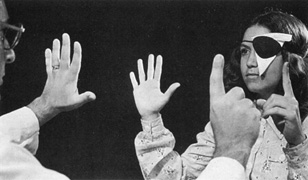
Fig. 11. Finger counting fields in adults. Four quadrants of each eye should be tested. The patient may name or hold up the same number of fingers. Simultaneous finger counting may bring out a subtle hemianopic defect.

HAND COMPARISON

The simultaneous presentation of targets to either side of the vertical meridian provides a sensitive subjective comparison of visual function in the two hemifields. In a similar way, the hands can be placed in the superior and inferior nasal quadrant to determine whether there is an altitudinal defect or nasal step, which usually respects the horizontal nasal meridian (see later).

In performing hand comparisons, the examiner's hands or matched targets should provide large, lightcolored paired stimuli about which the patient can be asked to make critical judgments in brightness perception (Fig. 12). The physician must determine that both hands or targets are illuminated equally, preferably by a light source directed toward the hands from behind the patient's head. Overhead lighting may be uniform, but positioning of the hands is critical because a slight tilting alters the reflected luminance. The following are typical questions asked during the comparison: “Do my hands appear the same?” “Is one hand lighter or darker than the other?” “Is one hand blurred or less distinct?” and “Does one hand appear in a shadow?”

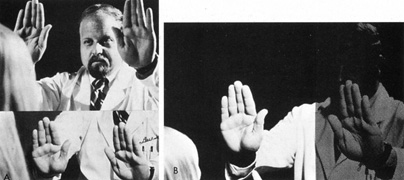
Fig. 12. The use of simultaneous hand comparison for detecting subtle hemianopic depressions. A. Hands are first compared above the horizontal (superior quadrants), then below. B. The hand in depressed hemifield appears “darker,” “in shadow,” or “blurred.”

It is obvious that for such confrontational screening methods to succeed, the physician must gain experience testing individuals with normal vision as well as patients with known field defects. As with practically all other forms of field testing, hand comparison is totally dependent on the patient's subjective response and the ability of the physician to interpret that response. However, a consistent and reproducible abnormal response by the patient must be construed as an indication of a field defect and is a definite indication for formal perimetry.

COLOR COMPARISON

Functionally, the optic nerves and chiasm may be considered macular structures (i.e., they predominantly subserve the central field) because more than 90% of the nerve fibers that comprise the anterior visual pathways arise from the small ganglion cells associated with cone receptors that populate the macula (Fig. 13). These fibers occupy the central core of the optic nerves and the median bar (decussating fibers) of the chiasm, which are especially vulnerable to compression by tumors or to intrinsic demyelinating or toxic processes. Therefore, depression of central field function, including loss of sensitivity to color, is a feature of both optic nerve and chiasmal disease. In fact, color desaturation may occur disproportionally with relative preservation of acuity and form perception.

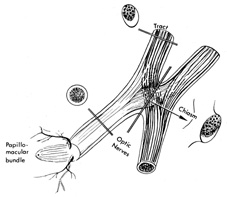
Fig. 13. Most nerve fibers in the optic nerves and chiasm subserve macular function and, therefore, the central visual field. Anatomically and functionally, the nerves and chiasm may be considered macular projection structures. Note that the section through median bar of chiasm demonstrates the distribution of macular crossing fibers (after Hoyt).

In optic nerve disease, central depression (scotoma) of the field can be easily detected by asking the patient to describe changes in the saturation of the color of a large test object moved away from or toward central fixation (Fig. 14). Alternatively, two similar targets may be used, one placed centrally and the other eccentrically, and the patient asked to describe dfferences in color intensity or saturation. Normally, color is brighter or more saturated the closer one comes to fixation.

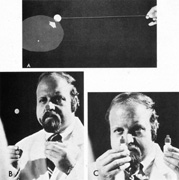
Fig. 14. Use of colored objects to detect and plot central scotomas. A. The limits of the defect are most easily defined when the target subjectively increases in color intensity as it is moved out of scotoma. B. Two identical, colored targets are used for simultaneous comparison, one centrally (on nose), the other at approximately 10�. Normally, the target fixated centrally appears brighter. C. Use of brightly colored bottle tops (mydriatic red) for color comparison.

In suspected chiasmal syndromes, color perception should be compared on either side of the central fixation point. Moving a single large stimulus from one side to the other, or simultaneously presenting two targets, one on either side of fixation, provides the patient with a large visual stimulus about which he or she may make subjective yet sensitive judgments concerning color saturation (Fig. 15). To substantiate an apparent temporal field defect further, the test target should demonstrably “brighten” or take on color as it passes across the vertical meridian into the nasal hemifield (Fig. 16). Similar color comparison can be used to detect altitudinal visual field defects, which typically are delimited by the horizontal nasal meridian. In those cases, the comparison is made between the upper and lower nasal quadrants. This is extremely useful because visual field defects that terminate at the horizontal nasal meridian must be caused by lesions at the optic nerve head or adjacent to it, that is, their origin is anterior. The most common causes are glaucoma, anterior ischemic optic neuropathy, branch artery occlusion, and optic neuritis. Chiasmal compressive lesions cannot produce this pattern, and so imaging studies can be avoided or at least, when indicated, limited to the orbital contents.

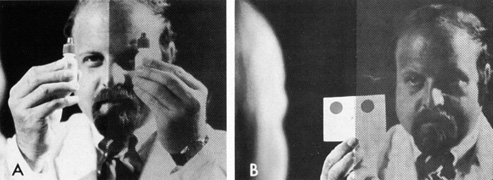
Fig. 15. Color comparison with objects presented to both sides of central fixation. A. Mydriatic red bottle tops. B. Card with two large red patches.

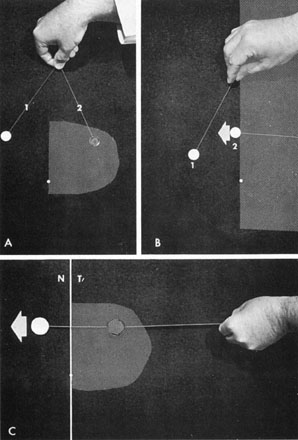
Fig. 16. Central exploration of the vertical meridian. A. Simultaneous color comparison for subtle central depression of the temporal hemifield, especially helpful in early chiasmal syndromes. Target 2 appears desaturated. B. The border of the field defect along the vertical meridian is corroborated by the patient's objective perception of increased color intensity as target 2 crosses the midline and moves into the intact hemifield. C. A single large colored target brightens as it is moved across vertical from temporal field (T) into nasal field (N).

AMSLER GRID

The Amsler grid is designed to test a 20° region of the visual field centered at fixation. It is particularly helpful when there are subtle disturbances of central vision, especially metamorphopsia, but it also can be used to define the configuration, density, and extent of central and paracentral scotomas. The grid is held at 33 cm and the patient monocularly fixates a central dot that is surrounded by a grid of 400 small 1° squares. If the patient has trouble seeing or fixating the central dot, a large X, crossing at the dot, is an option that helps direct the patient's gaze to the center of the grid. While maintaining fixation at the center, the patient is asked to note any alterations in the grid pattern, such as scotomas, fading, distortion, curving, or bowing of the lines.

The major advantages of Amsler grid testing are that it is rapid, portable, and easy to use. Its limitations relate to its relatively low sensitivity and the subjective and qualitative nature of the results, which may limit their reliability.

One strategy for increasing the sensitivity of the test is the use of cross-polarizing lenses to reduce the overall luminance of the grid.63 Although the grid was designed for use without stimulus targets to detect macular pathology, its usefulness in evaluating anterior visual pathway disease is enhanced when small red targets (1–20 mm) are used to map out central and paracentral scotomas and, particularly, in determining whether the latter terminate at the vertical or horizontal meridian

Tangent Screen

Although largely superseded by automated static threshold and Goldmann-type perimetry, the tangent screen still offers a valuable, sensitive, and readily available method for formally evaluating visual fields or screening visual field defects. One of the major advantages of the tangent screen is the relative magnification of the surface area at 1 or 2 m when compared to perimeters that are viewed from 33 cm or less. This allows detailed exploration of small central scotomas and certain suspected nerve fiber layer defects. The relationship of central anatomic areas of the retina and their geometric enlarged projection in space (field) are shown in Figure 17. The tangent screen examination, generally carried out by a physician and not a technician, also provides an opportunity for a goal-directed examination of the visual fields, depending on the site or nature of the suspected lesion. Compared with automated perimetry, it is rapid and convenient, even if less quantitative or standardized.

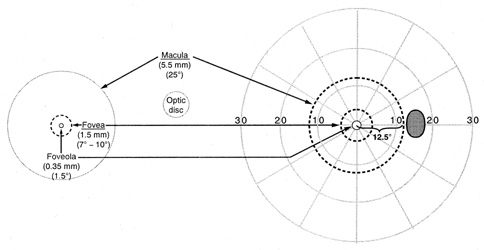
Fig. 17. Diagrammatic representation of the anatomic dimensions in millimeters (mm) and degrees (°) of macular areas and of the optic disc of a right eye, left, and the corresponding circular zones in degrees (°) projected onto the right visual field. (From Gray LG, Galetta SL, Siegal T, et al: The central visual field in homonymous hemianopsia. Arch Neurol 54:312, 1997)

For tangent screen examination, the patient is seated comfortably 1 or 2 m from the center of the screen, which should be evenly illuminated, and each eye is alternately tested. The patient is instructed to gaze steadily at a central fixation point. With central scotomas, a large X may be taped across the fixation point and the patient instructed to look at the center of the X mark even if the line intersection is inapparent. The patient's fixation should be observed while the field stimulus is presented, and the examiner must be particularly vigilant for eccentric refixation eye movements, especially at the start of testing. A suprathreshold stimulus is first used, such as a 3- r 5-mm white target at 1 m. As with all field testing, the stimulus is moved from nonseeing areas to seeing areas. A flat disc stimulus is preferred, white or red on one side, black on the obverse, that can be flipped over and thus “hidden.” Patients are instructed to indicate verbally or by gesture when they first see the target, and not the wand, hand, or vague movement. Occasional sham presentations of the wand with the black obverse side of the disc stimulus ensure that the patient is responding correctly. If the chosen target is above threshold everywhere on the screen except for the blind spot, a smaller stimulus is selected. On the other hand, the depth and size of scotomas or other field defects can be explored with larger stimuli. Shallow central field defects can be defined more easily with a red target, particularly when a small white target is seen in the area of the presumed scotoma. The blind spot should be initially explored and mapped to demonstrate the concept of target detection and disappearance; this is best accomplished with a relatively large (e.g., 5 mm) suprathreshold stimulus. If the blind spot is enlarged, further testing with larger stimuli is required. The points at which a particular target is detected can be marked with pins, and theses points then can be transcribed to a standard visual field chart. With tangent screen field plots, the stimulus is specified by notations such as 5/1000/W, which defines a white (W) stimulus, 5 mm in diameter, presented at a viewing distance of 1 m (1,000 mm) (see Fig. 5C).

The importance of the central field (especially the fixational area) in the diagnosis of optic nerve disease, and the significance of the vertical meridian in the diagnosis of chiasmal and homonymous hemianopic defects have been emphasized. Therefore, the examiner's attention and time should be directed to exploring these areas (Fig. 18).

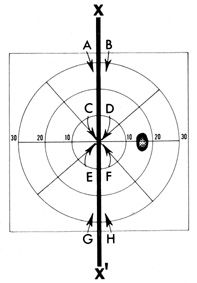
Fig. 18. Importance of vertical meridian (X, X') in neurologic diagnosis. Testing of visual function, whether form (standard targets) or color, should consist of comparisons along the meridian (X, X'), at A-B and G-H for detection of “hemianopic step” in the periphery, and at C-D and E-F centrally.

Although the peripheral field may be defective, there is almost always depression of the central field in optic nerve disease. Therefore, special emphasis should be given to exploring for scotomas in the central region of fixation and between this region and the blind spot. As indicated, this area is best explored with relatively large colored targets while the patient is asked to indicate when the color appears or brightens (see Fig. 14A).

Ischemic optic neuropathy and occasionally optic neuritis tend to produce altitudinal and arcuate visual field defects and nasal steps, which usually are limited by the horizontal nasal meridian (see Fig. 7). Responses to targets presented in the superior and inferior hemifields and specifically the upper and lower nasal quadrants can be compared across the horizontal meridian. Field defects with sharp borders and steep gradients across the horizontal nasal meridian, if not also present as a homonymous defect in the other eye (i.e., involving the homonymous temporal quadrant), always implicate the optic nerve head or peripapillary retina as the site of the lesion producing the field defect.

Chiasmal syndromes tend to produce bitemporl depression. Characteristically, the field defect is hemianopic, extending toward the periphery, but occasionally the scotoma can be limited to the temporal paracentral region (see Fig. 16). For these field defects, testing to either side of the vertical meridian is critical because visual function in the temporal and nasal hemifields must be compared. The same holds true in homonymous hemianopic defects resulting from retro-chiasmal lesions. Hemianopic field defects have sharp borders at the vertical meridian, which neither optic nerve nor chorioretinal lesions manifest. A vertical step or discontinuity in the isopter should be sought along the vertical at the upper and lower extremes of the tangent screen. Within the central few degrees of field, it is often useful to employ colored targets, for here the patient can comment on relative color intensity and note when the target enters or emerges from a zone of color desaturation.

Homonymous hemianopia results most frequently from infarction of the calcarine cortex, with occlusion of the posterior cerebral artery or its branches (see Chapter 7). The occipital pole receives collateral blood supply from the middle cerebral artery and may be spared when an infarction occurs in the more anterior portions of the visual cortex supplied by the posterior cerebral artery. This mechanism produces a field feature referred to as “macular or fixation sparing,” for the area around the fixation point that represents the large cortical projection of the macula. Testing for spared remnants near fixation is practically accomplished at the tangent screen or by confrontation.

During field testing, patients may shift their gaze a few degrees to either side of fixation and the hemianopic midline shifts with gaze angle. Therefore, the patient with a complete hemianopia seemingly detects test objects into the presumed hemianopic field, a form of pseudosparing. With face-to-face confrontation testing, the examiner can maintain direct eye contact while bringing a target from the periphery across the hemianopic field toward fixation and thus can detect even slight refixation movements. In the absence of refixation movements, the patient without macular sparing does not see a target until it crosses the vertical midline passing through the visual axis shared by patient and examiner. When macular sparing is present, the target is seen by the patient in the “blind” hemifield well before it reaches the visual axis.

Factitious (Functional) Fields

The visual field defects of hysteria and malingering typically are associated with an alleged symptom of marked peripheral constriction or “tunnel vision.” Unlike the organic causes of generalized field constriction (see Chapter 5), a tubular field maintains the same diameter, that is, it does not expand geometrically with increasing test distances. Thus, in these situations, assessment of peripheral field constriction involves testing at two or more viewing distances (Fig. 19); this maneuver is easily accomplished at the tangent screen or by confrontation field testing. The average person is not aware that the eye, like a camera, encompasses a certain linear diameter at a 1-m viewing distance, and that this field size measures roughly twice the linear diameter at 2 m. In an attempt at consistency, patients with nonphysiologic field constriction dissemble and respond as if the field diameter at a viewing distance of 2 m remains the same or even becomes smaller than the field diameter at a 1-m viewing distance, rather than showing physiologic conical expansion. Of course, physiologically constricted fields, similar to a camera, show enlarged diameters at increasing distances.

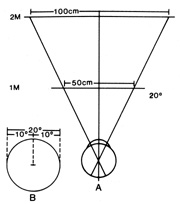
Fig. 19. A. Diagram of tangent screens placed at 1- and 2-m viewing distances. B. A 20° diameter of central field is used as an example. Measured at the screens, the circle has a diameter of 50 cm at 1 m and a diameter of 100 cm when viewed from a distance of 2 m. The physiologic field of vision is actually a cone with the base outward. Visual field constrictions of functional origin show a tubular pattern with the patients failing to understand the effect of testing at variable distances, so that the field diameter is usually the same (or worse) at the more remote viewing distance.

Clinical Perimetry

Routine field testing at the classic 1-m distance from a black tangent screen has been more or less replaced by the modern bowl perimeter, with a reduced viewing distance of about 0.33 m, but with the great advantage of standardized and reproducible target and background luminance (i.e., contrast). The goal of conventional clinical perimetry remains to measure subjective detection sensitivity to the onset of a white light stimulus in different locations of the field, at low photopic background luminance levels, in order to identify normal areas and regions showing sensitivity loss (scotomas). Two general perimetric techniques are widespread: Goldmann-type kinetic perimetry (manual and computer-assisted) and computer-automated static perimetry.

GOLDMANN KINETIC PERIMETRY

In kinetic perimetry of the Goldmann type, a stimulus of fixed size, luminance, and contrast is projected onto the surface of a bowl-like hemisphere of defined background luminance. The stimulus is moved from nonseeing to seeing areas and the patient signals when the moving light is first detected. This procedure is repeated along several radial meridians. The contour line connecting all the loci detected defines the isopter and field abnormalities for that particular stimulus-background combination. A number of isopters may be determined, and the visual field defect may be quantified by altering the stimulus intensity or size.

A Goldmann visual field examination typically involves determining three isopters (Fig. 20B), and this is usually sufficient to characterize the surface of Traquair's island adequately (see Fig. 5). More isopters may be required to define certain defects, tailored to explore the region of the defect and avoid unnecessary patient fatigue. If a scotoma is discovered during suprathreshold static screening in the central field, the stimulus is moved radially outward from the center of the defect in a series of presentations to determine the borders of the defect. Progressively larger or brighter stimuli are then presented within the scotoma to define the density of the defect. (Conceptually, this is plotting the shape and depth of local erosions in Traquair's island.)

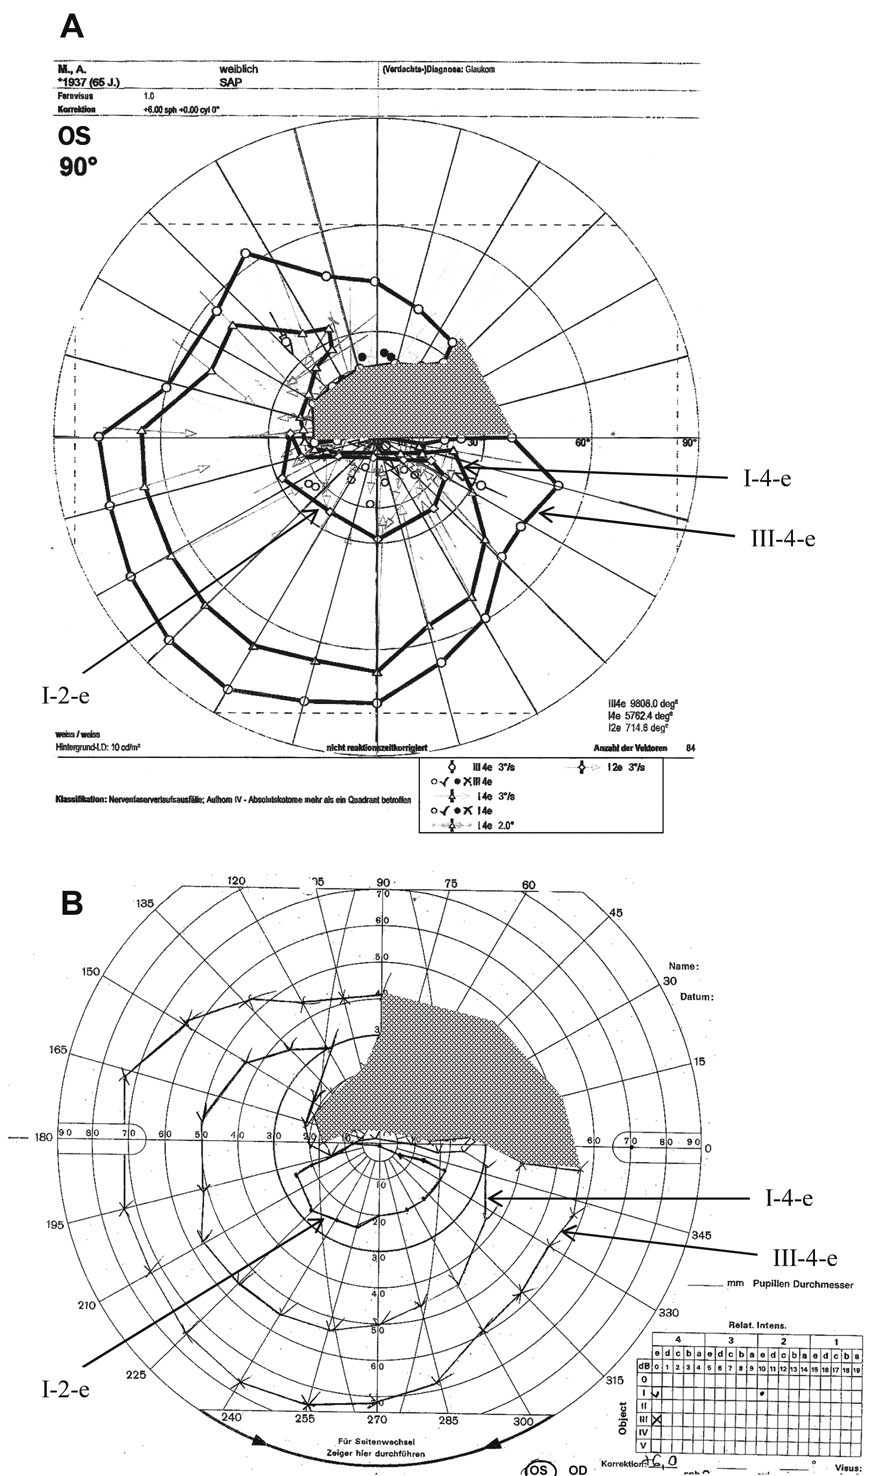
Fig. 20. Visual field of the left eye of a 65-year-old patient with a superior arcuate scotoma from AION. Comparison of manual and computer-assisted kinetic perimetry. A. Visual field printout from the PKP (programmed kinetic perimetry) module on Octopus 101 instrument to three different stimuli (I-2, I-4, V-4). B. Manual kinetic perimetry on a Goldmann-type bowl perimeter performed on the same patient using te equivalent stimuli. In both A and B arrows labeling the isopters and shading highlighting the scotoma have been added to the original printouts. Note the somewhat smaller scotoma to the V-4 stimulus obtained with automated perimeter (see text).

Goldmann-type perimetry evaluates the full extent of the visual field and so it is useful in exploring defects outside the central 30° zone. However, because the central region is reduced in size relative to the tangent screen, small central defects are more difficult to detect and map. Kinetic perimetry allows fairly rapid field examination, but sometimes lacks reliability because of its dependence on the patient's reaction time, speed of target movement, and variability introduced by different perimetrists. In kinetic perimetry, the very motion of the stimulus also contributes to its detection (Riddoch phenomenon).64

Egge65 carried out a useful study of normal Goldmann visual fields on 374 persons ranging in age from 15 to 69 years, categorized by decades. Isopter size declined steadily by decade throughout the sample, with regression greatest for the temporal quadrants and more marked for central rather than peripheral isopters. Variation over time fluctuated most for the I-1 isopter, especially in the temporal quadrants. The isopters were uniformly oval with a long horizontal diameter. Variation from this shape was most common for the I-1 isopter, with the temporal margin falling either outside (52%) or inside (11%) the physiologic blind spot. With increasing age, a greater proportion of subjects' I-1 isopters passed inside the blind spot; 76% of subjects in the 60- to 69-year age group demonstrated this pattern.

COMPUTER-ASSISTED KINETIC PERIMETRY

Semimanual, computer-assisted kinetic perimetry, designed to replicate Goldmann-type manual kinetic perimetry is available as an optional programmed kinetic perimetry (PKP) module on the Haag-Streit-Octopus 101 VFA (see Fig. 20A). This instrument allows testing of the complete 90° field pm a Goldmann-type spherically shaped bowl. The perimetrist can program the specific stimulus size and intensity from choices that match standard Goldmann stimuli. In addition, the velocity and direction of stimulus motion can be set and remains constant until the patient responds, thus eliminating intratest and intertest variability in this critical parameter. The program compensates for the reaction time of the patient, using the speed of the target and its direction, and adjusts the locations of the “response points.” This produces slightly larger “seeing areas” and slightly smaller scotomas when compared with full manual perimetry (compare Fig. 20, A and B). The computer draws the isopter lines, as directed by the perimetrist. Arguably the most important feature, however, is that the customized strategy originally chosen to test a given patient can be repeated by the computer each time the patient is retested, allowing more objective monitoring of changes with serial visual fields obtained over time. Consequently, different perimetrists can perform essentially the identical test on a patient at different times. This addresses a key weakness in conventional manual kinetic perimetry and reduces dependence on the skill and consistency needed by the perimetrist. The kinetic (Goldmann) field result can be combined with conventional static 30° threshold visual field, which can be performed on the same instrument, and the static and kinetic results can be superimposed on the printout. Because the Octopus PKP and the manual Goldmann perimeter are both produced by the same company (Haag-Streit, Koeniz, Switzerland), the traditional instrument will now presumably be phased-out, with the computer-assisted version achieing greater acceptance as clinical studies demonstrate its usefulness and reliability.

AUTOMATED STATIC THRESHOLD PERIMETRY

At present, automated static perimetry has largely supplanted manual kinetic perimetry for routine field examinations, although Goldmann-type kinetic perimeters are still especially useful in certain clinical settings. The following review emphasizes the appropriate use of automated perimetry in clinical practice.

Full-Threshold Static Perimetry

Static perimetry refers to the technique of visual field testing performed with nonmoving stimuli. Purely static examination with manual perimetry of the Goldmann-type is time consuming and has been used in the past only on a limited scale to spot check selected locations, such as the Bjerrum arcuate bundles, or otherwise within the isopters initially defined with manual kinetic perimetry. Computerized static perimetry has gained rapid acceptance by providing systematically controlled presentation of brief, nonmoving stimuli at selected locations. Therefore, it is more objective and mathematically more exacting than the most rigorous manual kinetic techniques. Furthermore, the random ordering of stimuli presentations across the field of vision and the accurate registry of patient responses, without the need for a perimetrist-facilitated visual field examination, substantially decreases the test time and eliminates operator variability. The latest of a series of different types of computerized static perimeters are the Humphrey (Carl Zeiss Meditec, Inc., Jena, Germany) and Octopus (Interzeag AG, Koeniz, Switzerland)Visual Field Analyzers (VFAs), which are now the most widely used automated perimeters.

In automated static perimetry, the stimulus is constant in size and is presented at programmed loci in the visual field for a controlled exposure time. The most commonly employed threshold determination is a staircase method in which true threshold is determined by presentations at luminance levels brighter than and dimmer than threshold (bracketing). Typically, three to five presentations are needed at each test locus. It should be recalled that the stimuli are presented randomly at successively and subjectively unpredictable locations; the bracketing presentations at a given locus may take place minutes apart. A special strength of computer-assisted perimetry is the capacity of the computer to keep track of stimulus–response relationships at all test locations, and to place subsequent stimuli randomly at the proper brightness to approach threshold as determined by the patient's response to earlier presentations at that locus. The staircase procedure used for full-threshold determination proceeds as follows: The intensity of the stimulus at a given locus is either increased (ascending) or decreased (descending) until the stimulus is detected or missed by the observer, respectively. After this initial threshold estimate is determined, the stimulus intensity may be altered in the opposite direction using smaller steps. The staircase procedure in current practice terminates after crossing the threshold once or twice, and that design is considered closest to ideal.66

Computerized automatic projection perimeters are capable of producing the standard-size Goldmann test stimuli across the range of stimulus brightness levels. It is customary to define the intensity of the stimuli used by computerized perimeters and the thresholds measured in decibel (dB) units. The dB notation indicates attenuation in stimulus brightness. The brightest stimuli produced by the perimeter have the intensity of 0 dB, which may represent an intensity of 10,000 apostilb. Increasing sensitivity (the ability to see dimmer stimuli) is denoted by higher dB values, so that 10 dB and 20 dB indicate attenuation of the stimulus brightness by 0 and 100 times, respectively (i.e., down to 1,000 and 100 apostilb). The stimulus intensity may be changed by as little as one decibel (i.e., 0.1 log-unit steps) with each presentation after the initial estimate of threshold sensitivity at a particular locus.

With a normative database that is age specific, computer-driven perimetry begins at a stimulus luminance close to the expected threshold for each test point. However, threshold sensitivity may vary from the normal at many test locations, making the normal threshold a poor starting point. Another strategy selects a starting brightness based on thresholds at adjacent points tested.67 This approach is efficient because there is a high degree of correlation between thresholds at adjacent points, even within visual field defects.

The Humphrey VFA starts the full-threshold examination and the various screening protocols by testing four points, one in each quadrant. For threshold determination, starting levels at adjacent points are based on the threshold levels determined for these first four points. As testing proceeds, starting levels at subsequent loci are based on thresholds that have been determined for adjacent or other nearby points.

Among a number of test grids available for evaluation of threshold sensitivity, a rectangular grid of points at 6° intervals in the central 30° has become the most standardized and frequently used array. The Humphrey VFA 30-1 and 30-2 full-threshold examinations use 6° test grids to evaluate the central 30° field, whereas the Humphrey 24-1 and 24-2 programs test only the most central 24° by dropping most of the peripheral test points on the same 6° grids. The Humphrey Central 30-2 (Fig. 21) and 24-2 (Fig. 22) programs, which test 76 or 54 test locations, respectively, have become the most frequently used and standardized programs because their test loci straddle the vertical and horizontal meridians, providing the optimal strategy for determining whether neurologic or glaucomatous field defects respect these boundaries. Various screening strategies (described later) may be applied to any of these specialized or standard test grids. For example, the Humphrey Central-76 point screening grid is identical to that of Central 30-2 threshold program.

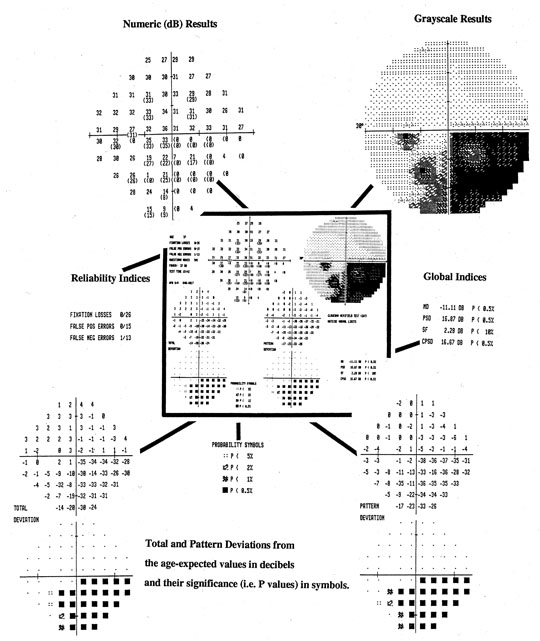
Fig. 21. Central 30-2 test using full-threshold strategy with STATPAC. Center (darkly outlined): Single field printout from Humphrey Visual Field Analyzer of data from the left eye of a patient with an inferior arcuate scotoma and a dense nasal step. Key components of the printout are shown, enlarged, around central display. Top left: Numeric threshold sensitivity values in dB (“raw data”). Top right: Gray-scale plot. Center left: Reliability indices. Lower Left: Topographic display of total deviation at each test point. Numeric values, representing differences between patient's measures and those of age-matched subjects with normal vision are shown, above, with corresponding probability plots, below. Lower right: Topographic display of pattern deviation at each test point. Above, numeric values (see text); Below, corresponding probability plots. Bottom center: Probability symbols defined; p values represent the probability that individual deviation from normal value can occur in a normal subject. Right center: Global Indices (see text).

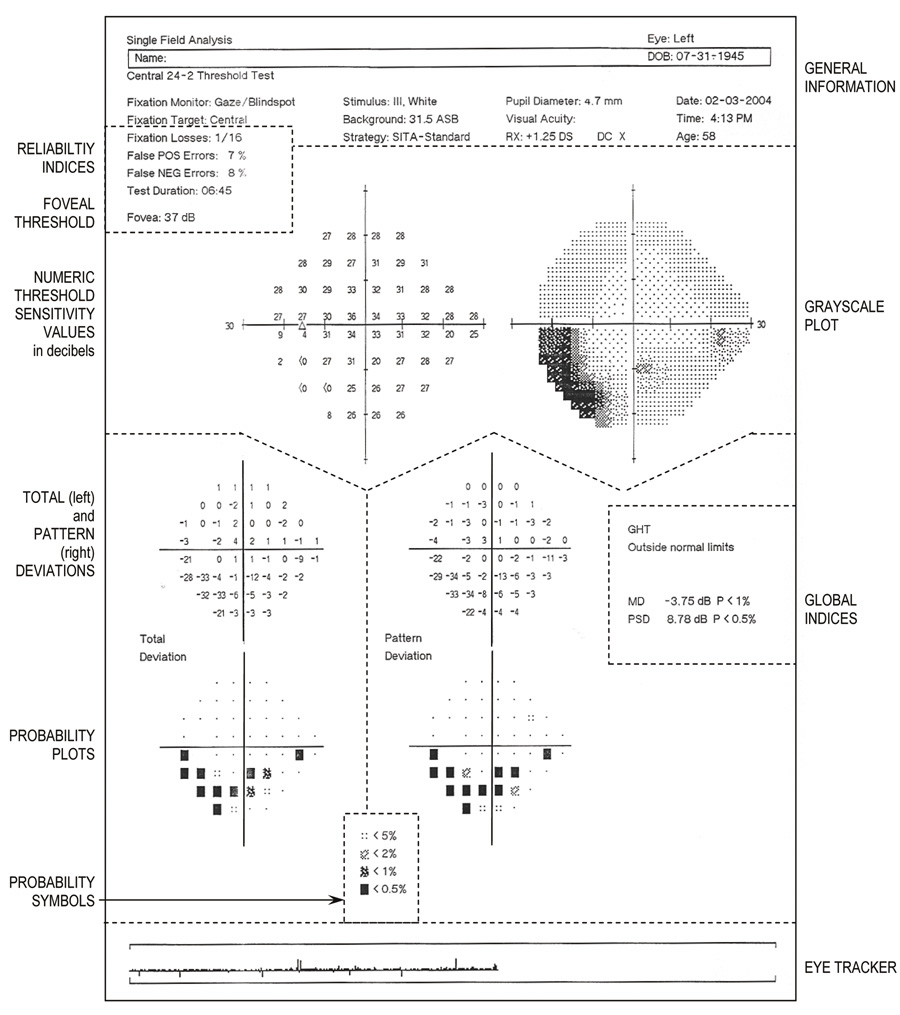
Fig. 22. Central 24-2 threshold test using SITA-standard strategy. Single field printout from Humphrey Visual Field Analyzer from a 58-year-old patient with an inferior arcuate scotoma, denser temporally. Key sections are identified by legends alongside the printout and are separated by dotted lines that have been added. Top: General information about the patient and the testing procedure. Just below, on the left are the Reliability Indices and foveal threshold. Upper half: The large graphic display shows, on the left, the numeric threshold sensitivity values in decibels (raw data) and, on the right, the gray-scale plot. Lower half: Total deviation (left) and pattern deviation (right) at each tested point. Numeric values are displayed topographically, above, with corresponding probability plots, below. Bottom center: Significance level of the shaded probability symbols (used in probability plots) are defined. Extreme right middle: Global indices (MD and PSD and their respective probability values).

Many studies have compared automated static threshold perimetry with kinetic Goldmann perimetry in different clinical settings. For example, Trope and Britton68 compared findings using the Humphrey VFA and the Goldmann perimeter on 25 patients with glaucoma, whereas Beck and colleagues69 compared the two perimeters in 171 eyes: 69 with glaucoma or intraocular hypertension, 69 with neurologic vision disorders, and 33 with normal vision. Overall, these studies have demonstrated that both the Humphrey VFA and the Octopus perimeter are excellent at detecting glaucomatous and neuro-ophthalmic field defects with a high degree of sensitivity and specificity. However, it is important to note that, in contrast to Goldmann perimetry, a significant percentage of the results with automated perimetry were inadequate or unreliable, mostly because of fixation problems, and patients much preferred the manually administered Goldmann fields.68 Improving patient reliability and convenience by shortening the time and effort required to obtain full-threshold tests has been a major challenge that is being addressed by increasingly sophisticated systems and protocols.

The Swedish Interactive Threshold Algorithm

The Swedish interactive threshold algorithm (SITA) is the latest refinement in the strategy used by the Humphrey VFA to determine threshold values at the 52 or 76 points that make up the central 24-2 and 30-2 test grids, respectively. SITA is optimized to minimize test time, and thus, addresses the most important limitation of full-threshold static perimetry. SITA has both a standard and fast version that corresponding to STATPAC and FASTPAC versions of the full-threshold Humphrey field tests (see later). However, by basing the testing strategy on expected threshold values, data from surrounding test locations, and how values at certain points influence the expected values at other points, SITA has cut visual field time almost in half.67,70 Also, the staircase procedure is interrupted when a predetermined level of uncertainty is reached. Test time is further reduced, adapting the stimulus presentation rate in response to the patient's reaction time (time pacing). A study comparing the SITA standard test with the Humphrey full-threshold in 42 patients with optic neuropathies or hemianopias and 28 normal subjects showed that, on the average, sensitivities were approximately 1 dB higher in patients using the SITA standard. The authors conclude that the SITA standard appears at least as good as ful-threshold for detection of visual loss in individual examinations.70 Because similar studies have found the SITA-standard comparable to the full-threshold algorithm in a variety of conditions, the SITA-standard test has now largely replaced traditional full-threshold tests on the Humphrey VFA.67,70 However, one disadvantage of the SITA protocol is that it uses only Goldmann-equivalent stimulus size III.

Short Wavelength Automated Perimetry

Some retinal diseases influence rod or cone function differentially and selectively. Specific rod or cone deficits may be missed with white luminous stimuli because the rods continue to operate at the modest photopic (mesopic) background levels of conventional perimeters. However, it is possible to measure the threshold to a positive contrast (incremental) stimulus of one particular wavelength while the background is illuminated using a different wavelength composition, thus increasing the sensitivity of the test for cone disease. For instance, a strong yellow adapting background selectively reduces the sensitivity of the red and green cones, but it has a minimal effect on blue cone sensitivity. When a blue test target is presented on a yellow background, the visibility of the stimulus reflects the functionality of the blue cone system.

Blue-on-yellow (short-wavelength) automated perimetry (SWAP) has been described as a “more sensitive” method of detecting field loss in glaucoma71–73 and has become an optional testing mode on the Humphrey VFA. In that mode, a static, blue stimulus of Goldmann size V is presented against a high-luminance (200 cd/m2) yellow adapting background that saturates the red- and green-sensitive cones and isolates the blue, short-wavelength-sensitive cones. A prospective 5-year follow-up study of patients with glaucoma and ocular hypertension indicated that visual field defects mapped using this short wavelength technique could appear larger and seem to increase in size more rapidly than those mapped with conventional white stimuli.74 In addition, early defects picked up only with blue-yellow testing converted to visual field defects with conventional testing with progression of disease.75

Although short wavelength automated perimetry remains promising and has been shown to improve the discrimination of abnormal fields from normal fields, the increase in variability that occurs with this technique is a problem, and it has not yet replaced conventional automated perimetry in the detection of early field loss.74,76

Other Automated Threshold Tests

Certain specialized tests, available on the Humphrey VFA, are designed to provide more information about specific regions of the visual field. Two that are most useful are the Central 10-2 threshold test, which tests at 68 locations within a circle of radius of 10° from fixation, and the Macula test, which measures the threshold at only 16 points within the central 5°. For both these test the locations are spaced 2° apart and are offset on 1° from the principal meridians. The 10-2 test is particularly useful in defining small, central and paracentral scotomas that may reduce threshold values at only 1 or 2 central points on the standard 6° test grids (30-2 and 24-2). Also, patients with very advanced field loss who have only a small central island of vision (e.g., those with advanced glaucoma or RP) can be tested with the 10-2 program, using either stimulus size III or V. The Macula test determines the threshold value at each of the 16 locations three times and provides a better estimate of local short-term fluctuation (see the following. When the patient is reliable, even very subtle abnormalities of central vision can be detected and monitored over time.

AUTOMATED STATIC SCREENING PERIMETRY

Several screening tests are available on the Humphrey VFA. Initially, with each test, threshold values at the same four original test locations are determined and the expected threshold at each other point is calculated from the normal shape of the hill of vision, which is adjusted up or down according to the thresholds at the four original test locations. The basic Humphrey screening strategy tests each point twice, with stimulus brightness set 6 dB above expected threshold for each location. If the first stimulus presented at a given location is detected, no further presentations are made at this location. Thus, any defect deeper than 6 dB should be detected. This method, known as the threshold-related screening strategy, is used to screen for abnormalities without any quantification, thus saving time at the cost of reduced information. Additional data can be collected on points missed. Using the three-zone strategy each missed location is retested with a maximally bright stimulus to determine whether the loss of sensitivity is relative or absolute, whereas when the quantify defects strategy is used, missed points undergo full-threshold determination. These alternate screening strategies take more time than simple screening, but provide more information.

The main purposes of screening visual field examination programs are to establish the presence or absence of a visual field defect and indicate the boundaries of any scotomas. Screening is particularly useful for those patients who have not had previous visual field examinations. The tests are not suitable for quantification of field defects, or careful follow-up of patients to determine the progression of the disease or the effectiveness of the treatment.

FREQUENCY DOUBLING PERIMETRY

Frequency doubling technology perimetry (FDTP) is a rapid, convenient visual field test that can be used to screen for glaucoma and other optic nerve disease.77 For this test, the 20° central field is divided into 17 target locations, four 
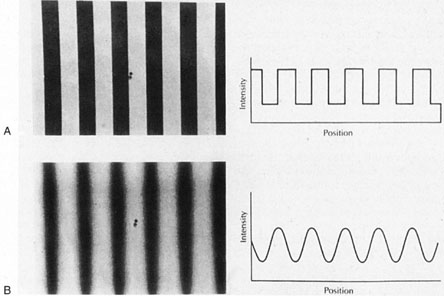
test locations in each quadrant, and one central location (Fig. 23A). The stimulus is a low spatial frequency sinusoidal grating (0.25 cpd) that undergoes temporal-frequency counterphase flicker, at a rate of 25 Hz. (i.e., the black and white bands reverse rapid sequence). The program varies the contrast of the grating and determines the minimum contrast at which a patient can detect the flickering at each of the target locations.

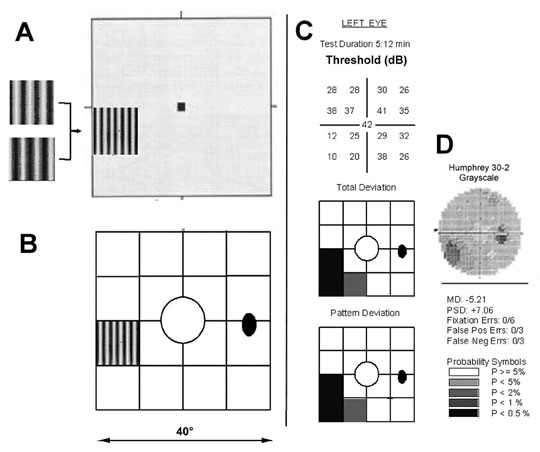
Fig. 23. Frequency doubling technology perimetry. A. The stimulus is a low spatial frequency sinusoidal grating (0.25 cpd) subtending 10°, presented at 1 of 17 test locations. The grating alternates at a high temporal rate (25 Hz) between two phases, shown at left. The frequency doubling illusion is the subjective perception that the grating has twice the number of dark and light bars (i.e., its spatial frequency appears to be 0.50 cpd), as shown in the diagram. B. Array of 17 stimulus locations, 1 central 10° circle and four squares in each quadrant. C. Sample FDTP printout from OS in a patient with an inferior nasal deficit, showing numerical full threshold values (top), probability plots of the total and pattern deviations (center and bottom, respectively), and global and reliability indices (bottom). D: Humphreyfull threshold 30-2 grayscale printout from the same patient, for comparison.

The flickering gratings are detected only by the M-cell pathway, which is responsible for generating the “frequency doubling illusion”—the perception that the grating has twice the number of dark and light bars (i.e., twice the spatial frequency).78 FDT perimetry is thought to be a sensitive detector of optic nerve pathology because the nonlinear M-cell neurons that this test selectively stimulates comprise no more than 5% of all retinal ganglion cells, and it is precisely these cells that are most susceptible to early damage in patients with glaucoma.

This instrument was designed as a screening test for glaucoma and is excellent for early detection of glaucomatous visual field deficits.77 There have been fewer studies on patients with neuro-ophthalmologic disease. One study comparing FDTP and conventional full-threshold static perimetry (Humphrey VFA 30-2 and 24-2) in 72 patients with various nonglaucomatous optic neuropathies demonstrated that FDTP sensitivity and specificity and the number, extent, and shape of the visual field defects revealed were similar with both tests.79 However, the same study also evaluated 25 patients with hemianopic defects resulting from chiasmal and retrochiasmal disease and showed that FDTP missed hemianopic defects because it often failed to detect abnormal test locations along the vertical meridian and because of the spurious scattered abnormal test locations that were generated in these patients. The authors attribute this to light scatter across the midline from adjacent stimuli.79

A more limited study of 14 patients with recovered optic neuritis80 demonstrated that FDTP tended to localize the deficits to more peripheral regions of the field, whereas conventional static threshold perimetry localized the deficits more centrally, toward the fovea. Another study81 that included 138 eyes with neuro-ophthalmic field defects determined that FDTP is a sensitive and specific test for detecting defects, but that the technique could not accurately categorize hemianopic, quadrantanopsic, or glaucomatous defects. Thus, it appears that, at present, the main contribution of FDTP is to screen for and detect visual field abnormalities. Use of this test to categorize the type of defect and its cause, or to monitor patient for progression over time will require further refinements.77,79

A new version of the FDTP, called the Matrix, has been introduced. It tests more locations, each with smaller test areas than the original FDTP. The data printout is more similar to the Humphrey Field Analyzer printout, making interpretation and comparison easier. However, the usefulness and acceptance of this test in the clinical evaluation of patients with sensory neuro-ophthalmic disease remain to be determined.

AUTOMATED VISUAL FIELD RESULTS AND INTERPRETATION

Representation of Results (Graphic Display)

In manual kinetic perimetry, loci where a particular stimulus is detected are marked and later connected with lines (like isobars on a weather map) to form isopters (see Figs. 5B and 20), as has been described. Scotomas are outlined in a similar manner. With automated static perimetry, the test data are not usually converted into isopters lines per se. Instead, one or more of several different displays may be used, depending on the program (screening or threshold) chosen. Usually, graphic and numeric representations of the measurements made at each tested point in the viual field are presented topographically on a chart of the particular test grid used. Figure 21 demonstrates key portions of the graphic display generated by the central 30-2 full-threshold test produced by the Humphrey VFA, which is described later. Figure 22 shows a similar demonstration of key features for the central 24-2 SITA-standard test. Other automated perimeters provide similar displays.

Numeric Display

A numeric display of the actual threshold values in decibels at each test location on automated perimeters such as Humphrey VFA (Figs. 21 and 22, upper left) can be charted to provide a topographical printout of the “raw data.” Decreased sensitivity at any point can be derived by comparing numeric threshold value at that point to the following: (a) the values at surrounding locations, (b) the threshold values at mirror image test locations in both eyes of the same individual, or (c) mirrored points across the horizontal and vertical meridians of each field. A few test points with significantly reduced sensitivity occasionally occur by chance alone. However, falsely abnormal points arising by chance should be scattered randomly in the field. Clusters of two or more depressed points must be regarded as true defects.

The detection sensitivity at each locus in the visual field decreases with age. This decline with increasing age requires that the limits of normal for all test locations be defined so as to enable comparisons between the results from same or different individuals. The statistical software packages, incorporated in Octopus and Humphrey VFAs, perform comparisons between each patient's test results and age-expected normal visual field threshold values for a particular test strategy. The differences between the measured and age-expected threshold values at each test location are shown in the total deviation map (Figs. 21 and 22, lower left). In addition, for each tested point, these programs calculate the statistical significance of the deviation in sensitivity and compile empiric probability maps82 (Figs. 21 and 22, bottom). Such maps are easier and more accurate to interpret than the numeric and gray-scale maps. These statistical packages further facilitate the recognition and analysis of the defects on a single visual field test by calculating global visual field indices (Figs. 21 and 22, middle right), which are interpreted later. In addition, these programs compile and print out a longitudinal series of repeat fields obtained on the same eye, facilitating the evaluation of field changes that occur over time.

Grayscale (Symbols) Display

The most common visual graphic representation of automated visual field test results is the grayscale plot (see Fig. 21, upper right). The sensitivity values obtained from the examination are assigned different sized or shaded symbols on the computer printout of the test result. Generally, the larger or darker the symbol, the lower is the sensitivity (the denser the defect). The spaces between test loci are assigned interpolated values such that the entire visual field projection appears in various shades of gray. Because the peripheral visual field has lower sensitivity than the center, the gray scale plot will normally become darker towards the periphery of the field.

Reliability Indices (Catch-Trials)

See Figure 21, center left, and Figure 22, upper left.

Fixation Losses

The frequency of fixation losses is used to assess the patient's cooperation with the requirement of steady fixation during the tes. In the Humphrey VFA, the ratio of the number of fixation losses to the total number of stimulus presentations in the physiologic blind spot is recorded. Fixation losses exceeding 20% are regarded as a sign of low patient cooperation. Although lack of accurate fixation does not cause false field defects in normal eyes, it leads to underestimation of the existing defects in glaucomatous eyes.83

False-Positive Responses

The number of occasions when the response button is pressed without a stimulus being presented represents the patient's over-willingness to see in the field of vision. If the number of false-positive responses is greater than 33% of sham stimulus presentations, the patient is considered unreliable. A high number of false-positive responses is an indication that existing field defects will be underestimated.

False-Negative Responses

Occasionally, an easily detectable suprathreshold (too bright) stimulus is presented and the patient is expected to press the button indicating the target was seen. False-negative responses are recorded when the patient misses these suprathreshold stimuli; the percentage of false-negative responses should be less than 33% for the patient to qualify as reliable. An abnormally high number of false-negative responses indicates the patient's lack of attention to stimulus presentations during the test and may lead to apparently abnormal fields in healthy persons and may overestimate the existing glaucomatous field defects.83

During their first threshold test, 30% to 45% of patients produce unreliable results because of difficulty in maintaining fixation or because of too many false-negative responses.84 Subject reliability improves to 25% with experience;85 however, even with repeat testing, 4% to 9% of patients consistently fail to generate reliable results, and the poor reliability results almost exclusively from fixation losses. Factors such as age, pupil diameter, and visual acuity do not influence the reliability parameters.84

Deviation and Empiric Probability Maps

STATPAC/FASTPAC and SITA programs on the Humphrey VFA calculate and print out graphic displays of “total deviation” and “pattern deviation” and empiric probability maps to assist in interpretation of the threshold field results. Because the normal sensitivity threshold at each test point varies, it is impossible to define a minimum normal value for all test points. Consequently, the deviation from the age-related normal threshold at each individual test location must be determined. Deviations of 4 dB or more are presented topographically in a map labeled “total deviation.” Using normative data, the significance limits for the deviations at each test point are calculated so that statistical significance can be attached to deviations from the normal age-related values shown at specific test locations on the map. The statistical significance of the deviation at each test location is also presented in a graphic display called the total deviation probability map on the Humphrey VFA (see Figs. 21 and 22, lower left). Using defined probability symbols (see Figs. 21 and 22, bottom center), the highest p value (p < 5%, p < 2%, p < 1%, and p < 0.5%) reached at each location is plotted at the corresponding point on the map.

The total deviation at an individual test point is the sum of the deviations caused by iffuse (generalized, homogenous) reduction in sensitivity of the field plus localized reduction in sensitivity at that point. Therefore, the total deviation plot reflects the global depression introduced by media opacities, small pupils, and uncorrected refractive errors (preretinal sensitivity loss) in addition to localized decreases in field sensitivity resulting from retinal and neurologic disease. The pattern deviation map (see Figs. 21 and 22, lower right) is designed to filter out the diffuse or global component of field depression and highlight the localized pattern loss only. To accomplish this, it is assumed that the most sensitive points in the field are outside any existing localized defects. An estimate of the diffuse component of field depression is based on the deviations from normal measured at 51 most sensitive locations within the central portion of the field. The value estimated for the diffuse component is subtracted from each of the individual total deviations to derive the final numeric value of the pattern deviation at each test point. A pattern deviation probability map (using the same symbols for p values described in the preceding) is then generated and displays the significance (p value) of the pattern deviation calculated for each measured point.

Thus, the empiric probability maps (see Figs. 21 and 22, bottom) indicate even the shallowest defects that deviate from normal and also help to categorize the abnormal points according to the depth and statistical significance of the depression. However, it is important to realize that test-point significance on an empiric probability map indicates only how often a particular threshold value can be expected to occur in the normal population. The significance level does not indicate the chance that a given deviation is normal.

Global Visual Field Indices

Global visual field indices (see Figs. 21 and 22, center right) are intended to summarize clinically important features in the visual field by using conventional statistical methods such as the mean and standard deviation.86 The calculation of the global field indices is possible only when the age-expected normal threshold values are known for each of the individual test locations in different age groups. Four parameters (MD, PSD, SF, and CPSD, see later) are determined by the STATPAC and FASTPAC programs for full-field threshold tests (see Fig 21, center right), but only MD and PSD are derived by the SITA program (see Fig. 22, center right). In addition, probability values, based on comparison with age-matched normal subjects, are provided alongside each global index value. The four indices follow:

  1. 1. Mean Deviation (MD).The values on the Total Deviation plot are weighted by location and the mean of those weighted values is given as the MD. Negative values represent depression. This index is sensitive to a diffuse change in the visual field and insensitive to small localized changes. It is also affected by media opacities, refractive errors, and small pupil size.
  2. 2. Pattern Standard Deviation (PSD). The Humphrey VFA calculates from the standard deviation of all points in the Standard Deviation plot. These values are weighted according to location. PSD is an index of irregularity in the shape of the hill of vision and reflects the extent of localized depressions in the visual field.
  3. 3. Short-term fluctuation (SF). This index reflects the variability in the individual threshold values with repeated testing during the test (.e., intratest and intraindividual variability). Thresholds for at least 10 randomly selected stimulus locations are measured twice during the test session, and the average variability in the repeat threshold values obtained from both measurements is calculated. The square root of the mean variance of all tested locations is taken as the short-term fluctuation (SF). The SF for a patient's first threshold test may be 3 dB, but it should decrease to below 2 dB with repeat testing (SF less than 2 dB is normal). When the SF is higher, it may represent a low level of patient cooperation and vigilance, especially if there are other abnormal reliability indices. When the other reliability indices are within normal limits, a high SF may be the first sign of a visual field disturbance. Patient fatigue also may increase the SF.
  4. 4. Corrected pattern standard deviation (CPSD). CPSD is the SD adjusted for SF on the Humphrey VFA. CPSD provides a more accurate estimate of localized damage since both SF and localized damage can cause an elevated SD. The SPSD filters out the intratest variability component and provides a more accurate index of the true localized defects in the visual field. CPSD (and SD) must be interpreted cautiously in patients with advanced visual field loss, because low (i.e., closer to normal) values can result when there is an overall reduction in visual sensitivity.

Back to Top
ELECTROPHYSIOLOGY TESTS OF THE EYE AND VISUAL PATHWAY

ELECTRORETINOGRAPHY

The electroretinogram (ERG) is a retinal biopotential that can be evoked by either flash or pattern stimuli. For more than 100 years, it has been known that this potential could be recorded from the cornea of the human eye, and clinical ERG has now become a relatively standard and routine technique available in most clinical centers as well as in some private practices. Standardized techniques and recommended protocols have been published for many ERG procedures,87–89 so that results can be shared easily among different clinics throughout the world. Nevertheless, new ERG techniques continue to emerge, understanding of the neural basis of the response continues to evolve, and new components of the response are being recognized. Consequently, this overview primarily deals with the most widely accepted and routinely used aspects of ERG.

Standard (Full-Field) Electroretinography

The traditional full-field flash ERG (FERG) is recorded using either discrete single flashes of short duration (<0.2/s) that elicit a transient response or to a series of rapidly flickering flashes (30–40 Hz) that generate a steady-state sinusoidal waveform. The FERG can be recorded as a response to a single flash, although off-line averaging may be used to improve signal-to-noise characteristics. The steady-state or flicker FERG is typically averaged on line with 10 to 100 repetitions included in each average. Because both single-flash and flicker ERGs are elicited by diffuse light sources that stimulate the full visual field, they represent the mass response of retinal generators distributed across virtually the entire retina. However, the generators of the FERG are located in the distal (outer) two-thirds of the retina. Retinal ganglion cells do not contribute appreciably to this response. Because most photoreceptors are located outside the fovea, the full-field FERG originates primarily from the electrical activity generated by extramacular rods and cones.

The full-field flash ERG s a complex waveform that results from the interaction of electrical potentials arising from multiple generators. In the dark-adapted human eye, the flash ERG waveform typically includes an initial negative component (a-wave), followed by a larger positive component (b-wave), and then a slower biphasic (negative followed by positive) component (c-wave). The ascending limb b-wave may contain a set of higher-frequency oscillations known as the oscillatory potentials. In addition, both the a- and b-wave may exhibit notches that result from differences in timing between the rod and cone components of the response. The a-wave of the flash ERG is believed to be generated by the photoreceptors, whereas the b-wave that occurs later is generated by the Müller cells, whose electrical potentials result from ionic fluxes driven largely by the bipolar cells. Exclusive rod responses can be produced by using low-intensity white or blue light, whereas cone responses can be isolated with bright backgrounds (to suppress the rods) or by using the flicker ERG, which drives only the cones. Amplitude and latency measures as shown in Figure 24 are used to quantify the responses.

Fig. 24. Transient and steady-state ERG response to bright single flash (right) and to 30-Hz flicker (left), respectively. The amplitude and latency measures are indicated.

The most important use of the FERG is to diagnose and evaluate apparent and occult retinal dystrophies and diseases (see Chapter 13, Figs. 2 and 3), such as retinitis pigmentosa and cancer associated retinopathy. However, as previously noted, the FERG reflects the integrity of only the more distal retinal layers and it is not altered by atrophy of the ganglion cells, the axons of which make up the optic nerve. Thus, the FERG cannot be used as an indicator of neurologic visual dysfunction beyond the photoreceptors and bipolar cells of the retina, because it remains completely unaffected by lesions affecting the inner retina and retrobulbar visual pathway. But this characteristic can also be useful, because the presence of a normal FERG can eliminate the outer retina as a possible source of widespread visual dysfunction of the type that would produce severe visual field constriction, for example.

FERG can also be helpful in certain settings by providing evidence of retinal disease when the distinction from optic nerve disease is not certain. A common example is the problem of diagnosing slowly progressive, bilaterally symmetric visual loss in a young person. The differential diagnosis may be between a heredofamilial optic atrophy in which the optic nerve head may demonstrate only minimal pallor, and photoreceptor degeneration, such as a progressive cone dystrophy, in which the appearance of the retina may be equally benign. An abnormal FERG definitely implicates retinal disease. However, because the FERG reflects primarily extramacular retinal function, the converse is not valid. A normal FERG does not rule out a macular dystrophy or degeneration or the early stages of a more widespread process, such as Stargardt's disease.

Focal Electroretinography

Localized retinal disturbances can be evaluated using a technique that has become known as focal ERG.90 The focal ERG represents the retinal electrical activity generated while stimulating and visualizing a small spot on the retina. A specially constructed, hand-held or mounted stimulator-ophthalmoscope that produces a rapidly flickering spot stimulus is required, and the stimulus is postioned under direct visualization on the retinal area of interest (usually the macula). The stimulus is designed to activate only the cone component of the ERG by virtue of its high frequency (30–40 Hz) and bright intensity, which is above the rod saturation level. In addition, the flickering stimulus is surrounded by a bright, steady ring of light that minimizes the possible effects of stray light.

The focal ERG is thought to be derived from the same retinal elements that generate the full-field ERG, but the area of retina that is stimulated (approximately 4°) and the resultant response amplitude are extremely small (a fraction of a microvolt versus 250 mV for the normal full-field ERG). However, this tiny signal can be measured using advanced signal averaging and frequency filtering techniques. These techniques were first introduced to enhance and isolate sensory evoked cortical potentials from background electrical activity generated intrinsically in the brain and externally by the environment. They are essential in recording the VEP and the pattern ERG, as well as the focal ERG, and are now frequently used to enhance the full-field ERG, which is the only visually derived electrical signal that does not routinely require the use of these methods.

Instrumentation used to extract and isolate small, repetitive electrical responses from undesirable background “noise” largely depends on digital computers to provide dynamic frequency filtering and signal averaging. Signal averaging combines and averages multiple short segments of the electrical potential, most often about 0.25 second (250 ms) long, which are synchronized to follow each repetitive presentation of the visual stimulus. After a succession of identical stimuli are presented, the computer sums and averages all synchronized waveforms. All the electrical potential shifts generated by the stimulus should occur at the same interval after each stimulus and are additive. Electrical potentials unrelated to the presentation of the stimulus and those that occur at random intervals, may be positive or negative and are expected to cancel each other out, averaging to near zero after many stimulus repetitions.

For the focal ERG, the amplitude of the response and its phase relationships to the stimulus are the parameters usually measured. The focal ERG has proven useful in distinguishing occult macular from optic nerve disease, especially in patients with unexplained decreased acuity, shallow central scotomas, or complaints of blurred vision with normal or near-normal objective visual function. Patients with optic neuropathies not associated with macular pathology have normal focal ERGs.91 Macular disease, in contrast, can be associated with abnormal focal ERG responses, even when the fluorescein angiogram is normal. This objective finding can help to support the diagnosis of a degenerative or dystrophic macular process, resolving uncertainty and conflict concerning possible causes, prognosis, and management decisions.

Multifocal Electroretinography

For practical purposes, the focal ERG can only be used to determine retinal function at a limited number of retinal foci, typically the fovea and one or two parafoveal locations. The multifocal ERG (mfERG) is a newer technique that permits the simultaneous recording of retinal responses from approximately 100 retinal locations within the central 50° of the visual field. These individual responses can then be mapped topographically onto an image or representation of the fundus (Fig. 25) to provide a type of objective visual field test. An excellent review of the mfERG technique and its applications in neuro-ophthalmology is available.92

Fig. 25. Multifocal electroretinogram (mfERG). A. The mfERG display (stimulus), an array of 103 black- and white-scaled hexagonal elements subtending approximately 50° at the eye, at one moment in time. Circles indicate radii of 5°, 15°, and 25°. A diagram of the eye illustrates area of retina, centered at the fovea and extending beyond the optic nerve that is stimulated by the display. B. Array of 103 mfERG response waveforms extracted from the activity recorded during stimulation; calibration bars represent amplitude and time. C. Three-dimensional mfERG density plot (in nV/mm2) derived from the responses in (B). B and C. Right panel: mfERG from a normal subject. Left panel: mfERG from the left eye of a 24-year-old man with congenital foveal hypoplasia and acuity of 20/80 in both eyes. Dashed line in (B) outlines the central area of markedly reduced mfERG amplitudes, also visible as a central depression of the density plot in (C).

The multifocal ERG stimulus consists of an array of hexagonally shaped elements presented on a video monitor that subtends approximately 50° in diameter at the eye when viewed from 32 cm (see Fig. 25A). The size of the hexagons increases with greater eccentricity and they are scaled so that, in normal subject each of the focal responses will be approximately equal in amplitude. Most commonly the array consists of 103 hexagons, although the number can be varied to change the spatial resolution of the test. Each element in the array alternates between dark and light (black and white) according to a pseudorandom sequence, such that half the elements are light and half are dark at any one instant. Thus, each element in the array has a 50% probability of being light or dark at any one instant and the overall luminance of the array is maintained at a constant level.

Electrodes used for recording the multifocal ERG are the same as those used for the full-field ERG. Only one eye can be tested at a time and the best responses are usually obtained by dilating the pupil and using a bipolar contact-lens electrode. The patient is only required to fixate the center of the stimulus pattern, which subtends approximately 50° centered on the macula. The latest instrumentation is designed to allow continuous monitoring of fixation by means of an infrared video fundus camera. A typical test, consisting of 16 30-second sequences takes about 8 minutes per eye.

The average response from each element in the array is calculated using a complex algorithm that correlates the signal recorded to the timing of the specific sequence of flashes presented to that element. Although only an approximation, each individual focal response (which resembles a small ERG waveform) can be considered a representation of the response from that particular retinal area, unaffected by the stimulation or response of any other area.

The results of the multifocal test are displayed as a topographical array of miniature ERG waveforms, whose relative locations approximate the arrangement of their corresponding hexagonal stimuli (see Fig. 25B). Numerical data for each of the miniature responses can be displayed in the same gridlike arrangement, or data can be summated and averaged in a variety of ways to examine and compare responses from diverse regions of retina. The instrument also displays a three-dimensional, color-coded mfERG density plot that is scaled to represent the amplitude of the response per unit area (nV/deg2) (see Fig. 25C). The software obtains the respone density for each hexagon by dividing response amplitude by area and then interpolates the results. Although attractive, the three-dimensional plots can be misleading and interpretation of results should be based on the array of waveforms and not on this representation of response density.92

The instrumentation to present and extract these minute signals is technologically sophisticated, making availability of the technique limited to major centers and clinics, but its usefulness has been demonstrated in numerous clinical cases and research studies, so that it is rapidly becoming an essential diagnostic tool in selected cases.

Multifocal ERG is most helpful in demonstrating focal abnormalities of retinal function affecting the macula and perimacular region of the retina and, like the focal ERG, it can differentiate between optic nerve and macular diseases in cases of occult central visual loss. However, a major advantage of the multifocal ERG is that the entire posterior pole is tested at the same time, so that the retina defects do not have to be localized before the patient is tested. For example, the multifocal ERG response from specific extrafoveal macular loci may be nondetectable in the early stages of occult macular dystrophies, such as Stargardt's disease and in age-related macular degeneration.93

Heretofore, we have considered the linear (first-order) multifocal ERG response, which is indicative of photoreceptor function, like the full-field ERG. However, higher-order components have also been studied. The second-order component of the multifocal ERG appears to reflect inner retinal function, that is, activity of the ganglion cells and nerve fiber layer,94 and it is most closely related to the pattern ERG (see the following). Thus, reduced amplitudes and increased latencies in the second-order component of the multifocal ERG can indicate pathology in the inner retina, such as occurs in diabetic retinopathy, glaucoma, and other optic neuropathies.95

Pattern Electroretinography

Retinal biopotentials can also be recorded in response to counterphasing (reversing) checkerboard or grating patterns. Although the pattern-evoked ERG (PERG) was originally recorded by Riggs and co-workers in the early 1960s, it was Maffei and Fiorentini96 who first reported that, under appropriate conditions, the PERG may reflect the neural the activity of the retinal ganglion cells. In their original work, they found that following transection of the cat optic nerve, flash or flicker ERGs remained stable, whereas the PERG progressively disappeared over 4 months, an interval that closely followed the time course of ganglion cell degeneration.96 This and subsequent studies have supported the belief that the generators of this response lie in the proximal 30% to 50% of the retina.

Therefore, changes in the waveform of the pattern ERG are believed to reflect abnormalities in retinal ganglion cell function from either dysfunction of the retinal ganglion cells themselves or disruption of input to the ganglion cells resulting from pathology in the distal (inner) retina. The PERG can be recorded in response to the same slow or fast counterphase reversing stimuli that are used routinely in visual electrodiagnostic facilities to generate VEPs. However, unlike the VEP, but in common with all ERGs, the PERG records electrical potentials directly from the eye. This fact and the small retinal potentials generated by pattern stimuli make this technique extremely sensitive to variation in electrode type and placement, thus limiting its utility to those facilities that have developed the necessary technical expertise. However, when coupled with measurement of the mfERG and the VEP, the value of the PERG is that it allows for frther electrophysiologic dissection of the sensory visual pathway. Consequently, disease of the inner retina can be localized. If, for example, the FERG and mfERG are normal, and the pattern ERG and VEP are abnormal, a lesion involving the inner retina can be postulated. Although any form of optic atrophy causing degeneration of retinal ganglion cells could produce these findings, certain retrobulbar processes, such as compression and demyelination, which impede conduction but do not destroy cells, can leave the PERG unaffected. Furthermore, the PERG can assist in the diagnosis of diffuse cerebral degenerative or ischemic processes that can mimic the visual dysfunction of generalized anterior pathway disease. The PERG has been used to evaluate clinical cases of optic nerve damage in glaucoma,97,98 multiple sclerosis,97 and in Alzheimer's disease.99 Other studies have found, however, that the PERG is not a consistently strong indicator of demyelinating damage.100

Visual Evoked Potentials

Electrical activity generated by visual stimuli can be recorded from the scalp overlying the occipital cortex and other areas of the brain using surface electrodes. These cortical potentials are similar to the spontaneous activity that makes up the electroencephalogram, except that they are specifically elicited by visual stimulation, to which they are linked temporally. Unlike the full-field ERG but in common with both focal and pattern ERGs, visually evoked electrical signals recorded from the scalp are of relatively small amplitude when compared with the background random electrical activity of the brain and ambient electrical noise. The visual component of this activity must be extracted from the background electrical activity using the signal averaging and filtering techniques described in the preceding. When isolated from the diffuse cortical activity not directly linked to the visual input, the visually elicited component forms a characteristic waveform, the VEP. These electrical waves, also known as visual evoked responses (VERs) or visual evoked cortical potentials (VECPs), may be produced by either diffuse light flashes (flash VEP) or counterphase-reversing gratings or checkerboard patterns (pattern VEP). The waveform morphology of the flash and pattern VEPs, although similar, is not identical. It is customary to plot the amplitude of the electrical potential on the ordinate and time after stimulus presentation on the abscissa. Depending on the convention used, positive potentials may be either upward or downward (Fig. 26).

Fig. 26. Pattern visual evoked potentials (PVEP). A. Steady-state response: the lower trace is steady-state sinusoidal waveform resulting from 4-Hz (eight pattern reversals per second) stimulation. The upper trace is Fourier transform indicating peak power at the second harmonic of the stimulus frequency (8 Hz). B. Transient response: the PVEP waveform resulting from 1 Hz stimulation. The major positive deflection (P1) occurs normally at about 100 msec after each stimulus. Vertical calibration bar represents the amplitude. Note that positive deflection is downward.

Generally, the VEP can be considered to reflect macular function almost exclusively. This is because of two factors: (a) the cortical magnification factor, which represents the relatively disproportionate and expansive cortical area dedicated to processing foveal ad macular input; and (b) the physical fact that this representation of the macula is closer to the surface of skull than the deeper portions of calcarine cortex that subserve peripheral vision. Change in a pattern stimulus centered on the fovea constitutes a powerful activator of receptive fields in the foveal and perifoveal region. Even if the stimulus is large enough, there is little contribution to the PVEP from areas outside the central 5°. Although the diffuse FVEP stimulus activates receptive fields that extend to the periphery of the retina, for the reasons given, the FVEP also has a predominant macular component. However, in certain instances, when the peripheral field is primarily affected, the FVEP reflects the abnormality more adequately than the PVEP. However, some disorders that typically show peripheral field abnormality, such as glaucoma, do have significantly abnormal PVEPs,97 and evidence of early involvement of foveal function in glaucoma is evident if the proper measurement techniques are applied.101

The main parameters measured with the VEP are its amplitude and latency, the latter being more informative. VEP amplitude is quite variable in persons with normal vision. Latency of the transient VEP is most commonly assessed using the time delay from the stimulus presentation to the P1 (or P100) peak of the VEP waveform, a large positive potential that, in persons with normal vision, occurs around 100 ms after stimulus presentation (see Fig. 26B).

The VEP may be employed to detect or analyze various disorders of the anterior afferent visual pathway. By understanding the mechanisms of damage, some of the abnormalities in the VEP can be predicted. In anterior ischemic optic neuropathy (see Fig. 7), for example, the VEP is frequently low in amplitude but normal in latency.102 On the other hand, delayed VEP responses are characteristic in demyelination of the optic nerve secondary to optic neuritis97 or compression.103 The lack of specificity in VEP abnormalities, however, is a major drawback in clinical assessment. Latency delays occur not only in demyelination, but also in neurotransmitter disorders,104 glaucoma,97,101 with uncorrected refractive error,105 with media opacities, and in normal human aging. Reduced VEP amplitude occurs regularly in all causes of optic atrophy, but also in amblyopia106 and with uncorrected refractive errors.105 Therefore, as a matter of course proper testing technique mandates that refractive correction be optimized for the testing distance and ocular causes of blurring be noted whenever recording the pattern VEP.

VEPs also have been used to evaluate disease affecting the chiasm, optic tract, and posterior visual pathway. In general, hemifield stimulation (i.e., presentation of the stimulus to one hemifield of one eye at a time) is required for proper topographic localization of chiasmal and retrochiasmal lesions. Although this procedure has been shown to be helpful, the hemifield technique requires that the patient maintain steady fixation. Patients who are able to perform this test usually can be tested at a perimeter, which provides more specific and useful information. Therefore, the technique of obtaining hemifield VEPs is of limited clinical value, especially when neuroimaging is far more productive.

Pattern VEPs are used to evaluate the visual function of young children and infants by using a series of pattern stimuli with different component (e.g., check or stripe) sizes. Various investigators have demonstrated methods of estimating visual acuity, color vision, stereopsi, and other parameters in preverbal children. Amblyopia may be diagnosed, and other developmental conditions of childhood that compromise vision can be followed and effects of therapy monitored. The interested reader is directed to the appropriate bibliographic references for description of techniques and protocols.107,108

More relevant to neuro-ophthalmology, VEPs can be used to document normal responses in patients with feigned or hysterical visual loss. Although it is possible to avoid looking at or focusing on the pattern stimulus, many patients fail to realize that responses to a pattern consisting of small checks or stripes is evidence of good visual acuity. Normal VEPs to pattern stimuli are not absolute guarantees of good central visual function, but there are very few instances when normal VEPs to small- and medium-size checks are associated with markedly decreased visual acuity and these must always be central, usually involving higher order cognitive processing or disconnection syndromes. Thus, a normal VEP should support or, at least, raise suspicion of nonphysiologic visual loss in patients claiming to have reduced visual acuity. Of course, an abnormal VEP does not necessarily imply physiologic visual impairment because a variety of technical problems and patient inattention or avoidance can degrade the VEP waveform.

Multifocal Visual Evoked Potentials

The multifocal technique of stimulating an array of retinal elements centered on the fovea that was originally introduced to obtain mfERGs has been applied to generate VEPs simultaneously from multiple locations (typically 60) across the central visual field.109,110 The stimulus used is a scaled, dart board display. Each of the 60 sectors has a miniature checkerboard pattern, consisting of 16 black and white checks that reverse in a pseudorandom sequence, similar to the sequence of individual stimuli used for the mfERG. Waveforms are generated for each sector of the dart board display and the software calculates probability plots that are analgous to the total deviation probability plot of the Humphrey VFA. The multifocal VEP has been shown to be a sensitive way of detecting ganglion cell damage early in the course of glaucoma and in other optic nerve and inner retinal disease.109 However, comparisons with static automated perimetry tests have shown mixed results, as the mfVEP has been shown to miss defects that are detected by perimetry, as well detecting damage that is missed on visual field testing.110 The application and utility of the mfVEP in neuro-ophthalmology, including ruling out nonorganic visual loss, diagnosing and following patients with optic neuritis, evaluating patients with unreliable or questionable visual fields, and following disease progression, as well as its limitations has been reviewed by Hood et al111 These authors also show how the combined use of the mfERG and mfVEP, can distinguish macular disease involving the outer retina from diseases of the ganglion cells or optic nerve that produce similar visual field defects. Thus, the mfVEP is a promising technique for the evaluation of ganglion cell function, but its uncertain reliability and the skill required to record and analyze the responses make its ultimate application and usefulness unproved.109–111

Back to Top
REFERENCES

1. Livingstone MS, Hubel DH: Psychophysical evidence for separate channels for theperception of form, color, movement and depth. J Neurosci 7:3416, 1987

2. Schiller PH, Logothetis NK, Charles ER: Role of the color-opponent and broad-band channels in vision. Vis Neurosci 5:321, 1990

3. Van Essen DC, Anderson CH, Fellman DJ: Information processing in the primate visual system: An integrated systems perspective. Science 255:419, 1992

4. Merigan WH, Maunsell JHR: How parallel are the primate visual pathways? Ann Rev Neurosci 16:369, 1993

5. Panda-Jonas S, Jonas JB, Jacobczyk M, Schneider U: Retinal photoreceptor count, retinal surface area, and optic disc size in normal human eyes. Ophthalmology 101:519, 1994

6. Schiller PH, Sandell JH, Maunsell JH: Functions of the ON and OFF channels of the visual system. Nature 322:824, 1986

7. Masland RH: The functional architecture of the retina. Sci Am 254:102, 1986

8. Drasdo N: Receptive field densities of the ganglion cells of the human retina. Vision Res 29:985, 1989

9. Curcio CA, Allen KA: Topography of ganglion cells in human retina. J Comp Neurol 300:5, 1990

10. D'Zmura M, Lennie P: Shared pathways for rod and cone vision. Vision Res 26:1273, 1986

11. Rovamo J, Raninen A: Cortical acuity and the luminous flux collected by retinal ganglion cells at various eccentricities in human rod and cone vision. Vision Res 30:11, 1990

12. Ransom-Hogg A, Spillmann L: Perceptive field size in fovea and periphery of the light and dark adapted retina. Vision Res 20:221, 1980

13. Crook JM, Lange-Malecki B, Lee BB, Valberg A: Visual resolution of macaque retinal ganglion cells. J Physiol 396:205, 1988

14. Gao H, Hollyfield JG: Aging of human retina. Invest Ophthalmol Vis Sci 33:1, 1992

15. Bishop PO: Processing of visual information within the retinostriate system. In Darian-Smith I (ed): Handbook of Physiology. Bethesda, MD: American Physiological Society, 1984

16. Silveira LC, Perry VH: The topography of magnocellular projecting ganglion cells (M-ganglion cells) in the primate retina. Neuroscience 40:217, 1991

17. Schiller PH: The On and Off channels of the visual system. In Cohen B, Bodis-Wollner I (eds). Vision and the Brain. The organization of the central visual system. New York, Raven Press, 1990

18. Shapley R, Perry VH: Cat and monkey retinal ganglion cells and their visual functional roles. TINS May:229, 1986

19. Derrington AM, Lennie P: Spatial and temporal contrast sensitivities of neurones in lateral geniculate nucleus of macaque. J Physiol (Lond) 357:219, 1984

20. Brannan JR, Bodis-Wollner I: Evidence for two systems mediating perceived contrast. Vision Neurosci 6:587, 1991

21. Purpura K, Kaplan E, Shapley RM: Background light and the contrast gain of primate P and M retinal ganglion cells. Proc Natl Acad Sci USA 85:4534, 1988

22. Evers HU, Gouras P: Three cone mechanisms in the primate electroretinogram: Two with, one without off-center bipolar responses. Vision Res 2:245, 1986

23. Merigan W, Katz LM, Maunsell JHR: The effects of parvocellular lateral geniculate lesions on the acuity and contrast sensitivity of macaque monkeys. J Neurosci 11:994, 1991

24. Wall M: Loss of P retinal ganglion cell function in resolved optic neuritis. Neurology 40:649, 1990

25. Chaturvedi N, Hedley-Whyte ED, Dreyer EB: Lateral geniculate nucleus in glaucoma. Am J Ophthalmol 116:182, 1993

26. Kolb H: Anatomical pathways for color vision in the human retina. Vis Neurosci 7:61, 1991

27. Horton JC, Hoyt WF: The representation of the visual field in human striate cortex: a revision of classical Holmes map. Arch Ophthalmol 109:816, 1991

28. Wood JM, Wild JM, Drasdo N, Crews SJ: Perimetric profiles and cortical representation. Ophthalmic Res 18:301, 1986

29. Helmholtz H: Handbuch der physiologischen Optik. Leipzig: Leopold Voss, 1867

30. Frisen L: Visual acuity and visual field tests: Psychophysical versus pathophysical objectives. In Kennard C, Clifford-Rose F (eds). Physiological Aspects of Clinical Neuro-Ophthalmology. Chicago: Year Book, 1988

31. Johnson CA: Evaluation of Visual Function. In Tasman W, Jaeger EA (eds). Foundations of Clinical Ophthalmology. Philadelphia: Lippincott-Raven, 1995

32. Campbell FW, Green DG: Optical and retinal factors affecting visual resolution. J Physiol (Lond) 181:576, 1965

33. Westheimer G: Visual acuity. In Hart WM (ed). Adler's Physiology of the Eye. St. Louis: Mosby Year Book, 1992

34. Hart WMJ: Visual adaptation. In Hart WM (ed). Adler's Physiology of the Eye. St. Louis: Mosby Year Book, 1992

35. Rea MS: Some basic concepts and field applications for lighting, color and vision. In Nadler PM, Miller D, Nadler DJ (eds). Glare and Contrast Sensitivity for Clinicians. New York, Berlin: Springer-Verlag, 1990

36. Flom MC, Weymouth FW, Kahneman D: Visual resolution and contour interaction. J Opt Soc Am 1026, 1963

37. Bailey IV, Lovie JE: New design principles for visual acuity letter charts. Am J Opt Physiol Opt 53:740, 1976

38. Ferris FL, Kassof A, Bresnick GH, Bailey IL: New visual acuity charts for clinical research. Am J Ophthalmol 94:91, 1982

39. Pelli DG, Robson JG, Wilkins AJ: The design of a new letter chart for measuring contrast sensitivity. Clin Vision Sci 2:187, 1988

40. Regan D, Neima D: Low contrast letter charts as a test of visual function. Ophthalmology 90:1192, 1983

41. Frisén L, Frisén M: How good is normal visual acuity? Graefes Arch Clin Exp Ophthalmol 215:149, 1981

42. Adams AJ, Verdon WA, Spivey BE: Color vision. In Duane's Foundations of Clinical Ophthalmology. Philadelphia: Lippincott-Raven, 1995:1

43. Wald G: The receptors of human color vision. Science 145:1007, 1964

44. Engel S, Zhang X, Wandell B: Colour tuning in human visual cortex measured with functional magnetic resonance imaging. Nature 388:68, 1997

45. Kollner H: Die Stoungen des Farbensinnes. Ihre Klinische Bedeutung und ihre Diagnose. Berlin: Karger, 1912

46. Safran AB, Kline LB, Glaser JS: Positive visual phenomena in optic nerve and chiasm disease: Photopsia and photophobia. In Neuro-Ophthalmology. St. Louis: Mosby, 1980:225

47. Pelli DG, Robson JG: Are letters better than gratings? Clin Vis Sci 6:409, 1991

48. Ginsberg AP: A new contrast sensitivity vision test chart. Am J Opt Physiol Opt 61:403, 1984

49. Rubin GS: Reliability and sensitivity of clinical contrast sensitivity tests. Clin Vis Sci 2:169, 1988

50. Trobe JD, Beck RW, Moke PS, Cleary PA: Contrast sensitivity and other vision tests in the Optic Neuritis Treatment Trial. Am J Ophthalmol 121:547, 1996

51. Bassi CJ, Galanis JC, Hoffman J: Comparison of the Farnsworth-Munsell 100-hue, the Farnsworth D-15, and the L'Anthony D-15 desaturated color tests. Arch Ophthalmol 111:639, 1993

52. Nichols BE, Thompson HS, Stone EM: Evaluation of a significantly shorter version of the Farnsworth-Munsell 100-hue tests in patients with three different optic neuropathies. J Neuro-ophthalmol 17:1, 1977

53. Glaser JS, Savino PJ, Sumers KD: The photostress recovery test: A practical adjunct in the clinical assessment of visual function. Am J Ophthalmol 83:255, 1977

54. Wu G, Weiter JJ, Santos S, Ginsburg L, Villalobos R: The macular photostress test in diabetic retinopathy and age-related macular degeneration. Arch Ophthalmol 108:1556,1990

55. Johnson LN: The relative afferent pupillary defect and a novel method of fusion recovery with the Worth 4-dot test. Arch Ophthalmol 114:171, 1996

56. von Noorden GK, Burian HM: Visual acuity in normal and amblyopic patients under reduced illumination. 1. Behavior of visual acuity with and without neutral density filter. Arch Ophthalmol 65:533, 1959

57. Turano K, Wong X: Motion thresholds in retinitis pigmentosa. Invest Ophthalmol Vis Sci 33:2411, 1992

58. Trick GL, Steinman SB, Amyot M: Motion perception deficits in glaucomatous optic neuropathy. Vision Res 35:2225, 1995

59. Trick GL, Silverman SE: Motion perception deficits in aging and senile dementia of the Alzheimer's type (SDAT). Neurology 41:1437, 1991

60. Trick GL, Kaskie B, Steinman SB: Visual dysfunction in Parkinson's disease: Deficits in orientation and motion perception. Opt Vis Sci 71:242, 1994

61. Silverman SE, Tran DB, Zimmerman KM, Feldon SE: Dissociation between the detection and perception of motion in Alzheimer's disease. Neurology 44:1814, 1994

62. Scott GI: Traquair's Clinical Perimetry. London: Henry Kimpton, 1957

63. Wall M, Sadun AA: Threshold Amsler grid testing: Cross-polarizing lenses enhance yield. Arch Ophthalmol 104:520, 1986

64. Safran AB, Glaser JS: Stato-kinetic dissociation in lesions of the anterior visual pathways: a reappraisal of the Riddoch phenomenon. Arch Ophthalmol 98:291, 1980

65. Egge K: The visual field in nrmal subjects. Acta Ophthalmol Suppl (Copenh) 169:1, 1984

66. Johnson CA, Chauhan B, Shapiro LR: Properties of staircase procedures for estimating thresholds in automated perimetry. Invest Ophthalmol Vis Sci 33:2966, 1992

67. Bengtsson B, Heijl A, Olsson J: Evaluation of a new threshold visual field strategy, SITA, in normal subjects. Acta Ophthalmol Scand 76:165, 1998

68. Trope GE, Britton R: A comparison of Goldmann and Humphrey automated perimetry in patients with glaucoma. Br J Ophthalmol 71:489, 1987

69. Beck RW, Bergstrom TJ, Lichter PR: A clinical comparison of visual field testing with a new automated perimeter, the Humphrey Field Analyzer, and the Goldmann perimeter. Ophthalmology 92:77-82, 1985

70. Wall M, Steven G, Punke SG, et al: SITA standard in optic neuropathies and hemianopias: A comparison with full threshold testing. Invest Ophthalmol Vis Sci 42:528, 2001

71. Sekhar GC, Naduvilath TJ, Lakkai M, et al: Sensitivity of Swedish Interactive Threshold Algorithm compared with standard full threshold algorithm in Humphrey visual field testing. Ophthalmology 107:1303, 2000

72. Johnson CA: Modern developments in clinical perimetry. Curr Opin Ophthalmol 4: 7, 1993

73. Racette L, Sample PA: Short-wavelength automated perimetry. Ophthalmol Clin North Am 16:227, 2003

74. Johnson CA, Adams AJ, Casson EJ, Brandt JD: Progression of early glaucomatous visual field loss as detected by blue-on-yellow and standard white-on-white automated perimetry. Arch Ophthalmol 111:651, 1993

75. Johnson CA, Adams AJ, Casson EJ, Brandt JD: Blue-on yellow perimetry can predict the development of glaucomatous visual field loss. Arch Ophthalmol 111: 645, 1993

76. Kwon YH, Park HJ, Jap A, Ugurlu S, Caprioli J: Test-retest variability of blue-on-yellow perimetry is greater than white-on-white perimetry in normal subjects. Am J Ophthalmol 126:29, 1998

77. Anderson AJ, Johnson CA: Frequency-doubling technology perimetry. Ophthalmol Clin North Am 16:213, 2003

78. Kelly DH: Nonlinear visual responses to flickering sinusoidal gratings. J Opt Soc Am 71:1051, 1981

79. Wall M, Neahring RK, Woodward KR: Sensitivity and specificity of frequency doubling perimetry in neuro-ophthalmic disorders: A comparison with conventional automated perimetry. Invest Ophthalmol Vis Sci 43:1277, 2002

80. Fujimoto N, Adachi-Usami E: Frequency doubling perimetry in resolved optic neuritis. Invest Ophthalmol Vis Sci 41:2558, 2000

81. Thomas D, Thomas R, Muliyil JP, George R: Role of frequency doubling perimetry in detecting neuro-ophthalmic visual field defects. Am J Ophthalmol. 131:734, 2001

82. Heijl A, Lindgren G, Olsson J, Asman P: Visual field interpretation with empiric probability maps. Arch Ophthalmol 107:204, 1989

83. Katz J, Sommer A: Screening for glaucomatous visual field loss. The effect of patient reliability. Ophthalmology 97:1032, 1990

84. Katz J, Sommer A: Reliability indexes of automated perimetric tests. Arch Ophthalmol 106:1252, 1988

85. Bickler-Bluth M, Trick GL, Koflker AE, Cooper DG: Assessing the utility of reliability indices for automated visual fields. Testing ocular hypertensives [see comments]. Ophthalmology 96:616, 1989

86. Flammer J: The concept of visual field indices. Graefes Arch Clin Exp Ophthalmol 224:389, 1986

87. Marmor MF, Zrenner E: Standard for clinical electroretinography (1999 update). Doc Ophthalmol 97:143, 1998

88. Marmor MF, Hood DC, Keating D, et al: Guidelines for basic multifocal electroretinography (mfERG). Doc Ophthalmol 106:105, 2003

89. Bach M, Hawlina M, Holder GE, et al: Standard for pattern electroretinography. Doc Ophthalmol 101:11, 2000

90. Fish GE, Birch DG: The focal electroretinogram in the clinical assessment of macular disease. Ophthalmology 96:109, 1989

91. Sandberg M, Baruzzi C, Berson E: Foveal cone ERGs in optic neuropathy. Invest Ophthalmol Vis Sci 27(suppl):104, 1986

92. Hood DC, Odel JG, Chen CS, Winn BJ: The multifocal electroretinogram. J Neuro-ophthalmol 23:225, 2003

93. Piao CH, Kondo M, Tanikawa A, et al: Multifocal electroretinogram in occult macular dystrophy. Invest Ophthalmol Vis Sci 41:513, 2000

94. Hood DC, Greenstein V, Frishman L, et al: Identifying inner retinal contributions to the human multifocal ERG. Vis Res 39:2285, 1999

95. Hood DC, Greenstein VC, Holopigian K, et al: An attempt to detect glaucomatous damage to the inner retina with the multifocal ERG. Invest Opthalmol Vis Sci 41:1570, 2000

96. Maffei L, Fiorentini A: Electroretinographic responses to alternating gratings before and after transection of the optic nerve. Science 211:953, 1981

97. Bobak P, Bodis-Wollner I, Harnois C, et al: Pattern electroretinograms and visual evoked potentials in glaucoma and multiple sclerosis. Am J Ophthalmol 96:72, 1983

98. Ringens PJ, Vijfvinkel-Bruinenga S, Van Lith GHM: The pattern-elicited electroretinogram. 1. A tool in the early detection of glaucoma? Ophthalmologica 192:171, 1986

99. Barris M, Trick G, Bickler-Bluth M: Abnormal visual function in patients with early senile dementia of the Alzheimer's type (SDAT) revealed by retinal evoked potentials. Invest Ophthalmol Vis Sci (Suppl)28:432, 1988

100. Plant GT, Hess RF, Thomas SJ: The pattern evoked electroretinogram in optic neuritis. A combined psychophysical and electrophysiological study. Brain 109:469, 1986

101. Atkin A, Podos SM, Bodis-Wollner I: Abnormalities of the visual system in ocular hypertension and glaucoma: seeing beyond routine perimetry. In Glaucoma Update. Berlin: Springer-Verlag, 1983

102. Cox TA, Thompson HS, Hayreh SS, et al: Visual evoked potential and pupillary signs: A comparison in optic nerve disease. Arch Ophthalmol 100:1603, 1982

103. Halliday AM, Halliday E, Kriss A, et al: The pattern evoked potential in compression of the anterior visual pathways. Brain 99:357, 1976

104. Bodis-Wollner I, Yahr MD, Mylin L, et al: Dopamine deficiency and delayed visual evoked potentials in humans. AnnNeurol 11:478, 1982

105. Bobak P, Bodis-Wollner I, Guillory S: The effect of blur and contrast on VEP latency: Comparison between checks and sinusoidal grating patterns. Electroencephalogr Clin Neurophysiol 68:247, 1987

106. Sokol S, Bloom B: Visually evoked cortical responses of amblyopes to a spatially alternating stimulus. Invest Ophthalmol Vis Sci 12:936, 1973

107. Taylor MJ, McCulloch DL: Visual evoked potentials in infants and children. J Clin Neurophysiol 9:357, 1992

108. Fulton AB, Hartmann EE, Hansen RM: Electrophysiologic testing techniques for children. Doc Ophthalmol 71:341, 1989

109. Hood DC, Greenstein VC: The multifocal VEP and ganglion cell damage: Applications and limitations for the study of glaucoma. Prog Retin Eye Res 22:201, 2003

110. Hood DC, Theinprasiddhi P, Greenstein VC, et al: Detecting early to mild glaucomatous damage: a comparison of the multifocal VEP and automated perimetry. Invest Ophthalmol Vis Sci 45:492, 2004

111. Hood DC, Odel JG, Winn BJ: The multifocal visual evoked potential. J Neuroophthalmol 23:279, 2003

Back to Top