|
|
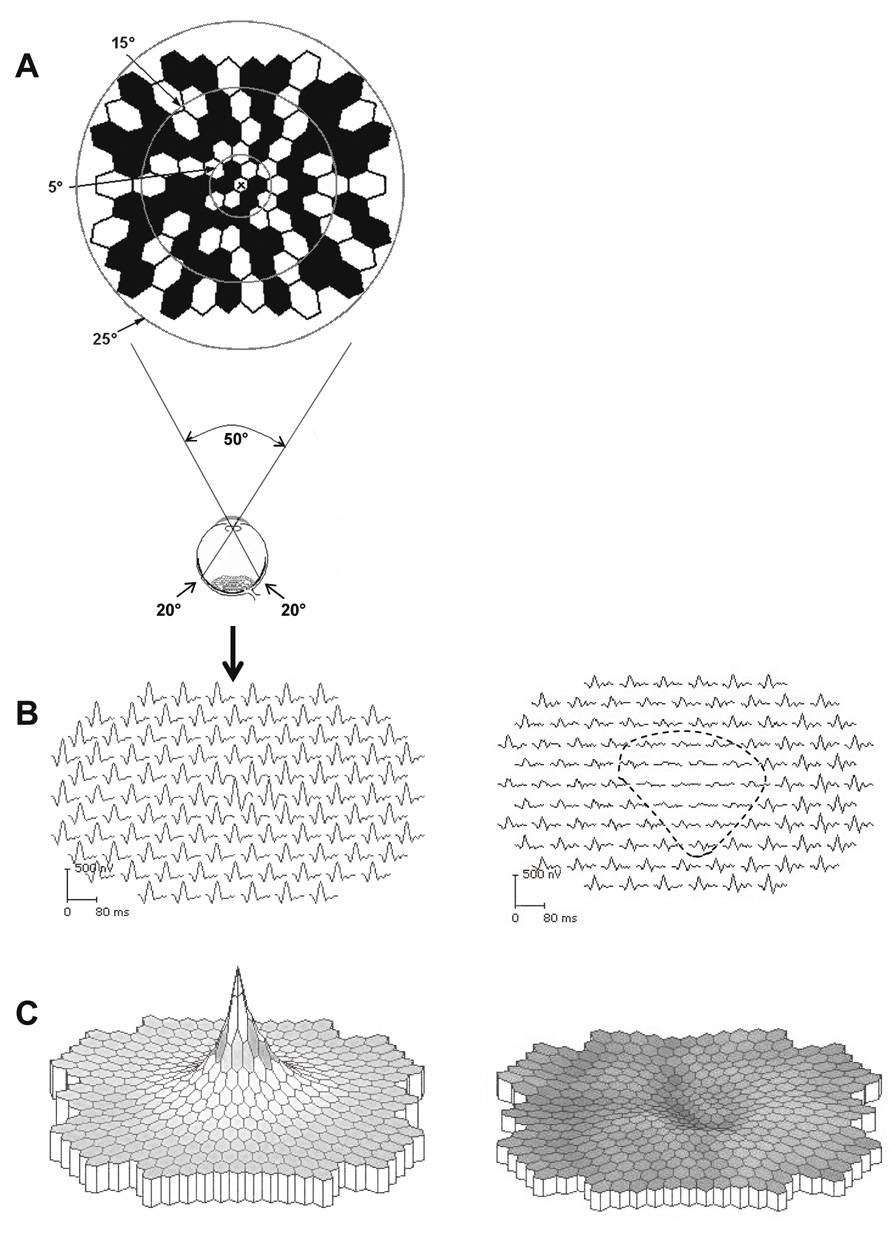
| Fig. 25. Multifocal electroretinogram (mfERG). A. The mfERG display (stimulus), an array of 103 black- and white-scaled hexagonal elements subtending approximately 50° at the eye, at one moment in time. Circles indicate radii of 5°, 15°, and 25°. A diagram of the eye illustrates area of retina, centered at the fovea and extending beyond the optic nerve that is stimulated by the display. B. Array of 103 mfERG response waveforms extracted from the activity recorded during stimulation; calibration bars represent amplitude and time. C. Three-dimensional mfERG density plot (in nV/mm2) derived from the responses in (B). B and C. Right panel: mfERG from a normal subject. Left panel: mfERG from the left eye of a 24-year-old man with congenital foveal hypoplasia and acuity of 20/80 in both eyes. Dashed line in (B) outlines the central area of markedly reduced mfERG amplitudes, also visible as a central depression of the density plot in (C). |