|
|
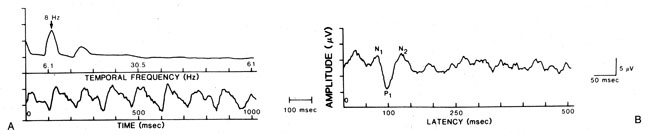
| Fig. 26. Pattern visual evoked potentials (PVEP). A. Steady-state response: the lower trace is steady-state sinusoidal waveform resulting from 4-Hz (eight pattern reversals per second) stimulation. The upper trace is Fourier transform indicating peak power at the second harmonic of the stimulus frequency (8 Hz). B. Transient response: the PVEP waveform resulting from 1 Hz stimulation. The major positive deflection (P1) occurs normally at about 100 msec after each stimulus. Vertical calibration bar represents the amplitude. Note that positive deflection is downward. |