Chapter 110
Indocyanine Green Videoangiography: Principles, Technique, and Complications
Christina M. Klais, Michael D. Ober, Nicole E. Gross, and Jason S. Slakter
Main Menu   Table Of Contents

Search

HISTORY
CHEMICAL PROPERTIES
OPTICAL PROPERTIES
PHARMACOKINETICS
TOXICITY
INJECTION TECHNIQUE
DIGITAL IMAGING SYSTEM
PHOTOGRAPHIC TECHNIQUE
NEW TECHNIQUES
CONCLUSIONS
REFERENCES

Since its introduction in the 1960s, intravenous fluorescein angiography has played a crucial role in the diagnosis and treatment of a variety of retinal diseases.1 It provides excellent spatial and temporal resolution of the retinal circulation with a high degree of fluorescence efficiency and minimal penetration of the retinal pigment epithelium (RPE). In most eyes, the melanin pigment within the RPE is sufficient to provide contrast for imaging intensely fluorescent retinal capillaries. Unfortunately, there are certain limitations to this technique, particularly with respect to imaging the choroidal circulation secondary to poor transmission of fluorescence through ocular media opacifications, fundus pigmentation, and pathologic manifestations such as serosanguineous fluid and lipid exudation.

The relatively poor fluorescence efficiency of the indocyanine green (ICG) molecule and its limited ability to produce high-resolution images on infrared film initially restricted its angiographic application; however, ICG has subsequently been found to have several advantages over sodium fluorescein, especially in imaging choroidal vasculature. The emergence of high-resolution infrared digital imaging systems, specifically designed for ICG and a growing awareness of choroidal vascular lesions, has led to a resurgence of interest in ICG angiography.2,3 The applications of ICG angiography continue to grow in number; the full extent of its capabilities is not yet known.

Back to Top
HISTORY
Initially used in the photographic industry, ICG was introduced into medicine in 1957.4 Its first application in medicine was in measuring cardiac output.5 ICG was later used as a method of measuring hepatic blood flow and function.6 In 1969, the first attempts at using ICG angiography were performed by Kogure and Choromokos studying cerebral circulation in a dog.7 The next year, Kogure et al. reported on intra-arterial ICG absorption of the choroid in monkeys.8 The first human ICG angiogram was of the carotid artery by David and collegues.9

In 1971, Hochheimer modified the system for ICG angiography by changing the color film that had been used previously to black-and-white infrared film.10 In 1972, Flower and Hochheimer performed the first intravenous ICG angiography to image the human choroid.11 In the next years, Flower and coworkers began a series of studies on primates and human to evaluate the potential usefulness of ICG angiography in the investigation of the normal and pathologic eye.12–15 They refined the procedure with recommendations for the concentration of the dye and method of injection. Flower also modified the transmission and emission filters to improve the resolution of the choroidal vessels. They eventually found that infrared film lacked the sensitivity to adequately capture low-intensity ICG fluorescence, which limited the clinical usefulness of ICG angiography.

The resolution of ICG angiography was improved in the mid 1980s by Hayashi and coworkers, who developed improved filter combinations with sufficient sensitivity for near-infrared wavelength.16 They were instrumental in the transition from film to videotape by introducing videoangiography.17–19 Although the sensitivity of the video camera system was a vast improvement, its inability to study individual images and the potential light toxicity using a 300-watt halogen bulb restricted the duration and quality of the technique.

In 1989, Destro and Puliafito performed ICG angiography with a system very similar to that described by Hayashi.20 Imaging was improved by better filter combinations, but images were still stored and later analyzed using videotape recording. In the same year, the use of scanning laser ophthalmoscope for ICG videoangiography was introduced by Scheider and Schroedel.21 In 1992, Guyer introduced the use of a 1024×1024-line digital imaging system to produce high-resolution ICG angiography.2 Images were digitized, displayed on a high-resolution monitor, and stored on an optical disc, but the system lacked flash synchronization with the video camera. Finally, Yannuzzi and coworkers described a 1024-line resolution system that was synthesized with the appropriate flash synchronization and image storage capability, permitting high-resolution, long-duration ICG angiography.3

Back to Top
CHEMICAL PROPERTIES
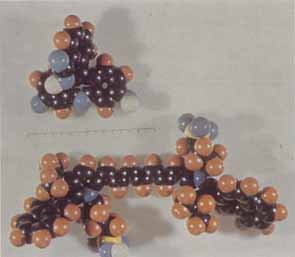
ICG is a sterile, water-soluble tricarbocyanine dye with the empirical formula C43H47N2NaO6S2and molecular weight of 775 daltons.14 Chemically, it is an anhydro-3,3,3',3'-tetramethyl-1-1'-di-(4-sulfobutyl)-4,5,4',5-dibenzoindotricyanine hydroxide sodium salt with both lipophilic and hydrophilic characteristics (Fig. 1).

Fig. 1 Structural model of sodium fluorescein (top) and indocyanine green (bottom) molecules. Although the indocyanine green (ICG) is somewhat larger than the fluorescein molecule, it is actually the high protein-binding efficiency to large molecules such as albumin that limits its leakage during ICG angiography.

ICG is the product of a complex, synthetic process. Sodium iodine is incorporated to create an ICG lyophilisate that can be dissolved in water. Once dissolved, ICG tends to precipitate at high concentration or when mixed in physiologic saline. It is supplied with a solvent consisting of sterile water at pH 5.5–6.5. The aqueous ICG dye solution can decay at a rate of approximately 10% in 10 hours and should be used within this time.22 The final product contains no more than 5% sodium iodine.

Back to Top
OPTICAL PROPERTIES
ICG absorbs light in the near-infrared range of 790 to 805 nm.23 The emission spectrum ranges from 770 to 880 nm, peaking at 835 nm. Both absorption and emission spectra are shifted toward shorter wavelength when ICG is in an aqueous solution, whereas the overall intensity of the fluorescence is diminished.

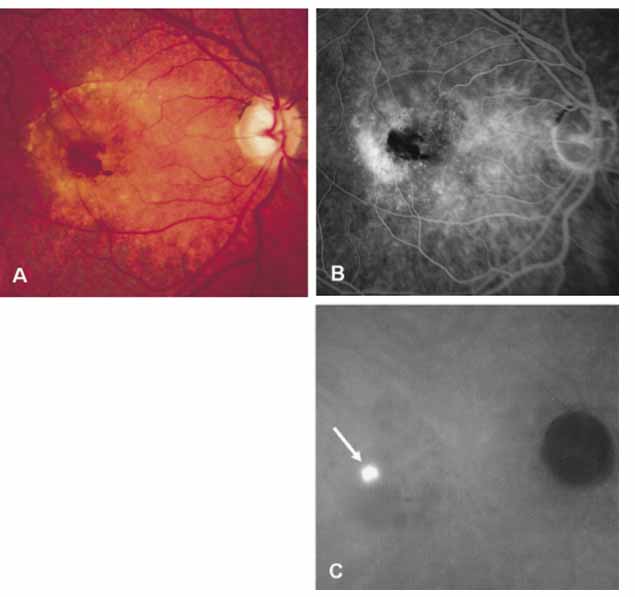
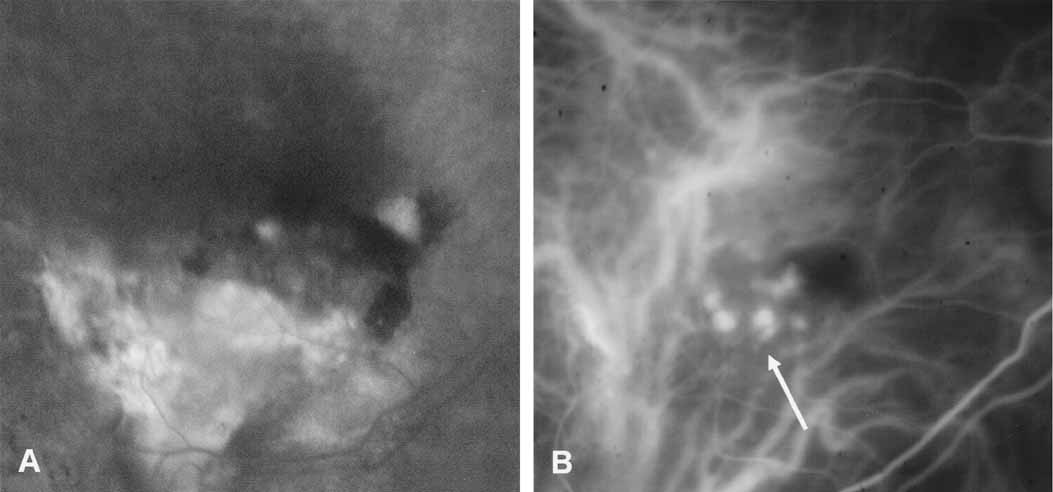
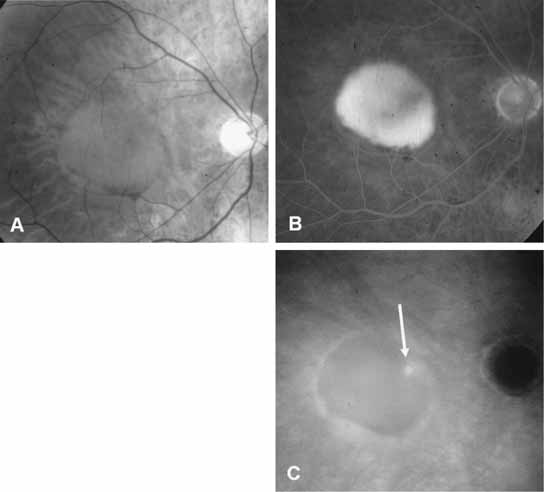
Whereas fundus photography and fluorescein angiography do not provide detailed images of the choroidal circulation, the physical characteristics of ICG allow for visualization of the dye through overlying melanin and xanthophyll.24 It has been demonstrated that the retinal pigment epithelium and choroid absorbs 59% to 75% of blue-green light (500 nm) used in fluorescein angiography, but only 21% to 38% of near-infrared light (800 nm) used in ICG angiography. The activity of ICG in the near-infrared light also allows visualization through serosanguineous fluid, shallow hemorrhage, pigment, and lipid exudate, which, even in small amounts, block visualization of sodium fluorescein (Fig. 2). Enhanced imaging of conditions such as choroidal neovascularization (Fig. 3) and pigment epithelium detachment is the result (Fig. 4).

Fig. 2 A, Clinical photograph demonstrates subretinal and intraretinal hemorrhages as well as detachment of the retinal pigment epithelium and the neurosensory retina in a patient with neovascular age-related macular degeneration. B, Late-phase fluorescein angiogram reveals blocked fluorescence from the hemorrhages and indistinct leakage. C, A late-phase ICG angiogram demonstrates a well-defined hyperfluorescence or so-called focal hot spot (arrow) representing a retinal angiomatous proliferation. This lesion is well visualized through the area of hemorrhage because of good penetration of the infrared light used in ICG angiography.

Fig. 3 A, Late-phase fluorescein angiogram demonstrates an area of blocked fluorescence and hyperfluorescence simulating an occult choroidal neovascularization. B, Mid-phase indocyanine green (ICG) angiogram reveals hot spots (arrow) representing polypoidal lesions.

Fig. 4 A, The red-free photograph of a patient with neovascular age-related macular degeneration shows a large pigment epithelium detachment (PED) in the central macula. B, Late-phase fluorescein angiogram demonstrates hyperfluorescence of the serous PED. No focal area of choroidal neovascularization can be identified. C, Late-phase indocyanine green (ICG) angiogram reveals a focal spot of hyperfluorescence (arrow) representing an area of localized choroidal neovascularization. The ICG molecule, which is 98% protein-bound, does not leak from the neovascular membrane, and the PED remains relatively hypofluorescent throughout the study.

Back to Top
PHARMACOKINETICS
In vivo, ICG is 98% protein-bound because it has lipophilic and hydrophilic properties. Although it was previously thought to bind primarily to serum albumin,25 80% of ICG molecules actually bind to globulins, such as A1-lipoprotein. Therefore, less dye escapes from the fenestrated choroidal vasculature, allowing enhanced imaging of choroidal vessels and choroidal lesions.23 This is in sharp contrast to fluorescein, which is a relatively small molecule that remains mostly unbound from protein and extravasates rapidly from the choriocapillaris and fluoresces in the extravascular space, thus preventing delineation of choroidal anatomy.

Originally, it was thought that the protein-binding capacity of ICG limited the travel within the choroidal vessel walls. However, it has been demonstrated that ICG dye diffuses through the choroidal stroma during angiography, accumulating within the retinal pigment epithelium cells. It diffuses slowly, staining the choroid within 12 minutes after injection.

The ICG dye is excreted by the liver.6 It is taken up by hepatic parenchymal cells and secreted into the bile without metabolic alteration or entering enterohepatic circulation.26,27 In healthy individuals, the rate of ICG disappearance from the vascular compartment is 18% to 24% per minute with a half-life of 2 to 4 minutes, after 20 minutes, no more than 4% of the initial concentration of the dye should remain in the serum.28 As a result of strong binding to plasma proteins, ICG is not detected in kidney, lungs, and cerebrospinal fluid,29,30 nor does it cross the placenta.31,32

Back to Top
TOXICITY
Indocyanine green is a relatively safe dye; adverse reaction are rare and less common than with sodium fluorescein.33,34 Mild reactions such as nausea, vomiting, and pruritus occur in 0.15% of patients.10 There have been isolated reports of vasovagal-type reactions, hypotensive shock, and anaphylactic shock.35 There are three reported death from ICG administration during cardiac catherization.22 The dose of ICG administered does not appear to correlate with the presence or severity of adverse reactions. Unlike sodium fluorescein, in which extravasation of dye may lead to local tissue reaction and even necrosis of the overlying skin,36 ICG extravasation is well-tolerated and resolves without complications.

Sterile ICG manufactured in the US contains small amounts of iodine and therefore should be used with caution in patients with iodine allergy. It should also be avoided in uremic patients and in those with liver disease in which delayed ICG clearance has been described.37 ICG has not been shown to be harmful to pregnant women or their fetus; however, it is classified as pregnancy category C because of lack of adequate studies. Therefore, there still exists reason for concern.31 Emergency equipment should always be on hand when ICG is administered.

Back to Top
INJECTION TECHNIQUE
Indocyanine green (IC Green; Akorn, Inc, Buffalo Grove, Illinois) should be dissolved in aqueous solvent supplied by the manufacturer and be used within 10 hours after preparation.28 The standard concentration is 25 mg of ICG dissolved in 5 mL solvent.38 In patients with poorly dilated pupils or heavily pigmented fundus, the dose of ICG may be increased to 50 mg. For wide-angle angiography, the dosage is increased to 75 mg. Rapid intravenous injection is essential and the injection may be immediately followed by a 5 mL saline flush.
Back to Top
DIGITAL IMAGING SYSTEM
An excitation filter placed over the light source allows only the passage of near-infrared light. This light is absorbed by the ICG molecules in the eye, which in turn emit slightly lower-energy light. A barrier filter is used to capture only this light emitted from ICG into the camera by blocking wavelength shorter than 825 nm.

Image acquisition can by produced by standard fundus camera, video camera, or scanning laser ophthalmoscope. The coupling of digital imaging system with an ICG camera enables production of high-resolution (1024-line) images necessary for ICG angiography.

Digital imaging systems contain electronic still and video cameras with special antireflective coatings as well as appropriate excitatory and barrier filters. A video camera is mounted in the camera viewfinder and it is connected to a video monitor. The photographer selects the image and activates a trigger, which sends the image to the video adapter. The charged coupling device (CCD) camera captures the images and transmits these digitized (1024×1024-line resolution) images to a video board within a computer-processing unit. Flash synchronization allows high-resolution image capture and images are displayed on a high-contrast, high-resolution video monitor.

Finally, via telecommunications, “satellite” viewing or reading stations can be placed in laser treatment facilities or in other offices. This permits direct viewing of the images on a high-resolution monitor to maximize information and to permit accurate localization of thermal laser treatment or photodynamic therapy (Fig. 5).

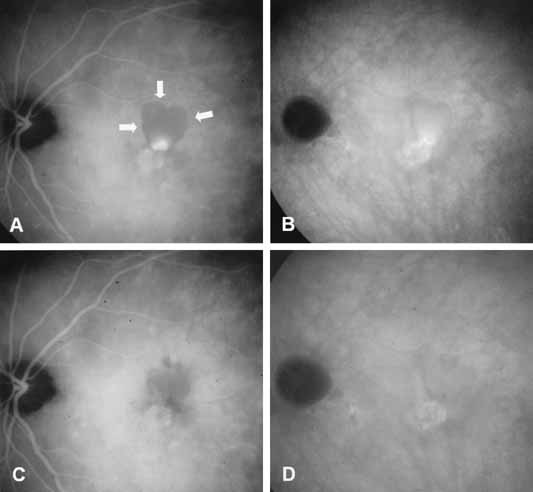
Fig. 5 A, Mid-phase indocyanine green (ICG) angiogram shows an area of hyperfluorescence surrounded by an area of hypofluorescence (arrows) in a patient with polypoidal choroidal vasculopathy representing a focal area of active neovascularization surrounded by pigment epithelium detachment (PED). B, Late-phase ICG reveals hyperfluorescence of the vascular network. C, D, The patient was treated with photodynamic therapy using verteporfin. C, Mid-phase and late-phase ICG angiograms, which were performed 5 months after treatment, demonstrate resolution of fluid, flattened PED, and no active leakage. D, There is some late staining from the vascular network in the late-phase ICG angiogram.

Back to Top
PHOTOGRAPHIC TECHNIQUE
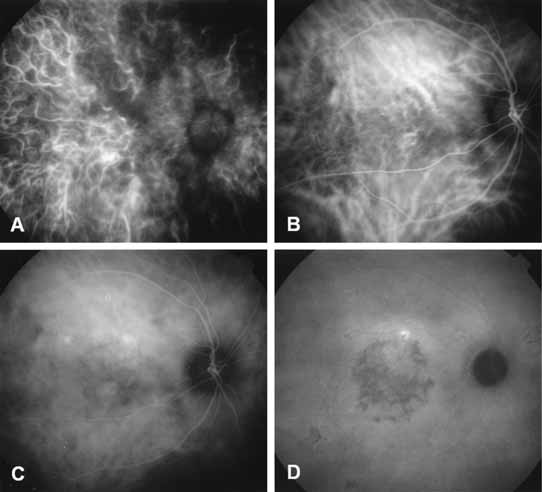
For the purpose of obtaining an ICG study, the imaging protocol typically begins with color, red-free, and “green-free” fundus photographs. ICG angiography can be performed before or after fluorescein angiography. Images are initially taken 8 to 10 seconds after injection of the dye (Fig. 6). This permits image capture in the early phase of choroidal filling. If the photographer waits until the dye is first noted on the alignment and focus monitor, the early phase of the study is often missed by the time the image capture is achieved. Images are obtained in a rapid, sequential manner at approximately 1-second intervals until retinal and choroidal circulations are at maximum brightness. The quality of the image exposure is continuously displayed on a high-resolution monitor, and modifications made to the image by adjusting the flash illumination control or gain setting. Initially, the gain must be set high to provide good illumination of the early choroidal filling phase, but reduction must be made immediately to compensate for the rapid influx of dye during the early retinal and larger choroidal filling phase.

Fig. 6 Representative phases of indocyanine green (ICG) angiographic study. A, Early filling of the choroidal arterial circulation. A band of hypofluorescence represents a watershed zone between the distribution of the posterior ciliary arteries. The choroidal arterial circulation has filled earlier than the retinal arterial circulation. B, Choroidal venous filling phase of the ICG study. Note the different pattern and distribution of the choroidal veins as opposed to the arteries noted in A. The retinal arterial and venous circulations are now filled. C, Mid-phase ICG angiogram demonstrates fading of the fluorescence of the larger choroidal vessels, as well as retinal vessel. D, Late-phase ICG angiogram is identified by the dark or hypofluorescent optic nerve and the shadowing of the larger choroidal vessels against the background of diffuse fluorescence caused by extravasation of ICG molecules into extravascular space within the choroid. The focal hyperfluorescence represents a focal leakage in a patient with chronic central serous chorioretinopathy. There is also diffuse decompensation of the retinal pigment epithelium and pigmentation in the central macula blocking the background fluorescence.

After the images are obtained at the point of maximal brightness, they are further captured at 1-minute intervals until 5 minutes into the study. Thereafter, images are obtained at 3- to 5-minute intervals for a total duration of 30 to 50 minutes. Typically, ICG images are captured until all of the dye has exited to the retinal circulation and the optic nerve appears dark in contrast to the generalized gray background of the choroidal region. During the course of the study, the gradual decrease in the concentration of ICG dye in the retinal and choroidal circulation requires a corresponding increase in the intensity of the flash illumination.

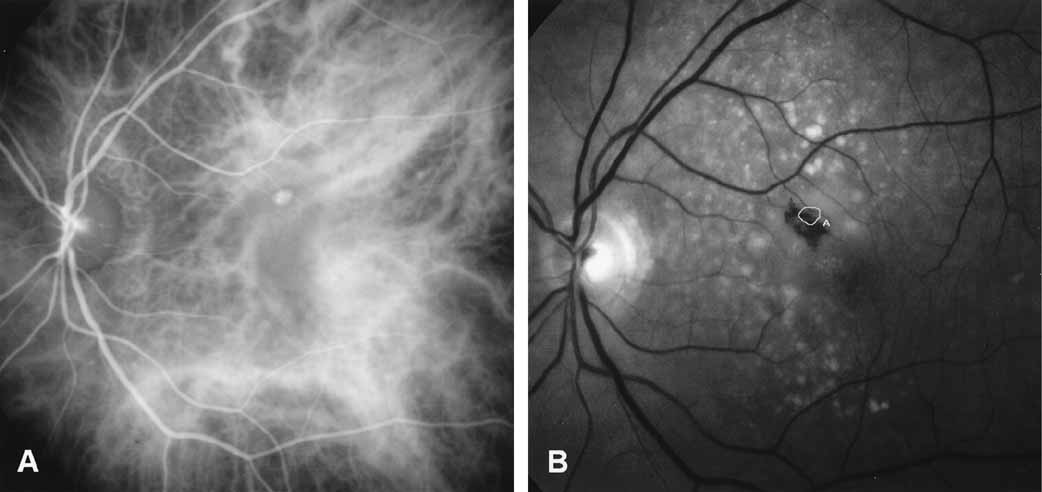
When the angiogram is complete, the photographer reviews the images obtained on the high-resolution monitor. Poorly focused, poorly aligned, or redundant information is deleted. Permanent storage is accomplished by downloading to a DVD, CD ROM, or local server. The stored, unenhanced images can then be manipulated with the available software for enhanced analysis. Images can be warped--a technique in which tracing of an image from the ICG study is overlaid onto the clinical or red-free photograph or fluorescein angiographic image to permit accurate localization of pathology (Fig. 7).

Fig. 7 A, Mid-phase indocyanine green (ICG) angiogram demonstrates a focal spot of hyperfluorescence representing an area of intraretinal neovascularization in a patient with retinal angiomatous proliferation. Identification of this lesion would be difficult with ICG study alone. The software capabilities of the digitized system can be used to allow this image to be warped and overlayed over a red-free image. B, A tracing of the outline of the hyperfluorescent lesion can be superimposed on the red-free photograph. This overlay tracing provides good landmarks to permit accurate localization if photocoagulation is performed.

Back to Top
NEW TECHNIQUES
Recent advances in the technology associated with ICG angiography include real-time, wide-angle,39 digital subtraction,40 and high-speed angiography.21,41

Real-time ICG angiography uses a modified fundus camera with a diode laser illumination system that has an output at 805 nm. This system captures images at 30 frames per second and thus allows for continuous recording. Single frames can be digitized, but the resolution is limited to 640×480 pixels.

Wide-angle ICG angiography is achieved with the use of a wide-angle contact lens. Because the lens produces an image lying approximately 1 cm in front of the lens, the fundus camera is set on “A” or “+” to focus on the image plan of the contact lens. This system allows instantaneous imaging of a large fundus area up to 160 degrees of field.39

Digital subtraction ICG angiography uses software to eliminate static fluorescence in sequentially acquired images and demonstrates the progression of the dye front within the choroidal circulation. Pseudocolor imaging of the choroid allows differentiation and identification of choroidal arteries and veins. This technique allows imaging of occult choroidal neovascularization with greater detail and in a shorter period of time than with conventional ICG angiography.40

A fundamental problem for any kind of fundus imaging is reflection from interfaces of the ocular media. To obtain high-quality fundus images, these reflections must be eliminated. This is achieved by confocal scanning laser ophthalmoscopy (SLO), which separates the illuminating and the imaging beam in the eye, and can be used for high-speed ICG angiography.42 The SLO can acquire fluorescein angiography images using an argon laser (488 nm), ICG images using an infrared diode laser (795 nm), simultaneous fluorescein angiography and ICG angiography, autofluorescence images, normal fundus reflectance images with green light (514 nm), and images of the nerve fiber layer with infrared light (830 nm). Barrier filters at 500 nm and 810 nm are added to provide a greater efficiency of fluorescent light detection. Single images can be acquired, as well as image sequences with a frame rate up to 30 images per second. Images are digitized in real-time with a resolution of 256×256 or 512×512 pixels. The scanning laser system is able to record the filling phase with great temporal resolution but with a slight loss of spatial resolution.

Recently, three-dimensional confocal angiography has been reported.43 This system allows for the potential to achieve reliable quantitative and qualitative analysis of defects, exudation, and proliferative vascular lesion.

Back to Top
CONCLUSIONS
Indocyanine green angiography is a highly specialized technique for imaging choroidal vasculature. It has several advantages over fluorescein angiography, including lower toxicity, high protein-binding affinity, and infrared fluorescence for better penetration through pigment, serosanguineous fluid, and blood. The clinical applications of ICG angiography continue to expand as more experience is gained with current imaging techniques. Further advances in ICG angiography are likely to result from the newer high-speed imaging systems.
Back to Top
REFERENCES

1. Schatz HS, Burton T, Yannuzzi LA, Rabb MF: Interpretation of fundus fluorescein angiography. St. Louis: Mosby-Year Book, 1978

2. Guyer DR, Puliafito CP, Mones JM, et al: Digital indocyanine green angiography in chorioretinal disorders. Ophthalmology 99:287–291, 1992

3. Yannuzzi LA, Slakter JS, Sorenson JA, et al: Digital indocyanine green videoangiography and choroidal neovascularization. Retina 12:191–223, 1992

4. Fox JJ, Brooker L, Heselstine D, et al: A tricarbocyanine dye for continuous recording of dilution curves in the whole blood independent of variations in blood oxygen saturation. Proc Staff Meeting Mayo Clinic 32:478–484, 1957

5. Fox JJ, Wood EH: Application of dilution curves recorded from the right side of the heart or venous circulation with the aid of a new indicator dye. Proc Mayo Clin 32:541, 1957

6. Caesar J, Sheldon S, Chianduss L, et al: The use of indocyanine green in the measurement of hepatic blood flow and as a test for hepatic function. Clin Sci 21:43–57, 1961

7. Kogure K, Choromokos E: Infrared absorption angiography. J Appl Physiol 26:154–157, 1969

8. Kogure K, David NJ, Yamanouchi U, Choromokos E: Infrared absorption angiography of the fundus circulation. Arch Ophthalmol 83:209–214, 1970

9. David NJ: Infrared absorption angiography. In: Proceedings of the International Symposium on Fluorescein Angiography. Albi, Basel: Karger, 1969:189–195

10. Hochheimer BF: Angiography of the retina with indocyanine green. Arch Ophthalmol 86:564–565, 1971

11. Flower RW, Hochheimer BF: Letter to the editor: Clinical infrared absorption angiography of the choroid. Am J Ophthalmol 73:458–459, 1972

12. Flower RW: Infrared absorption angiography of the choroid and some observations on the effects of high intraocular pressures. Am J Ophthalmol 74:600–614, 1972

13. Flower RW, Hochheimer F: A clinical technique and apparatus for simultaneous angiography of the separate retinal and choroidal circulations. Invest Ophthalmol Vis Sci 12:248–261, 1973

14. Patz A, Flower RW, Klein mL, et al: Clinical applications of indocyanine green angiography. Doc Ophthalmol Proc Series 9:245–251, 1976

15. Hyvarinen L, Flower RW: Indocyanine green fluorescence angiography. Arch Ophthalmol 58:528–538, 1980

16. Hayashi K, DeLaey JJ: Indocyanine green angiography of neovascular membranes. Ophthalmologica 190:20–29, 1985

17. Hayashi K, Hasegawa Y, Tokoro T: Indocyanine green angiography of central serous chorioretinopathy. Int Ophthalmol 9:37–41, 1986

18. Hayashi K, Hasegawa Y, Tokoro T, DeLaey JJ: Clinical use of indocyanine green angiography in the diagnosis of choroidal neovascular disease. Fortschr Ophthalmol 85:410–412, 1988

19. Hayashi K, Hasegawa Y, Tokoro T, DeLaey JJ: Clinical application of indocyanine green angiography to choroidal neovascularization. Jpn J Ophthalmol 33:57–65, 1989

20. Destro M, Puliafito CA: Indocyanine green videoangiography of choroidal neovascularization. Ophthalmology 96:846–453, 1989

21. Scheider A, Schroedel C: High resolution indocyanine green angiography with scanning laser ophthalmolscope. Am J Ophthalmol 108:458–459, 1989

22. Flower RW, Yannuzzi LA, Slakter JS: Indocyanine green angiography. In: Yannuzzi LA, Flower RW, Slakter JS, eds. St. Louis: Mosby-Year Book, 1997:2–17

23. Baker KJ: Binding of sulfobromoophthalein (BSP) sodium and indocyanine green (ICG) by plasma ?1-lipoproteins. Proc Soc Exp Biol Med 122:957–963, 1966

24. Geeraets WJ, Berry ER: Ocular spectral characteristics as related to hazards from lasers and other light sources. Am J Ophthalmol 66:15–20, 1968

25. Cherrick GR, Stein SW, Leevy CM, et al: Indocyanine green: observations on ist physical properties, plasma decay, and hepatic extraction. J Clin Invest 39:592–596, 1960

26. Goresky CA: Initial distribution and rate of uptake of sulfobromophthalein in the liver. Am J Physiol 207:13–17, 1964

27. Levy CM, Bender J, Silverberg M, et al: Physiology of dye extraction by the liver: comparative studies of sulfobromoophthalein and indocyanine green. Ann N Y Acad Sci 111:161–163, 1963

28. Hope-Ross MW: ICG dye: physical and pharmacological properties. In: Yannuzzi LA, Flower RW, Slakter JS, eds. Indocyanine green angiography. St. Louis: Mosby-Year Book, 46–49, 1997

29. Ketterer SG, Wiengand BD: Hepatic clearance of indocyanine green. Clin Res 7:289–292, 1959

30. Ketterer SG, Wiengand BD: The excretion of indocyanine green and its use in the estimation of hepatic blood flow. Clin Res 7:71–75, 1959

31. Probst P, Praumgartner G, Gaucig H, Froehlich H, Grabner GP: Studies on clearance and placental transfer of indocyanine green during labor. Clin Chim Acta 29:157–160, 1970

32. Fineman MS, Maguire JI, Benson WE, et al: Safety of indocyanine green angiography during pregnancy. Arch Ophthalmol 119:353–355, 2001

33. Bischoff PR, Flower RW: Ten years experience with choroidal angiography using indocyanine green dye: a new routine examination or an epilogue? Doc Ophthalmol 60:235–291, 1985

34. Levy CM, Smith K, Kiesman T:.Liver function test. In: Bockus HL, ed. Gastroenterology, 3rd ed, vol 2. Philadelphia: WB Saunders, 1976: 248–255

35. Hope-Ross M, Yannuzzi LA, Gragoudas ES, et al: Adverse reactions to indocyanine green. Ophthalmology 101:529–535, 1994

36. Yannuzzi LA, Rohrer KT, Tindel LJ, et al: Fluorescein angiography complication survey. Ophthalmology 93:611–617, 1986

37. Costa DLL, Huang SA, Orlock DA: Retinal choroidal indocyanine green dye clearance and liver dysfunction. Retina 23:557–561, 2003

38. Stango PE, Lim JI, Hamilton P: Indocyanine green angiography in chorioretinal disease: Indications. An evidence-based update. Ophthalmology 110:15–24, 2003

39. Spaide RF, Orlock DA, Herman-Delamazure B, et al: Wide-angle indocyanine green angiography. Retina 18:44–49, 1998

40. Spaide RF, Orlock DA, Yannuzzi LA, et al: Digital substraction indocyanine angiography of occult choroidal neovascularization. Ophthalmology 105:680–688, 1998

41. Flower RW: Extraction of choroidocapillaris hemodynamic data from ICG fluorescence angiograms. Invest Ophthalmol Vis Sci 34:2720–2729, 1993

42. Webb RH, Hughes GW, Delori FC: Confocal scanning laser ophthalmoscope. Applied Optics 26:1492–1499, 1987

43. Teschner S, Noack J, Birngruber R, Schmidt-Erfurth U: Characterization of leakage activity in exudative chorioretinal disease with three-dimensional confocal angiography. Ophthalmology 110:687–697, 2003

Back to Top