RETINA Central Serous Chorioretinopathy Central serous chorioretinopathy (CSCR) is characterized by detachment(s) of
the neurosensory retina caused by one or more focal leaks at the
level of the RPE. When small or shallow, these serous detachments may
be difficult to detect clinically. OCT images of such areas demonstrate
elevation of neurosensory retina by the presence of subretinal fluid.12 The well-defined contrast in optical reflectivity between the nonreflective
serous fluid and the more highly reflective posterior boundary of
the neurosensory retina allows OCT images to be highly sensitive to
even small neurosensory detachments. Indeed, OCT images may show the presence
of neurosensory detachments not detectable by clinical examination. The
ability of OCT to image the same retinal area on subsequent
visits allows for the longitudinal monitoring of the clinical course of
the serous detachment in this disease (Figs. 2 and 3). OCT is particularly useful when thisdisease presents in older patients. The
presence of drusen and pigmentary changes in these patients may
lead to the erroneous conclusion that a choroidal neovascular complex
is the cause of the neurosensory detachment. OCT may be able to provide
additional diagnostic information in these patients by excluding the
existence of a choroidal neovascular membrane or abnormalities in the
choriocapillaris/RPE layer. 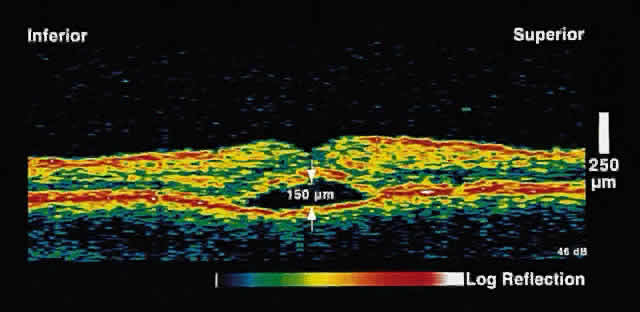 Fig. 2. OCT image shows a neurosensory detachment secondary to central serous chorioretinopathy. The
difference in optical reflectivity between the posterior
boundary of the neurosensory retina and the underlying serous
fluid allows even small areas of elevation to be detected. Fig. 2. OCT image shows a neurosensory detachment secondary to central serous chorioretinopathy. The
difference in optical reflectivity between the posterior
boundary of the neurosensory retina and the underlying serous
fluid allows even small areas of elevation to be detected.
|
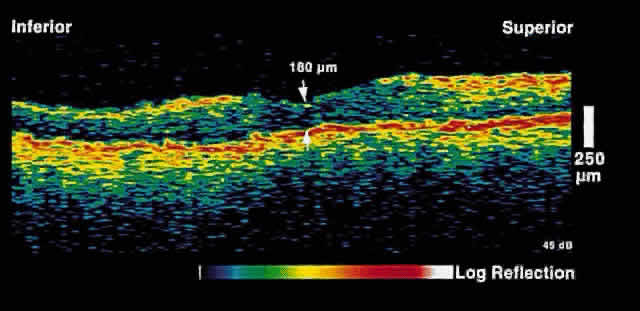 Fig. 3. Several weeks later, an OCT taken through the same area reveals partial
resolution of the neurosensory detachment. Fig. 3. Several weeks later, an OCT taken through the same area reveals partial
resolution of the neurosensory detachment.
|
Serous Macular Detachment Secondary to Optic Nerve Pit Optical coherence tomography images of this clinical entity clearly demonstrate
the relation between the optic nerve pit and serous macular detachment (Fig. 4). These images support the concept that fluid from the optic pit directly
enters the neurosensory retina and not the subretinal space.13 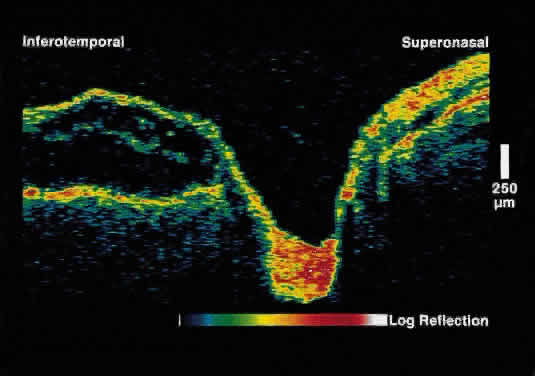 Fig. 4. OCT image through macula and optic disc in a patient with an optic nerve
head pit. The optic pit is contiguous with a schisis-like cavity in
the inner retina and not with the subretinal space. Fig. 4. OCT image through macula and optic disc in a patient with an optic nerve
head pit. The optic pit is contiguous with a schisis-like cavity in
the inner retina and not with the subretinal space.
|
Macular Edema Optical coherence tomography offers an objective test for serial, quantitative
evaluations of retinal thickness.14 Increases in retinal thickness are usually caused by accumulation of intraretinal
fluid, widening the distance between the well-delineated anterior
and posterior boundaries of the neurosensory retina. Because of
the high axial resolution of OCT, retinal thickness can be measured
to within 10 microns and followed serially. Macular edema is the leading cause of decreased vision in patients with
diabetic retinopathy. Although “clinically significant macular
edema” continues to be a clinical diagnosis, OCT can provide the
clinician with additional useful information. OCT images can quantitatively
measure the amount of retinal thickening present; the amount of
thickening has been shown to correlate with visual acuity.15 Additionally, OCT can be used to follow the clinical response to focal
laser treatment for clinically significant macular edema, and successful
resolution of macular edema after laser treatment may be observed (Figs. 5 and 6). 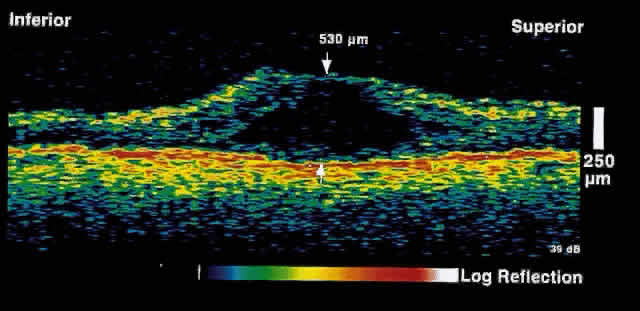 Fig. 5. OCT image through the fovea of a patient with clinically significant macular
edema. Fig. 5. OCT image through the fovea of a patient with clinically significant macular
edema.
|
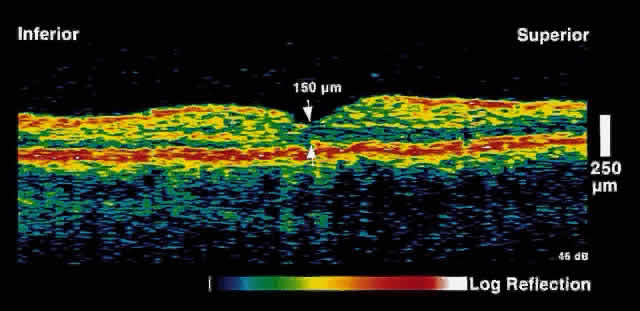 Fig. 6. OCT image through the fovea of the same patient several weeks after focal
laser photocoagulation. Note the dramatic decrease in retinal thickening. Fig. 6. OCT image through the fovea of the same patient several weeks after focal
laser photocoagulation. Note the dramatic decrease in retinal thickening.
|
Cystoid macular edema is characterized by fluid accumulation in intraretinal
cystic spaces. This may be from a variety of causes, including diabetes, venous
occlusion, cataract surgery, and inflammatory disease. OCT
images demonstrate cystic areas of decreased reflectivity within
the neurosensory retina consistent with the known histopathology of this
entity. Again, the ability to quantitate the extent of thickening is
useful not only in the diagnosis of this disease but also in assessing
the response to treatment (topical medications, periocular steroids, vitrectomy). Age-Related Macular Degeneration In the imaging of macular pathology from age-related macular degeneration, OCT
has clinical utility in several areas. As described above, OCT
can help distinguish central serous retinopathy from exudative age-related
macular degeneration in older patients. Retinal edema from choroidal
neovascularization, particularly when it involves the fovea, can
have a profound effect on visual function. Because of its ability to measure
retinal thickness accurately, OCT is useful in assessing the response
to laser treatment for choroidal neovascularization. OCT can also differentiate among serous, hemorrhagic, and fibrovascular
RPE detachments.16,17 Serous RPE detachments present as focal elevations of the reflective RPE
band over an optically clear space (Fig. 7). The angle of the edge of the detachment is typically acute, probably
because of tight adherence of RPE cells to Bruch's membrane at the
edge of the detachment. Hemorrhagic RPE detachments are distinguished
by a moderately reflective layer directly beneath the detached RPE, corresponding
to the sub-RPE blood (Fig. 8). Fibrovascular RPE detachments, in contrast, demonstrate moderate reflectivity
throughout the entire sub-RPE space (Fig. 9). This is probably the result of the lower scattering coefficient of the
fibrovascular proliferation as compared to blood. 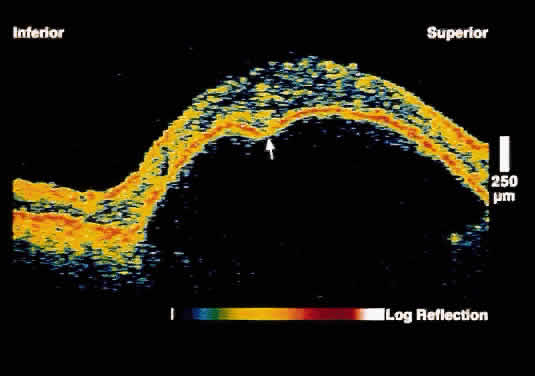 Fig. 7. OCT image through the fovea of a patient with a serous RPE detachment secondary
to age-related macular degeneration. Note the sharp contrast
between the posterior border of the detached RPE band and the underlying
serous fluid. Fig. 7. OCT image through the fovea of a patient with a serous RPE detachment secondary
to age-related macular degeneration. Note the sharp contrast
between the posterior border of the detached RPE band and the underlying
serous fluid.
|
 Fig. 8. OCT image through the fovea of a patient with a hemorrhagic RPE detachment
secondary to age-related macular degeneration. Note the reflective
layer directly beneath the detached RPE, which corresponds to sub-RPE
blood. Significant shadowing of deeper layers is present because of the
attenuation of the OCT probe beam by the hemorrhage. Fig. 8. OCT image through the fovea of a patient with a hemorrhagic RPE detachment
secondary to age-related macular degeneration. Note the reflective
layer directly beneath the detached RPE, which corresponds to sub-RPE
blood. Significant shadowing of deeper layers is present because of the
attenuation of the OCT probe beam by the hemorrhage.
|
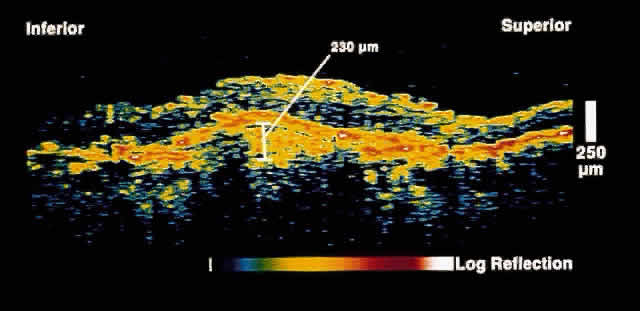 Fig. 9. OCT image through the fovea of a patient with a fibrovascular RPE detachment
secondary to age-related macular degeneration. Note the moderately
reflective layer throughout the sub-RPE space, which corresponds to
fibrovascular tissue. Fig. 9. OCT image through the fovea of a patient with a fibrovascular RPE detachment
secondary to age-related macular degeneration. Note the moderately
reflective layer throughout the sub-RPE space, which corresponds to
fibrovascular tissue.
|
OCT may serve as an adjunct to fluorescein and indocyanine green angiography
in the classification of choroidal neovascular membranes. Choroidal
neovascular membranes typically have one of three presentations on
OCT: fibrovascular RPE detachment, well-defined, or poorly defined. The
OCT presentations typically correspond to the angiographic classifications. Well-defined
choroidal neovascular membranes on OCT appear as
a fusiform thickening of the reflective band corresponding to the RPE/choriocapillaris. The
thickening extends anteriorly on the OCT image, creating
an elevation in the normally smooth contour of the RPE band. Poorly
defined choroidal neovascular membranes on OCT images present
as ill-defined, diffuse areas of choroidal reflectivity that blend into
the normal contour of the RPE band; a distinct boundary cannot be ascertained. Perhaps of greatest interest is the ability of OCT to localize a choroidal
neovascular membrane to either the subretinal or sub-RPE space. Thus, OCT
may have utility in defining surgically approachable membranes
in age-related macular degeneration as well as from other causes of choroidal
neovascularization. Figure 10 shows a choroidal neovascular membrane that has penetrated the RPE to
lie primarily in the subretinal space. 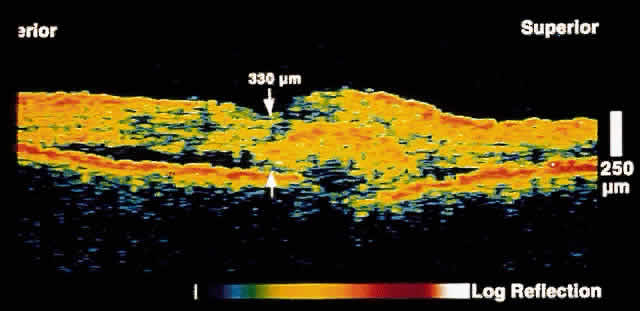 Fig. 10. OCT image through the fovea of a patient with a choroidal neovascular membrane
secondary to age-related macular degeneration. The neovascular
tissue appears to have penetrated Bruch's membrane to lie primarily
in the subretinal space. Fig. 10. OCT image through the fovea of a patient with a choroidal neovascular membrane
secondary to age-related macular degeneration. The neovascular
tissue appears to have penetrated Bruch's membrane to lie primarily
in the subretinal space.
|
Macular Hole Optical coherence tomography facilitates the ability to stage macular holes
according to the Gass classification: stage I, foveal detachment; stage
II, small, full-thickness hole; stage III, fully developed, full-thickness
hole; and stage IV, fully developed, full-thickness hole with
vitreous detachment.18,19 In a stage I hole, the OCT image shows loss of the foveal depression, a
cystic space in the fovea, and vitreous fibrils inserting obliquely
onto the fovea. The micron scale resolution of OCT has greatly facilitated
our understanding of stage I holes, demonstrating that it is oblique
vitreous traction rather than tangential traction on the fovea (as
traditionally believed) that is responsible for the pathologic changes
in this entity. In a stage II hole, an anvil- or flask-shaped full-thickness
retinal defect is present. In an eccentric stage II hole, an
anterior flap of attached retina is present. In contrast, OCT images through
stage III holes demonstrate an anvil- or flask-shaped defect without
a retinal flap at the mouth of the flask. In stage I through III
holes, the posterior hyaloid face is typically visualized inserting into
the foveal or perifoveal region, supporting the vitreomacular traction
theory of macular hole development. In a stage IV macular hole, a
full-thickness retinal defect is noted in addition to complete separation
of the posterior hyaloid face from the retina. Lamellar macular holes, in
which there is partial loss of inner retinal tissue, are also
clearly imaged by OCT. OCT enables the clinician to monitor patients
longitudinally and document hole progression and can assist in the timing
of surgical intervention. Successful hole closure after surgery may
also be documented with OCT (Figs. 11 and 12). Finally, periodic OCT examination of fellow eyes may be performed to
identify impending macular holes, because patients with idiopathic macular
hole may be at risk for bilateral disease.  Fig. 11. OCT image through the fovea of a patient with a stage III macular hole. Note
the full-thickness anvil- or flask-shaped defect through the fovea. In
contrast to a pseudohole, no retinal tissue is present at the base
of the hole. Fig. 11. OCT image through the fovea of a patient with a stage III macular hole. Note
the full-thickness anvil- or flask-shaped defect through the fovea. In
contrast to a pseudohole, no retinal tissue is present at the base
of the hole.
|
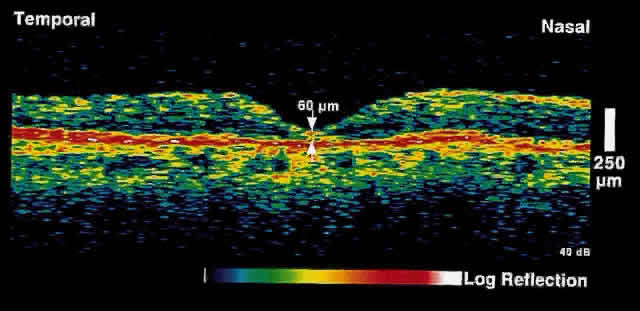 Fig. 12. OCT image through the fovea of the same patient after macular hole surgery. Note
the restoration of normal foveal anatomy. Fig. 12. OCT image through the fovea of the same patient after macular hole surgery. Note
the restoration of normal foveal anatomy.
|
Epiretinal Membrane Epiretinal membranes from trauma, inflammatory disease, proliferative disease, intraocular
surgery, or idiopathic causes may be clearly imaged
by OCT.20 Epiretinal membranes appear as a band of moderate to high reflectivity
anterior to or contiguous with the retinal surface. In some cases epiretinal
membranes barely detectable clinically are well detailed on OCT
images. In addition to direct visualization of the epiretinal membrane, secondary
retinal thickening from traction can be observed. OCT imaging of epiretinal membranes is useful in several respects. As with
macular holes, longitudinal observation can help the clinician with
the timing of surgery (cases where serial OCT images demonstrate progressive
retinal thickening) and the assessment of surgical outcomes. Macular
pseudohole from an epiretinal membrane can sometimes be difficult
to differentiate from a true macular hole on ophthalmoscopic examination
alone. OCT is useful in this respect: macular pseudohole appears
as a thickened band of moderate reflectivity on the retinal surface, with
a steepened foveal pit contour (Fig. 13). Full-thickness retinal tissue is present at the base of the apparent
hole formed by the epiretinal tissue. 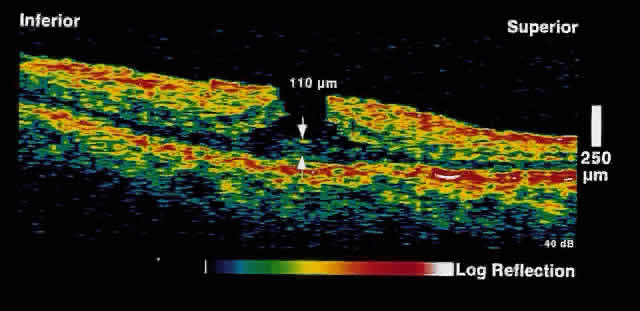 Fig. 13. OCT image through the fovea of a patient with a pseudohole secondary to
an epiretinal membrane. A steepened foveal contour is present. At the
base of the “hole,” full-thickness retinal tissue is present. Additionally, a
reflective layer is present on the surface of the
retina, corresponding to the epiretinal membrane. Fig. 13. OCT image through the fovea of a patient with a pseudohole secondary to
an epiretinal membrane. A steepened foveal contour is present. At the
base of the “hole,” full-thickness retinal tissue is present. Additionally, a
reflective layer is present on the surface of the
retina, corresponding to the epiretinal membrane.
|
Retinal Detachment and Retinoschisis Full-thickness retinal detachment can usually be distinguished from degenerative
retinoschisis on the basis of clinical features alone. However, in
some cases this is difficult; various ancillary tests such as laser
photocoagulation, visual field evaluation, and B-scan ultrasonography
can be helpful but are not always definitive. OCT is an objective
and reliable method to distinguish the two entities.17 In retinoschisis, OCT images show splitting of the neurosensory retina
consistent with the known histopathology of a separation at the outer
plexiform layer (Fig. 14). Retinal detachment presents as a separation of full-thickness neural
retina from the underlying RPE band (Fig. 15). Although lesions anterior to the equator cannot be imaged by OCT, most
lesions that are posterior to the equator, or that have a component
posterior to the equator, can be effectively imaged. 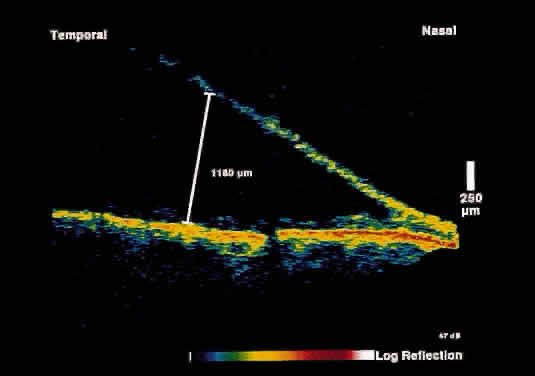 Fig. 14. OCT image through peripheral retinal elevation suspected to be retinoschisis versus retinal detachment. This image shows a splitting of the neurosensory retina
consistent with retinoschisis. Fig. 14. OCT image through peripheral retinal elevation suspected to be retinoschisis versus retinal detachment. This image shows a splitting of the neurosensory retina
consistent with retinoschisis.
|
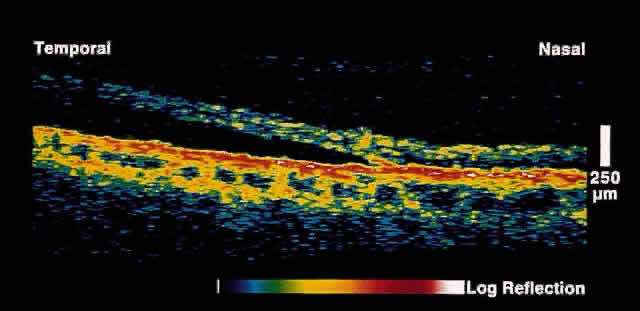 Fig. 15. OCT image through peripheral retinal elevation suspected to be retinoschisis versus retinal detachment. This image shows a full-thickness detachment of the
neurosensory retina consistent with a retinal detachment. In contrast
to retinoschisis, splitting of the neurosensory retina is not present. Fig. 15. OCT image through peripheral retinal elevation suspected to be retinoschisis versus retinal detachment. This image shows a full-thickness detachment of the
neurosensory retina consistent with a retinal detachment. In contrast
to retinoschisis, splitting of the neurosensory retina is not present.
|
GLAUCOMA The diagnosis and management of glaucoma remains a difficult clinical problem. Intraocular
pressure measurements do not always adequately predict
the extent of glaucomatous change. Optic nerve head and gonioscopic
evaluation by slit-lamp biomicroscopy is subjective. Visual field loss
and optic nerve head cupping are late clinical findings, detected
only after up to 50% of retinal nerve fibers have been lost. OCT, because of its high resolution, is able to detect nerve fiber layer
thinning before the onset of visual changes.21 Nerve fiber layer thickness, as measured by OCT, has been shown to correspond
to visual function. As expected from the histology of the peripapillary
retina, the nerve fiber layer is thickest in the inferior and
superior quadrants. The nerve fiber layer has been demonstrated to be
significantly thinned in areas corresponding to visual field loss. Typically, the scans are performed radially around the optic nerve for 360° using
two radii of curvature (2.25 and 3.37 mm), and the nerve
fiber layer thickness is plotted schematically (Fig. 16). Normal nerve fiber layer thickness is a mean of 148.6 microns for superior
nerve fibers, 143.5 microns for inferior nerve fibers, 66.9 microns
for temporal nerve fibers, and 117.2 for nasal nerve fibers. The
direct measurement of the nerve fiber layer thickness by OCT is an objective
assessment of glaucomatous progression. OCT shows promise in the
early diagnosis of glaucoma before visual field defects, optic nerve
head changes, and ophthalmoscopically visible nerve fiber layer loss
are evident. 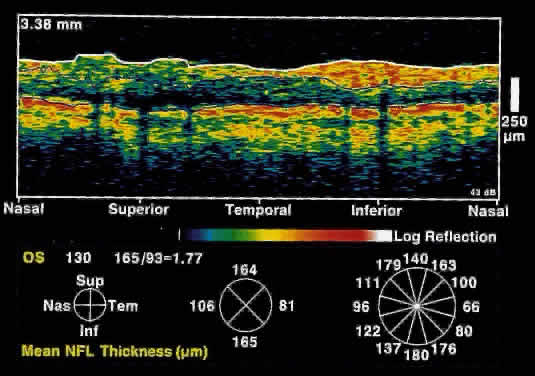 Fig. 16. Circular OCT image of a normal eye taken in cylindrical section around
the optic nerve head. Note the thicker nerve fiber layer superiorly and
inferiorly. Fig. 16. Circular OCT image of a normal eye taken in cylindrical section around
the optic nerve head. Note the thicker nerve fiber layer superiorly and
inferiorly.
|
CORNEA Optical coherence tomography of the cornea has not been widely investigated. Currently, information concerning corneal thickness and profile
can be obtained with pachymetry and topography. However, there is potential
for OCT to aid in the evaluation of corneal thickness by specific
corneal layer. CATARACT Optical coherence tomography can demonstrate consistent changes in reflectivity
in experimentally induced cataract. However, this technique is
not used in the clinical evaluation of patients with cataract. |