Chapter 19
Color Vision
Anthony J. Adams, Wayne A. Verdon and Bruce E. Spivey
Main Menu   Table Of Contents

Search

INTRODUCTION
ANATOMY AND PHYSIOLOGY OF COLOR VISION
PSYCHOPHYSICAL ESTIMATES OF THE SPECTRAL SENSITIVITIES OF CONES
NORMAL PERCEPTION OF COLORS
INHERITED ANOMALIES OF COLOR VISION
COLOR DISCRIMINATION: NORMAL AND ABNORMAL
ACQUIRED COLOR VISION DEFECTS
A METRIC FOR COLOR SPACE: PREDICTING ABNORMAL COLOR VISION IN THIS SPACE
COLOR VISION TESTING IN CLINICAL PRACTICE
CORRECTION OF COLOR-VISION DEFECTS?
MOLECULAR BIOLOGY OF CONE PHOTOPIGMENTS
REFERENCES

INTRODUCTION
We live in a world of objects made up of an almost infinite array of colors. Or do we? It can be surprising to learn that the world is not colored, but that our brain is responsible for generating the colors we see.

Of course, a real objective difference does exist between a red and a green apple because color is determined in large part by the composition of light that enters the eye after being transmitted through or reflected off objects. However, many properties of the human eye and brain influence the color name that we give the object. Some of the physiologic processes of color perception are now understood in terms of the way light energy is transformed and coded into color signals and the way those signals are interpreted in the visual system.

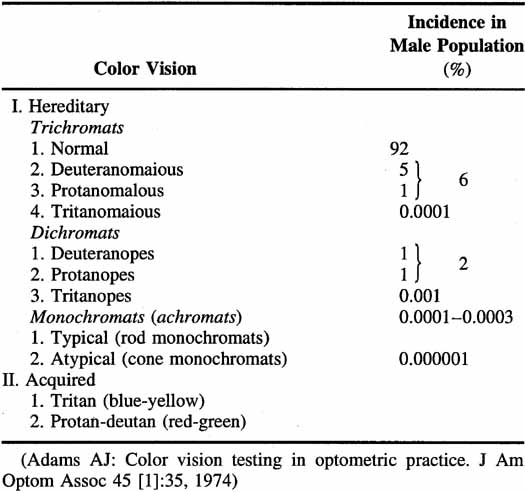
Not all humans see colors the same way. Most of us are resigned to occasional arguments about whether a carpet is beige or cream-colored. However, individual differences in color perception can be more profound and more important. Almost 10% of the male population and approximately 0.5% of the female population have defective color vision that makes it difficult for them to discriminate some colors—or at least more difficult than normal. This so-called color blindness is one of the most common of all genetic defects and has fascinated geneticists, vision scientists, and medical practitioners. Great advances have been made in understanding the genetics of normal and congenitally defective color vision. We now know the precise gene coding sequence for the rod and cone photopigments, and we understand more about variations in normal color vision and the underlying pigment changes that account for color vision defects. Very few people, perhaps 1 in 10,000, are truly color blind (that is, they see everything in shades of gray), but even the previously mentioned 10% of color-defective males and the 0.5% of color-defective females who do see color yet fail on tests of “color blindness” are likely to be precluded from engaging in certain occupations that require normal color vision (e.g., becoming policemen, firemen, pilots, or drivers).

In this chapter, we present some of the results of physiologic and psychophysical studies made on encoding color vision signals in the visual system. Further, we relate these findings to the color discrimination of normals and color defectives in an attempt to understand why there are these differences between the two groups and discuss these differences in the context of clinical testing of color vision.

The radiant energy that gives rise to the sensation of vision is a very narrow section of the electromagnetic spectrum (Fig. 1), with the wavelength of light being less than one ten-thousandth of a millimeter. The wavelength limits of visible light extend from the extreme violet end (wavelength approximately 400 nm or four ten-thousandths of a millimeter) to the extreme red part of the spectrum (wavelength 700 nm). Yet within this range, the human eye is able to distinguish many different color sensations.

Fig. 1 The radiant energy (electromagnetic) spectrum. (Adapted from McKinley RW [ed]: IES Lighting Handbook. New York: Illuminating Engineering Society, 1947)

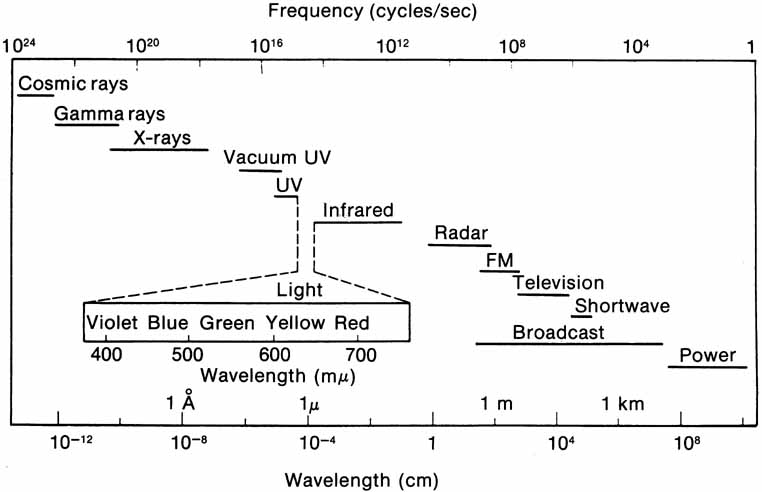
Light also has particle properties and wave characteristics; the radiant energy can be considered as extremely small discontinuous particles of energy called quanta. The energy in a quantum is directly proportional to the frequency of the electromagnetic energy. Consequently, high-frequency violet light (400 nm) contains twice the energy per quantum as radiation at 800 nm.

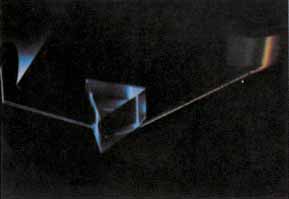
In 1666 Isaac Newton spread the spectral components of normal white sunlight across the wall of his room by allowing a shaft of white light to pass through a small glass prism. A repetition of this simple experiment will illustrate a number of important aspects of color vision to be considered in some detail later in this chapter (Fig. 2, in color). If your vision is normal, you will note first that the ends of such a spectrum (violet and red) are quite dim compared with the middle of the spectrum (yellow and green). The fact that the middle appears to be the brightest suggests that the eye is not equally sensitive to all wavelengths. Second, as you move your eyes across the color spectrum, you will find two areas in which, for a given space (or number of nanometers), you seem to perceive more than the usual number of different colors. One of these areas is in the blue and green region; the other in the yellow region. This phenomenon suggests that the eye is able to make finer discrimination between adjacent wavelengths in certain sections of the spectrum. Third, you will probably find that the region of the spectrum that looks the least colored or most like white lies in the yellow portion of the spectrum (approximately 570 nm).

Fig. 2 A slit of white light is broken into its spectral components by a glass prism. (Fritz Goro, Life Magazine ©1944 Time Inc.)

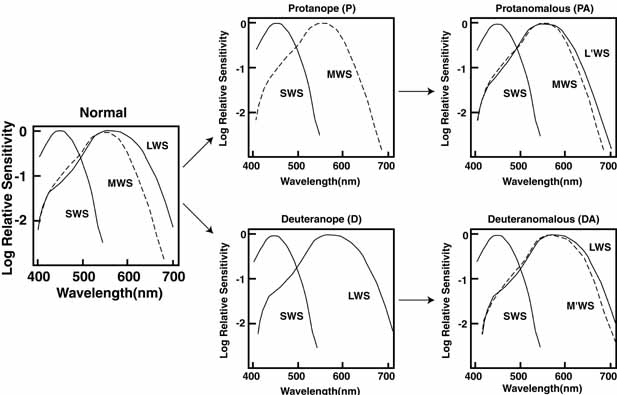
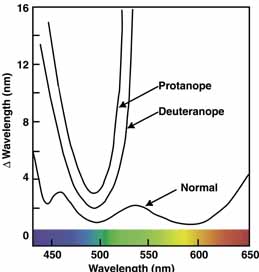
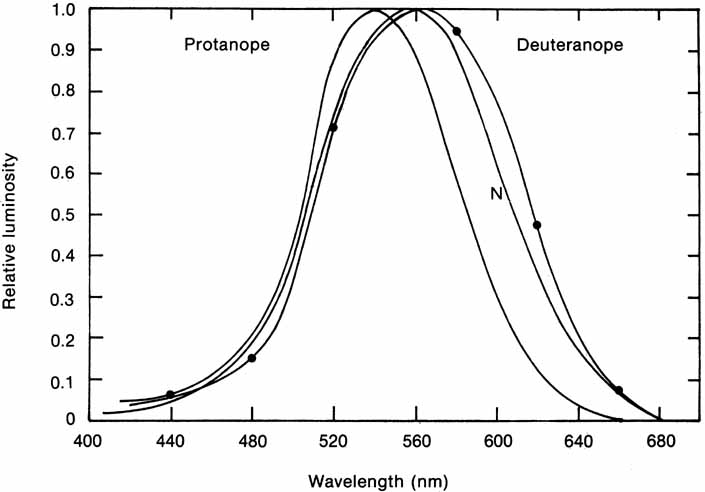
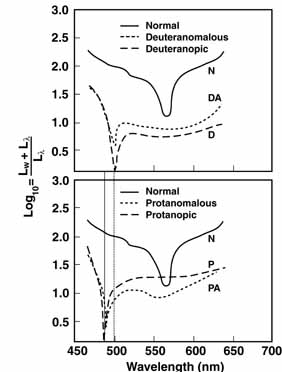
The foregoing are the observations of people with normal color vision. The same spectrum when viewed by many color–-vision-defective subjects will result in different observations. For example, in contrast to normal subjects, color-defective subjects may see the range of light waves that would normally be green as the brightest part of the spectrum. They may see the area that normally would be blue–green as the most like white, and they may be unable to make color distinctions in what would ordinarily be the green through red region. All of these variations in observations may be understood in terms of differences in color-vision mechanisms between normal and hereditary color defectives.

The various theories about how humans perceive color and light developed slowly. Newton's interest in the subject did not stop at prisms. He speculated that light sets up vibrations in the optic nerves that are tuned to respond to each color. Approximately 100 years later, Thomas Young decided that to postulate the existence in the retina of an almost infinite number of receptors was to ignore some basic facts.1

If an individual had to have a very large number of color receptors—one for each color sensation—then at a particular point in the retina, where he or she is able to distinguish one colored object from another, he or she would have to have a complete set. This arrangement would call for an area so large that objects would have to be very far apart to distinguish them. Because we know that this is not the case—the eye has good resolution and can distinguish between things that are very close together—it becomes difficult to conceive of a way in which that many receptors could be piled into as small a location as is indicated by our excellent spatial resolution.

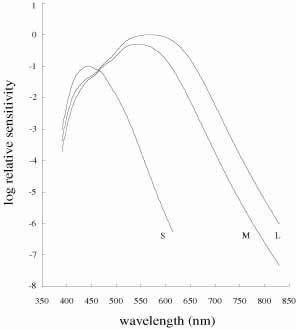
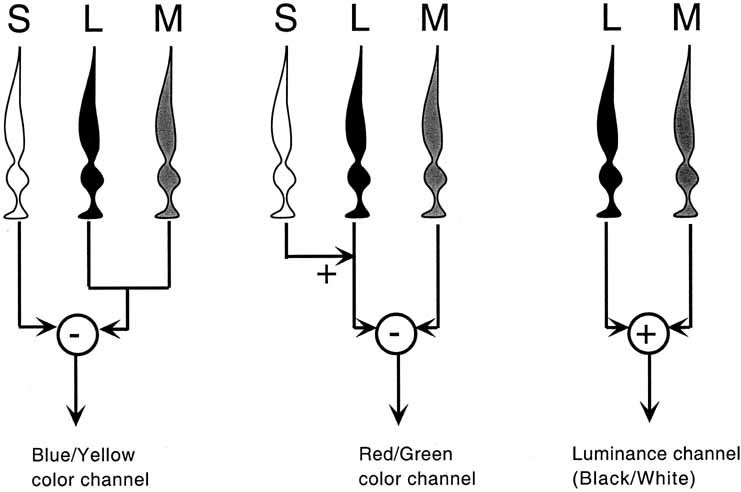
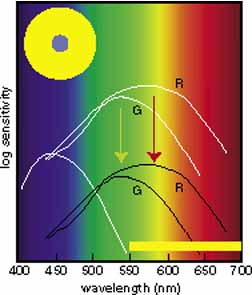
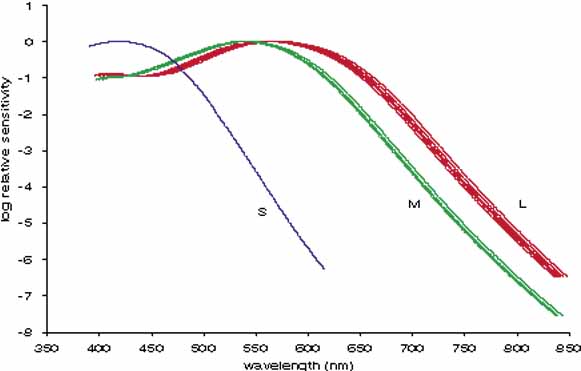
Instead, Young proposed three resonator groups responding maximally to one of three principal colors. Helmholtz, in the mid-19th century, elaborated on this theory and pointed out that although each receptor responded maximally to a particular region of the spectrum, they all responded over practically the entire spectrum.2 In such a scheme, the various color sensations would be the result of the relative strengths with which the three groups of receptors were stimulated. Color vision would thus require a limited number of receptors of different but overlapping spectral sensitivity and a neural system that compares the output of different receptor types.

Even though Helmholtz and, later Hering, proposed the elements of these requirements more than a century ago, until very recently their theoretic contributions were seen as mutually exclusive.3 Hering and Helmholtz seemed to see it this way also.

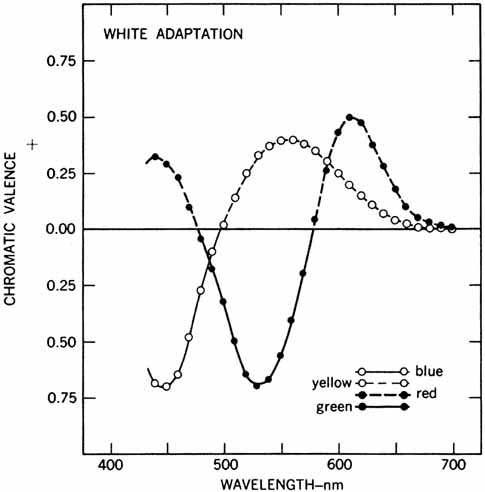
Hering proposed that there were three kinds of “catching material,” two substances providing signals about color and one signaling blackness or whiteness. The three substances were responsible for producing warm (white, yellow, red) and cold (black, blue, green) color sensations. Hering explained this in terms of a warm color being paired with cold color in each substance (yellow–blue, red–green, white–black). Light had two opposing actions: catabolism produced the warm colors, anabolism the cold colors. The theory was primarily aimed at accounting for the six distinct sensations that appeared to be paired in everyday sensations of color (e.g., a red afterimage follows exposure to green light).

De Valois and De Valois have pointed out that the long arguments and confusion about the Helmholtz and Hering theories were aided by the unfortunate fact that Hering proposed that the opponent process occurred at the receptor level.4 Today, there is considerable evidence that in the normal eye there are three separate receptor types, as Young and Helmholtz proposed, and subsequent neural pathways that compare the outputs of the different receptor types (spectrally opponent interactions), much like the organization that formed the basis of Hering's proposal.

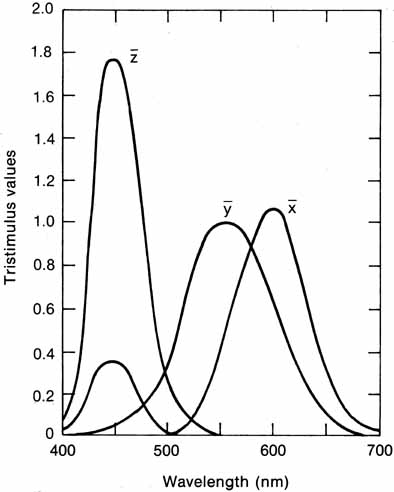
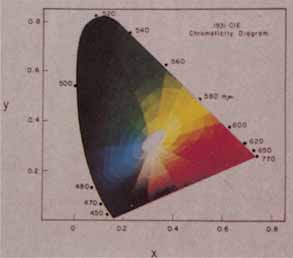
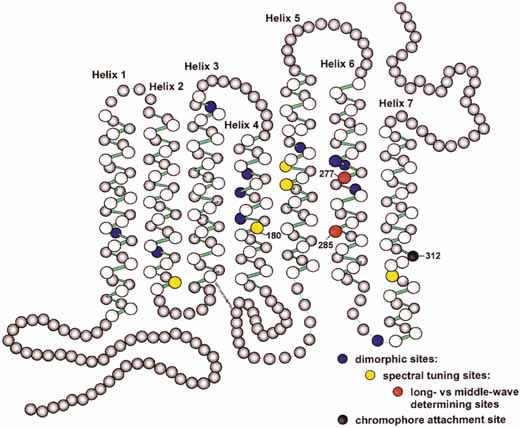
The presence of three cone receptors in the normal human retina is entirely consistent with the so-called trichromacy of vision that was known even before Newton's time and quantitatively established by Maxwell.5 Maxwell's carefully performed color-matching experiments showed that all spectral colors could be matched with some mixture of three primary colors chosen from the red, green, and blue regions of the spectrum. These and subsequent studies supported the description of the normal color vision as requiring three independent variables. With the recent advances in molecular genetics and refinement of psychophysical techniques to assess color vision, the presence of only three cone pigments is coming under scrutiny. Whether all color-normals have the same three cone pigments and whether an individual can possess more than three cone pigments are at the forefront of color science.

Back to Top
ANATOMY AND PHYSIOLOGY OF COLOR VISION

PHOTOPIGMENTS

The first steps of vision involve the absorption of quanta by bleachable photopigments. The photopigments are located in the outer segments of either rod or cone photoreceptors in the retina. The pigments in the cones are important for color vision. Each pigment molecule consists of a protein part, the opsin, and 11-cis retinal, a chromophore. Once the chromophore absorbs a quantum, it changes to the all-trans form. This then causes a shape change in the visual pigment molecule, which activates the pigment and initiates the phototransduction cascade, which eventually leads to the generation of visual signals that leave the eye. Whether a quantum is absorbed by a pigment, or whether the quantum retains its energy and is simply transmitted through the cone, depends on the wavelength of the quantum and on the spectral tuning property of the pigment molecule.

Human color vision can be approached by considering the three major classes of cones, designated S, M, and L. The letters are abbreviations for short wavelength-sensitive (S), medium wavelength-sensitive (M), and long wavelength-sensitive (L). The cone types refer to the broad regions of the spectrum over which each pigment absorbs. It is important to observe that the classical designations of blue, green, and red cones are no longer used because they are misleading. Although recent studies have shown that there are multiple variations within the L and M families of pigments within the color normal retina, it is still useful to consider color vision from the point of view of prototypical S, M, and L pigments.

Measurements of human M and L cone pigments are shown in Figure 3. Individual cone outer segments were sucked into a suction micropipette recording electrode. The electrode records the circulating photocurrent in the outer segments of individual photoreceptors.6 At each wavelength across the spectrum, the amount of energy is found that gives a criterion electrical response. To plot the spectral sensitivity of each cone, the inverse of this energy is plotted against wavelength. Figure 3 shows that both L and M pigments are sensitive to a broad range of wavelengths. They are certainly not sensitive to only the parts of the spectrum that we would name as red and green. The wavelengths of peak absorption of the L and M pigments are approximately 530 nm and 560 nm. The human S pigment (not shown) peaks at approximately 420 nm.

Fig. 3 Spectral sensitivity of human cones measured by the suction electrode technique. Average of five L cones (left) and a single M cone (right). The solid lines are derived from macaque monkey cones using the same technique. (Reprinted with permission from Schnapf JT, Kraft TW, Baylor DA: Spectral sensitivity of human cone photoreceptors. Nature 325: 439, 1987. Copyright 1987, Macmillan Magazines Ltd.)

In the living eye, the spectral tuning of the cones is further shaped by the spectral absorption of the ocular media through which light must pass before reaching the retina. The principal structures that reduce sensitivity are the crystalline lens and the macular pigment (for foveal vision). The lens absorbs strongly in the UVA region, and it ultimately limits visibility at short wavelengths. As we age, the crystalline lens absorbs more and more short wavelength light and it acts as a yellow filter. Note in Figure 3 that the cone pigments themselves are quite sensitive at short wavelengths. The macular pigment, composed of lutein and zeaxanthin, is present in the central 5 degrees of the retina and it has a peak absorption at 460 nm.7 Macular pigment absorbs very little light at wavelengths shorter than 400 nm or longer than 520 nm, hence it too appears yellow (giving the macula lutea its name).

Figure 4 shows the best estimates of the human cone spectral sensitivities in the living eye.8,9 Average estimates for lens and macular pigment absorptions have been used. To generate a set of so-called fundamental curves such as these, a number of measurements are usually considered. Importantly, the proposed curves must be consistent with human color vision, particularly color-matching behavior (discussed later). In addition, the fundamentals should be consistent with physiological measurements such as suction electrode studies, microspectrophotometric estimates of human cones, and human dichromatic color vision. Note that the sensitivity to short wavelengths appears reduced compared to the pigment curves in Figure 3. As discussed previously, this is caused by the media absorption. The relative heights of the curves reflect the relative numbers of each cone type in the normal trichromatic eye.

Fig. 4 Estimates of human cone fundamentals underlying normal color vision. The heights of the curves reflect the relative numbers of S, M, and L cones. Data are based on normal trichromatic color matching data, and on data from dichromats and blue cone monochromats. The optical density of cone pigments and the lens and macular pigment absorptions have all been taken into consideration in generating these fundamentals. Data are energy-based. From the tabulated data of Stockman and Sharpe (http://cvrl.ioo.ucl.ac.uk/). (Stockman A, Sharpe LT, Fach CC. The spectral sensitivity of the human short-wavelength cones. Vision Res 39, 2901–2927, 1999; Stockman A, Sharpe LT. Spectral sensitivities of the middle- and long-wavelength sensitive cones derived from measurements in observers of known genotype. Vision Res 40, 1711-1737, 2000.)

CONES AND CONE ARRAYS

The principle of univariance states that information about a photon's energy or wavelength is lost once it is absorbed by a photopigment molecule.10 This crucial fact means that each cone is color blind. In other words, an individual cone can signal an increase or decrease in activity but it cannot distinguish whether the change in activity results from a wavelength shift or an intensity change. How then can an array of color-blind receptors provide information about the wavelength content of a stimulus? The answer is that each of the three cone types has a different response to the stimulus because of its spectral sensitivity, and by comparing the outputs from different cone types, a second-order neuron can separate out a change in wavelength from a change in intensity. For example, at constant luminance, a wavelength shift from 500 nm (green) to 490 nm (blue) will increase stimulation of S cones while decreasing stimulation of M and L cones. If the S, M, and L signals are compared, the direction of the wavelength shift can be discerned. However, an intensity change of a 500 nm light will increase (or decrease) the stimulation of all three cone types. Therefore, comparing outputs from cones or arrays of cones is essential for color vision.

M and L cones are morphologically indistinguishable, and they comprise more than 90% of all cones. S cones, however, tend to be fatter than the other cone types, particularly in the region of the inner segment, and they make up less than 10% of the 5 million cones in a human eye.11. There are approximately twice as many L cones as M cones, although individual variation occurs within the color normal population.12,13 Overall, the ratio of S:M:L is approximately 1:5:10.

S cones are absent from the central 20 minutes of arc of the central foveola. This S–cone-free zone corresponds to the size of a 20/80 letter. The S cones do not contribute to detailed visual resolution, and their absence from this small central region allows optimal L and M cone packing, thereby maximizing spatial sampling.14 The consequence to color vision is that color normals are tritanopic for very small stimuli centered on the fovea. The density of S cones is greatest at 1 to 2 degrees from the fovea. Figure 5 shows the cone distributions and the S cone mosaic in a donor human eye. The density of L and M cones declines steeply away from the fovea. Although overall cone density is by far greatest at the fovea, cones are present across the entire retina.

Fig. 5 A: Locations of individual S cones in human retina. The center of the foveola is indicated by a triangle. The central 100μm is devoid of S cones. S, superior; N, nasal. B: Distributions of S cones and of L plus M cones across the retina. The peak density of S cones is at approximately 1 to 2 degrees eccentricity. The cone density scale for L and M cones is compressed by a factor of 10 relative to the scale for S cones. (Redrawn from Curcio CA, Allen KA, Sloan KR, Lerea CL, Hurley JB, Klock IB, Milam AH: Distribution and morphology of human cone photoreceptors stained with anti-blue opsin. J Comparative Neurol 312: 610-624, 1991. Copyright © 1991 Wiley-Liss, Inc., A Wiley Company. Reproduced with permission of John Wiley and Sons, Inc.)

Recently adaptive optics has allowed direct visualization of the human cone mosaic. The technique compensates for aberrations of the eye, allowing previously unattainable spatial resolution. Combined with selective bleaching (using colored lights to differentially bleach cone populations) the mosaic of S, M, and L cones has been revealed.13 Figure 6a shows an image of the retina centered close to the fovea. Figure 6b shows a pseudo color image in which individual S, M, and L cones are colored blue, green, and red. Statistical analysis reveals that in humans S, M, and L cones appear randomly distributed 15.

Fig. 6 A: Adaptive optics image of the retinal cone mosaic 1 degree nasal to the fovea. The retina was illuminated with 550 nm light. Approximately 50 images were averaged. The small circles are individual cone outer segments. B: Pseudo color image of the retinal cone mosaic. The colors red, green, and blue represent the locations of individual L, M, and S cones respectively. The subject and retinal region shown correspond to Figure 6A. Individual cone types were assigned using selective bleaching experiments. (From http://www.opt.uh.edu/research/aroorda/. The images were taken at the University of Rochester and are provided courtesy of Austin Roorda and David Williams.)

HORIZONTAL CELLS

Horizontal cells are laterally connecting interneurons at the outer plexiform layer of the retina. They make synaptic connections with photoreceptors and bipolar cells. Two types of horizontal cell have been described in primate retina. H1 connects to L and M cones, but rarely S cones. H2 connects selectively to S cones and to L and M cones. Figure 7 shows a schematic of the circuitry in primate retina.16 Horizontal cells provide the lateral connections that create the center-surround receptive field (RF) structure of the bipolar cells. In lower vertebrates, for example fish, horizontal cells are chromatically opponent.17 This means that the horizontal cell hyperpolarizes to some wavelengths and depolarizes to other wavelengths. In contrast to this, intracellular recordings from primate retina clearly show that horizontal cells hyperpolarize to all wavelengths, and they therefore do not carry a chromatically opponent signal.18 No experiments have shown that H1 cells make cone-specific connections to just M cones or just L cones. H1 connections to L and M appear random, and this implies that the RF surround of midget bipolars should have a mixed L+M spectral response.

Fig. 7 Simplified circuitry of primate retina. The major retinal cell types and their connections are shown. Cones are designated as S, M, or L. Diffuse bipolars and midget bipolars are each present as ON and OFF types. A special S cone bipolar cell is shown. Ganglion cells are of the parasol (MC), midget (PC), or small bistratified (S cones, KC) types. (Reprinted from Lee BB: Receptors, channels and color in primate retina. In Backhaus WGK, Kliegl R, Werner JS (eds): Color Vision: perspectives from different disciplines. Berlin: Walter de Gruyter, 1998:79–88. Copyright 1998. Reproduced with permission of Walter de Gruyter Gmbtl & Co. KG.)

BIPOLAR CELLS

The bipolar cells convey signals from photoreceptors to the ganglion and amacrine cells. Primate bipolar cells provide the first stage of separation of signals into the PC (parvocellular), MC (magnocellular), and KC (koniocellular) pathways. The pathways are named after specific target layers of the lateral geniculate nuclei. The three pathways are largely parallel with different anatomical connections and functional properties. With regard to color vision, the PC pathway appears to carry the red–green opponent signal and the KC pathway appears to carry the blue–yellow opponent signal. The MC pathway carries the luminance, or chromatically nonopponent, signal and it is not considered to play a role in color processing (for a review, see reference #).

Bipolar cells have a center-surround RF structure, with horizontal cells providing the connections by which the RF surround is constructed. There are three broad classes of primate bipolar cell. Diffuse bipolars synapse directly to multiple cones, and they feed to the chromatically nonopponent MC ganglion cells. Midget bipolars over much of the retina synapse directly to a single cone. This creates a “private line” from a single cone to a single midget bipolar to a single midget (PC) ganglion cell. Intracellular recording from a midget bipolar has shown strong red–green opponency.20 Therefore, midget bipolars have a RF center mechanism that has a spectral sensitivity of whatever single cone type feeds its center. The RF surround mechanism is expected to have a spectral sensitivity of L+M, because H1 cells connect to L and M indiscriminately, although experimental determination of this is still lacking. A third class of bipolar cell is the S-cone bipolar, 21 which makes selective connections to S cones. Bipolar connections are shown in Figure 7.

Each foveal cone connects to at least four bipolar cells, an on diffuse, an off diffuse, an on midget, and an off midget (for a review see 22). The on varieties respond with depolarization to increases in quantal absorptions in the receptive field center, and the off varieties respond by hyperpolarizing to increases in quantal absorptions in the RF center. On and off cells synapse at different sublayers of the inner plexiform layer.

AMACRINE CELLS

There are at least 40 types of amacrine cells, and they modulate the signal transferred between the bipolar and ganglion cells. There is no evidence for cone specificity in amacrine cells, that is, amacrine cells that receive input from just one of the three cone types. In macaque retina, the most studied amacrine cells are AI spiking amacrine cells and AII amacrine cells. Both types receive input from L and M cones and they have a spectral sensitivity similar to the photopic luminosity curve.20 No amacrine cell has shown chromatic opponency and no amacrine cell has revealed a strong S-cone input. The role of amacrine cells in color vision is still unclear.

GANGLION CELLS

We know more about the properties of ganglion cells than about most other retinal cell types. Extracellular techniques can be used to record ganglion cells' action potentials. There are three major anatomical types of ganglion cell in primate retina, corresponding to the three bipolar types. Parasol ganglion cells project to the magnocellular layers of the LGN, and they are considered the anatomical substrate of the MC cells. These ganglion cells are spectrally nonopponent. Some properties of PC and MC ganglion cells are given in Table 1.


TABLE 1. Properties of PC and MC Ganglion Cells in Macaque Monkey Retina


PropertyPC CellsMC Cells
Color selectivityYesNo
Receptive field sizeSmallLarge (∼10 times)
LGN target layersParvocellular layersMagnocellular
Luminance contrast gainLowHigh
Cell sizeSmallLarge
Conduction velocityLowHigh
Response time courseTonicPhasic
Function at scotopic levelsNoYes
Linearity of spatial summationLinear (X)75% linear (X)
  25% nonlinear (Y)
Number of cells (millions)1 (90%)0.1 (10%)
Spatial resolutionSameSame

(Data from Kulikowski JJ, Dickinson CM, Murray IJ (eds): Seeing Contour and Colour, pp 224–227. Pergamon Press, Oxford, 1989)


Midget ganglion cells project to the parvocellular layers of the LGN and they are considered to be the anatomical counterparts of PC cells (Fig. 7). These cells provide the substrate for red–green spectral opponency. In the central 10 degrees of the retina, each midget ganglion cell receives input from a single midget bipolar, which, in turn, receives input from a single L or M cone. The RF center is therefore cone-specific. Spectral opponency of the ganglion cell would ensure whether the RF surround, which is presumably established by outer retina circuitry,23 receives mixed inputs from L and M cones, or whether the surround somehow receives input from the single cone type that is not represented in the RF center. Whether the RF surround has a mixed L and M input or whether it receives input from a single cone type is an area of current debate.24,25

A third ganglion cell type, named small bistratified ganglion cells, underlies blue–yellow opponency. These cells have been recognized in macaque and human retinas.26 They receive a direct input from the S-cone bipolar at their innermost tier and input from an OFF bipolar cell at the outermost tier (Fig. 7). The OFF bipolar cell connects to L and M cones. Therefore, this cell type responds with an increased firing rate to blue increments of light filling the RF and by reduced firing to yellow increments (blue-ON-yellow-OFF). The center and surround of the RF are the same size, so this cell type shows no spatial opponency. More recently, newly identified small populations of ganglion cells have been shown to receive S-cone input.27 These ganglion cells may help to clarify the sources of the S-OFF signal and thereby help to complete the picture of retinal circuitry for the S-cone pathways.

LATERAL GENICULATE NUCLEUS

Ganglion cells project to one of the two lateral geniculate nuclei, where they synapse. Each LGN is a 12-layered structure with four layers of small cells (parvolayers) and two layers of large cells (magnolayers). Each of the six layers has a sublayer of cells called the koniocellular layer (Fig. 8). This anatomical arrangement reveals a corresponding functional separation.

Fig. 8 Connections between the left lateral geniculate nucleus (LGN) and striate cortex (V1) of macaque monkey. LGN layers 1 and 2 are magnocellular laminae and layers 3 through 6 are parvocellular laminae. Spectrally opponent cells in the parvo layers project to striate layers 4cβ or 4a. Magno layers project to 4cα. (Adapted from Lennie P: Recent developments in the physiology of color vision. Trends in Neurosciences 7:243, 1984). Each of the 6 layers has a koniocellular sublayer that carries S cone signals to target layers I and III in primary visual cortex.

Magnocellular LGN

Parasol retinal ganglion cells project to the MC layers of the LGN. Magnocells are spatially opponent but show no spectral opponency. Most of the cone input to these cells comes from L and M cones, although S cones do appear to contribute to both the receptive field center and surround.19 The spectral sensitivity of MC layers approximates the photopic luminosity function.

Koniocellular LGN

Small bistratified ganglion cells (those serving the S cone pathways) synapse in the KC layers of the LGN. The KC path has blue–yellow spectral opponency but little or no spatial opponency.

Parvocellular LGN

Approximately 80% of ganglion cells project to the parvocellular layers of the LGN. PC LGN cells are spatially and spectrally opponent. Their spectral opponency comes from antagonistic L and M cone inputs to the center and surround of their receptive fields. Although these cells demonstrate strong color opponency, they also show spatial opponency to luminance stimuli, ie, stimuli that vary in intensity but not color.4 Therefore it is highly unlikely that these cells are devoted to color processing alone.

The color responses of cells can be determined in a number of ways. A particularly useful characterization can be made by modulating a stimulus along different directions in color space and determining which color direction most excites a particular cell. The color space shown in Figure 21 (shown later) demonstrates this principle. The preferred color direction for a cell provides a signature, and it is possible to deduce from the signature which cone types input to a given cell.28 The LGN cells' preferred directions in color space cluster into three groups. In general, KC cells respond best to isoluminant stimuli that modulate the S cone signals. PC cells respond best to isoluminant stimuli that modulate L and M cones without a change in S-cone stimulation. And finally, MC cells respond best to luminance (brightness) modulations.

Perceptually, humans can identify red, green, blue, and yellow colors that contain no trace of any other color. These are termed unique hues. A goal of the neurophysiology of color is to explain the cellular basis of color perception. The LGN PC pathway is the best candidate for red–green perceptual opponent color vision, and the KC pathway is the best candidate for blue–yellow perceptual opponency. However, the neurophysiological responses of both these pathways do not correlate well to our red–green and blue–yellow color vision. In other words, those stimuli that we perceive as unique hues do not correspond precisely to the preferred colors of the LGN MC and KC pathways. Therefore, we look to the visual cortex for another stage of color processing that might help explain the difference between the perceptual axes and the cells' signature axes.

STRIATE CORTEX

The destinations of the retinocortical pathways PC, MC, and KC, are separate in primary visual cortex, or V1. PC cells project to layers IVcβ, MC to IVcα, and KC to layers I and III. At this stage, the signals from these pathways become mixed with the result that V1 cells do not show the clustering of signature color responses into the discrete groups of LGN cells.29 Rather, optimum responses can be found to almost any direction in color space. The majority of V1 inputs come from color-coded cells, so it is not surprising that V1 cells show some color selectivity. However, it is not clear whether a given cell is coding color per se, or whether its color tuning is a byproduct of, for example, spatial processing. Cortical cells are found with color preferences that correspond to unique hues. Furthermore, cortical cells show responses that are more narrowly tuned to colors than LGN and ganglion cells, and the more precise tuning appears more consistent with perceptual data.

BEYOND STRIATE CORTEX

There is much clinical evidence for a color center in the human brain.30,31 Reports show that lesions in certain brain areas can leave an individual in a colorless world, even though other visual attributes may be relatively intact, such as spatial vision, motion perception, and so on. The condition is referred to as cerebral achromatopsia. A number of attempts have been made to identify the area involved. In humans, functional magnetic resonance imaging (fMRI) suggests that the temporal lobe is involved in color processing.32 Clinical studies are consistent with this location. The evidence in macaque monkey is somewhat confused. Initial studies implicated the area V4 as being the color center,33 but not all researchers find the high incidence of color-selective cells.34 There certainly seems to be a chromatic organization beyond striate cortex, although the exact transformations and connections are not fully elucidated.

Back to Top

PSYCHOPHYSICAL ESTIMATES OF THE SPECTRAL SENSITIVITIES OF CONES
The earliest evidence about the spectral sensitivities underlying color vision comes from psychophysical experiments. The psychophysical studies that have been most useful in identifying the basic color mechanisms have in the main followed one of two approaches.

The first approach involves the measurement of spectral sensitivities of human color defectives known as dichromats. Based on the assumption that these people lack one of the normal subject's three mechanisms and further that (like normal subjects) they also lack the S cone mechanism for very small targets at the fovea, it has been assumed that the dichromat's sensitivity at the central fovea is determined largely by one mechanism. The protanope (lacking L cones) was assumed to have only the M cone mechanism, and the deuteranope only the L cone mechanism. Willmer and Hsia and Graham used this approach to identify two mechanisms with broad overlapping spectral sensitivities that peaked at about 540 and 580 nm (Fig. 9).35,36 These results are essentially in accord with the analysis made by Pitt of the color-matching functions of dichromats.37 Later, Blackwell and Blackwell measured the S cone mechanism in blue-cone monochromats, color-blind subjects who lack functional M and L cones.38 These monochromats had a peak sensitivity at 440 nm.

Fig. 9 Human foveal spectral sensitivities of three types of color-defective humans (curves). The data points are from normal subjects made temporarily color defective by immediate previous exposure to intense colored light and follow closely the curves from color-defective humans. The curves and data points probably reflect the spectral sensitivities of three kinds of cone systems. (Data from Willmer EN: A physiological basis for human colour vision in the central fovea. Doc Ophthalmol 9:235, 1955; Blackwell H, Blackwell O: Rod and cone receptor mechanism in typical and atypical congenital achromatopsia. Vision Res 1:62, 1961; Brindley GS: The effects on colour vision of adaptation to very bright lights. J Physiol [London] 122:332, 1953)

The second approach involves the use of chromatic adaptation of normal subjects. It is based on the assumption that the sensitivity of one or two of the normal trichromat's mechanisms can be reduced by exposure to certain colored backgrounds, leaving the remaining mechanisms relatively more sensitive to determine spectral sensitivity. Such experiments identify color mechanisms peaking at about 540 and 570 nm, agreeing reasonably with the functions found in dichromats.35,39

Undoubtedly, the most extensive application of the chromatic adaptation technique has been applied by Stiles.40–43 He measured threshold responses to spectral lights against relatively low-intensity monochromatic backgrounds and isolated a number of spectral sensitivity curves (π mechanisms). Three of the mechanisms peaked at 440, 540, and 580 nm and probably reflect the activity of the S, M, and L cones, respectively. Using a similar technique but with more intense colored backgrounds, Wald basically confirmed the Stiles results.44 Wald argued that his three functions were estimates of the absorption spectra of the cone pigments and that three of Stiles' π mechanisms also were measures of the sensitivity of the cone mechanisms.

Color defectives and chromatic adaptation have each played an important role in the psychophysical inference of the cone spectral sensitivities in humans. At first glance it may seem surprising that we are able to measure the spectral sensitivity of a receptor type in color normal subjects, given that almost all second-order and subsequent neurons receive inputs from more than one cone type. The reason we can achieve relative isolation is that a strongly colored field will differentially adapt various cone types leaving one type substantially more sensitive than the others (see later). In the absence of strong chromatic adaptation, when a neutral (white) adapting field is used, the spectral sensitivity of the eye to increments reveals the antagonistic interaction between cones that characterize the opponent stage of color processing.45–47

Back to Top
NORMAL PERCEPTION OF COLORS
Trichromacy and color opponency brought together by a Zone model of color vision

In the latter part of the nineteenth century, Ewald Hering proposed an opponent color theory to account for the appearance of colors.3 Hering observed that a colored light cannot simultaneously elicit the appearance of red and green. The same is true for blue and yellow. In some way, red and green are opposite (or opponent) hues and blue and yellow are opposite hues. This idea eventually led to models of color vision in which the three cone types constituted the first, trichromatic stage, as postulated by Young and Helmholtz, to account for color mixture data, and a second opponent-processing stage, postulated by Hering to account for the opponent appearance of colors. Such a two-stage model (or “zone model”) incorporating these two different lines of thinking about color vision, it was hoped, would account for more color vision data than either one alone.

A simplified version of a zone model is shown in Figure 10. The model does not represent realistically the anatomical connections of the retina. The main features are the opposition (indicated by a minus sign) of S cone signals with a combination of L and M cone signals to generate a blue–yellow opponent channel, the opposition of L with M cone signals (with an input from S cones in the same direction as L signals) to generate the red–green opponent channel, and a luminance channel which sums (plus sign) the outputs of L and M cones.

Fig. 10 A simplified zone model for color vision, showing how cone outputs (the first zone) are combined in a second zone to produce the color opponent signals. S cone signals oppose L and M signals to generate a blue–yellow opponent signal. L signals (with an S input) oppose M signals to generate a red–green opponent signal. L and M signals combine additively to generate a luminance signal. The diagram is not anatomically correct, and it simplifies numerous details.

It is important to understand that the model is based on psychophysical evidence and the three identified channels are not necessarily identical to specific neural substrates. For example, luminance signals could be carried by different neural “streams” to the cortex and the stream responsible for color perception might change, depending on the spatial or temporal frequency of the visual stimuli or other stimulus factors. Similarly, the two color opponent channels of the model may share features with the responses of certain retinal ganglion cell types, but there are some important differences between color opponency in ganglion cells and perceptual opponency.

HUE CANCELLATION EXPERIMENTS AND COLOR OPPONENCY

More than 50 years after Hering put forward his ideas on opponent colors, Hurvich and Jameson measured the coloring power of spectral lights.48 They reasoned that if a light appeared red and there is a red–green color opponent channel, the redness could be canceled out by adding green to it. The amount of green required to neutralize the red would reflect the strength of the redness. By adding green light to red light, eventually a chromatic mixture could be made that contained neither redness nor greenness. The result would be a light that appeared unique yellow. Similarly, if there is a blue–yellow opponent channel, blue light could be used to cancel yellow and so on. Hurvich and Jameson determined hue cancellation functions for spectral lights of various wavelengths. The observer was provided with a 1-degree test stimulus consisting of a mixture of a monochromatic test wavelength and one of four fixed wavelength cancellation stimuli. The cancellation stimuli were close to the unique hues, red, green, blue, or yellow. For each test wavelength, the subject's task was to adjust the intensity of one of the cancellation stimuli until the target appeared to be neutral between blue and yellow (unique red or unique green), or neutral between red and green (unique yellow or unique blue). The resulting curves, shown in Figure 11, are called hue cancellation or chromatic valence functions. In the Figure, if the subject used blue to neutralize the yellowness in a test wavelength, the value is negative because it opposes the yellow value that is plotted as a positive value (subjects never tried to use both blue and yellow to neutralize). Similarly, the value of red used is plotted as positive and green is negative. This was for the convenience of visualizing the data.

Fig. 11 Chromatic valence functions for the CIE standard observer. Observers view a monochromatic test light to which is added one of the four unique hues (blue, green, yellow, and red). The task of the observer is to adjust the intensity of the unique hue to make the test light appear either neutral between blue and yellow or neutral between red and green. At each test wavelength, a positive red value means the observer added green to neutralize the color. A negative green value means red was added. Similarly, a positive yellow means blue was added and a negative blue value means yellow was added. The curves show the relative amounts of red, green, blue, and yellow perceived in each wavelength of the spectrum. They also show that no wavelength is perceived to simultaneously contain both red and green, or both blue and yellow. For example, a 600-nm light, which appears “orange,” required the observer had to add green light to cancel the red component of the stimulus and blue light to cancel its yellow component. (From Wyszecki G, Stiles WS: Color science. Concepts and methods, quantitative data and formulae. New York: John Wiley and Sons, 1982. Copyright © 1982 Wiley-Liss, Inc., A Wiley Company. Reproduced with permission of John Wiley and Sons, Inc.)

Notice from Figure 11 that short wavelength stimuli appear to have a significant amount of red because some of the green cancellation stimulus was needed to produce a non-colored appearance in the test patch. The unique hues (those hues that contain no trace of any other hue) can be found by locating the crossing points for each opponent mechanism. This is the point where the observer switched from adding green to adding red to neutralize, or switched from adding yellow to adding blue. The red–green mechanism has a zero value at approximately 475 nm (unique blue), and again at approximately 580 nm (unique yellow). The blue–yellow mechanism has a zero crossing at approximately 500 nm (unique green), and it approaches a second zero crossing at very long wavelengths. However, most observers agree that even very long wavelength lights appear to contain a little yellow, and unique red is therefore non-spectral, realized by adding unique blue to a long wavelength light.

COLOR NAMING EXPERIMENTS AND COLOR OPPONENCY

The original observation that colors appear in opposed pairs can be quantified using color naming studies. In a color naming experiment, an observer is presented with a spectral color and asked to name it using any combination of the terms red, green, yellow, and blue. Despite no restrictions being placed on which color names could be used together, observers rarely or never use red and green simultaneously or blue and yellow simultaneously. Thus, color-naming functions support the data from hue cancellation experiments. Interestingly, when the color of a small target presented in the visual periphery is assessed in this manner observers report that the color appears desaturated (pale or pastel) and of uncertain color.49 If the target size is increased however, a full range of peripheral hues is found, comparable to at the fovea. This suggests that peripheral color vision for large stimuli is similar to foveal color vision for small stimuli.

Back to Top
INHERITED ANOMALIES OF COLOR VISION
Normal trichromacy is the ability of the eye to precisely match any color by mixing three primary colors. However, there are a number of anomalous conditions of color vision, including anomalous trichromatic, dichromatic and monochromatic (achromatic) forms that require three, two, and only one primary, respectively, to match any color.

COLOR BLINDNESS

Rod monochromats are individuals totally without cones, or only a few scattered remnants. They represent less than 1 in 30,000 of the population and there are approximately equal numbers of males and females. Rod monochromats can match any color with any other color by simply adjusting the intensity of one of the colors

The condition of blue cone monochromacy, in which an individual has rods and S cones but no L or M cones, is an even more rare X-linked stationary condition. Like rod monochromats, these patients have poor acuity, variable nystagmus, photophobia, but some residual color vision. The remaining color vision is based on a comparison of signals from rods and S cones.50,51 Distinguishing these patients from rod monochromats is useful because unlike the rod monochromats, for whom a deep red filter is extremely helpful for vision, the blue cone monochromats are helped more by a magenta filter that allows some blue as well as red light through it. Both types of monochromat have stationary vision throughout life and should be distinguished from patients with loss of all color vision from a progressive degenerative cone condition.

COLOR DEFECTIVENESS

Color-defective vision occurs in almost 10% of all males and almost 1% of females as a sex-linked recessive hereditary condition, explaining the higher prevalence of these hereditary red–green color defects in males. These so-called red–green defectives may be trichromatic, having two normal and one anomalous cone pigment, or dichromatic with only one of the normal two long wavelength cone pigments. For simplicity, we consider there to be a single M and a single L cone photopigment in the normal population. The anomalous or missing photopigment is either the L (protan defect) or M (deutan defect). A much rarer hereditary color-vision deficiency is presumed to involve the S photopigment (tritan defect). The prevalence of hereditary color-vision defects is shown in Table 2.


TABLE 2. Classification and Incidence of Color-Vision Defects


Dichromats have severe color defectiveness and are relatively common. Two percent of males and less than 0.02% of females can match all colors with a mixture of only two primary colors as a direct result of having only two functional cone photopigments. Protanopia (1% of males) and deuteranopia (1% of males) are the conditions in which the observer lacks the L or M cone pigment respectively. The genes controlling the structure and expression of the M and L photopigments are found on the X chromosome.

The short wavelength sensitive (S) cone photopigment is controlled by a gene(s) on chromosome number 7. Tritanopia, the lack of functional S cones as an inherited condition, results from a small number of point mutations in the gene coding the S cone opsin. The defects follow a dominant inheritance pattern and the incidence is rare, estimated at 1 in 50,000 to 1 in 15,000.

Anomalous trichromacy, with mild to medium color defectiveness, is the most common color defect. Approximately 6% of males and less than 0.4% of females are anomalous trichromats. They use different proportions of the three color primaries to match a colored test light. This is because one of their cone pigments has an abnormal spectral absorption. Figure 12 shows, schematically, the photopigments of the color defectives

Fig. 12 The photopigments of normal (LWS, MWS, SWS), dichromatic (protanope, MWS/SWS only; deuteranope, LWS/SWS only), and the displaced photopigments of the anomalous trichromats (protanomalous and deuteranomalous) eyes.

The first important studies of hereditary color-vision defects were by Seebek, who identified two forms of dichromacy, and Lord Rayleigh, who went further to identify two forms of anomalous trichromacy.52,53 The terms protanope and deuteranope were coined by Seebek in 1837 when he first distinguished between these two forms of dichromacy.52 The anomalous trichromats were identified by means of an instrument called the anomaloscope, which requires the subject to adjust a mixture of red and green light until it matches a standard yellow light. The anomalous trichromats differed from normal trichromats in requiring either more red (protanomalous) or more green (deuteranomalous) in the mixtures with which they matched the standard yellow light. This matching task administered by Rayleigh has become the basis of classifying hereditary red-green color defectives, and the anomaloscope is still considered the reference color-vision test against which newly devised tests are compared.

Back to Top
COLOR DISCRIMINATION: NORMAL AND ABNORMAL
It is possible to describe a color by three attributes: hue, saturation, and lightness. It also is possible to test the degree to which normal and color defective eyes can make distinctions within each of these attributes. The color discrimination of color defectives differs from normals for most of the attributes of color-hue discrimination, saturation discrimination, and even spectral luminosity (for approximately 25% of color defectives).

HUE DISCRIMINATION

There are two regions of the visible spectrum in which the ability to discriminate between adjacent wavelengths is at a maximum for normal eyes (Fig. 13). In these two regions, approximately 490 and 590 nm, there need be only a 1- or 2-nm difference between wavelengths for them to be seen as different! Wavelength discrimination (hue discrimination) is less acute in the middle of the spectrum and deteriorates rapidly at the ends of the spectrum. These measurements typically are made by comparing two adjacent patches of essentially monochromatic light (usually half fields of a circular patch) in which the two colors are carefully equated in brightness so that brightness differences do not form the basis of the discrimination.

Fig. 13 Wavelength discrimination of normals and dichromatic protanopes and deuteranopes. Over the entire spectrum these dichromats have inferior wavelength discrimination when compared with normals (also shown); dichromats have best wavelength discrimination in the region that appears blue–green to normals (approximately 495nm) and no wavelength discrimination for wavelengths beyond approximately 530 nm. Normals have best wavelength discrimination at approximately 490 nm and 590 nm.

As Wright has pointed out, the curve has the characteristics that might have been anticipated from looking at the spectrum (as was demonstrated at the beginning of the chapter).54 The part of the spectrum in which maximum wavelength discrimination occurs is where the colors appear to be changing most rapidly. In the yellow region (590 nm), there is a rapid change to red on one side and green on the other; in the blue–green region (490 nm), there is a rapid change to blue on one side and green on the other.

To distinguish lights that differ only in wavelength, the ratio of each of the cone receptor outputs must be compared for the two lights. One might consequently expect this ratio to be changing most rapidly in the spectral region in which the spectral sensitivity functions intersect or are changing most rapidly with respect to each other. As expected, “cross-points” are close to the spectral regions where the best hue discrimination occurs. In color-vision defectives who lack a cone pigments and therefore lack one of the crossing points, there is the expected loss of hue discrimination in that spectral region.

Typical hue discrimination curves for severe color defectives are also shown in Figure 13. Notice that dichromatic wavelength discrimination is considerably worse than for normals and only approaches the normal value in the normal's blue–green (490 to 500nm) region of the spectrum. The red–green dichromat (protanope and deuteranope) is essentially a monochromat for wavelengths greater than 530 nm, which results in greens, yellow, oranges, and reds being indistinguishable in many situations.

The anomalous trichromat, whether protanomalous or deuteranomalous has a similar but less severe deficiency in wavelength discrimination ability in the same region of the spectrum. The anomalous trichromat may have wavelength discrimination close to that of the dichromat (extreme anomaly) or almost identical with that of the normal eye (simple anomaly).

These facts could have been predicted from the presumed physiology of the color defectives. Protanopes and deuteranopes appear to lack one of the three cone pigments—L and M, respectively. Consequently, for wavelengths greater than approximately 530 nm, there is only one cone photopigment being stimulated, leaving the dichromat in a monochromatic state for that region of the spectrum. The remaining cone pigments provide a basis for hue discrimination for wavelengths shorter than 530 nm. Anomalous trichromats probably have two of their three photopigments with peak wavelength sensitivities close together on the spectrum.55 The extreme anomal, whose color vision is similar to that of a dichromat, has two photopigments for the medium- and long-wavelength spectral regions whose peak sensitivities differ only by a few nanometers. Consequently, this will result in large portions of the spectrum producing similar ratios of stimulation for the two photopigments with an accompanying loss of wavelength discrimination. Although less well studied, the hue discrimination with tritan defects fits the predictions based on the absence or displacement of the S (blue) photopigment; short wavelength discrimination is poor, and the best wavelength discrimination is found at approximately 570nm.

LUMINOSITY

The lightness or brightness of a color depends largely on the relative luminous efficiency of the component wavelengths. Under daylight or photopic light conditions, a given brightness response is produced with the least amount of incident energy in the middle of the visible spectrum. A number of experiments have shown that the normal eye has a peak luminosity function at approximately 555 nm and that luminosity falls off toward the ends of the spectrum. Under scotopic or rod-dominated light conditions, the most luminous-efficient wavelengths are closer to 507 nm. The wavelength shift of maximum luminosity from photopic to scotopic viewing is the so-called Purkinje shift. Figure 14 shows the relative luminous efficiency for these two conditions. The curves form the basis of light units (photometric and scotometric, respectively) that are used internationally.

Fig. 14 Mean luminosity curves for six protanopes and six deuteranopes. The photopic and scotopic luminosity curves for normal observers (N) are shown for comparison. The normal peak photopic and scotopic sensitivities are close to 555 and 507 nm, respectively. (Adapted from Pitt FHG: Great Britain Medical Research Council, Special Reports Series, No. 200, 1935.)

The spectral luminosity function for color defectives can be compared with that for normals (Fig. 14). Some color defectives who lack the L cone photopigment (protanopes) or have it displaced in the spectrum (protanomalous trichromats) have an abnormal spectral luminosity function and consequently perceive long wavelengths as very dim, compared with the way they are perceived by the normal eye. Many find difficulty in seeing deep-red lights in some light-emitting diode displays of hand-held electronic calculators or in seeing brake lights on automobiles during daytime driving. Cole and Brown have shown that protanopes, because of this intensity loss, have longer reaction times than normal to red traffic signals.56 These individuals find the international system of specifying light units inappropriate. Different colored lights (e.g., red and green) specified as being of equal luminance (eg, 10 cd/m2 each) will have very different brightness to their eye. All other color defectives appear to have essentially normal luminosity, although there is some disagreement about whether deuteranopes experience some luminosity loss in the green and blue regions of the spectrum.36,57 They do seem to have their peak luminosity function shifted slightly toward longer wavelengths (peaking at approximately 565 nm). This is consistent with Heath's observation that there is a gain in luminosity function for the deuteranope.57.

SATURATION

The discrimination for a third attribute of color, saturation, can be estimated by measuring how much of a particular wavelength must be added to white before the mixture is distinguishable from white. The more the wavelength must be added to make the discrimination, the less saturated it is said to be. Such experiments must, of course, carefully control for brightness so that discriminations are based only on a saturation difference.

Again, the results for normal vision could have been anticipated from a qualitative examination of the spectrum. Colors (such as yellow) that differ least from white have the lowest saturation, whereas colors like blue and red are highly saturated. Figure 15 shows the results of carefully conducted experiments that reflect the saturation of spectral wavelengths for normal eyes. Here, the number of just noticeable steps between white and the spectrum color is largest in the blue and red regions of the spectrum and decreases to a minimum at 570 nm. Many variables (eg, intensity, size, and time factors) affect saturation; the purity (the relative amount of the wavelength required in a mixture with white to distinguish it from white) usually is the most important variable.

Fig. 15 Measurement of intrinsic saturation of spectrum colors for normal, deuteranomalous, deuteranopic, protanomalous, and protanopic observers. For normal observers, wavelengths in the region of 570 nm appear most like white, whereas the ends of the spectrum are least like white. Note that for dichromats (deuteranopic and protanopic), one part of the spectrum is indistinguishable from white. Note also that poorest saturation for the anomalous trichromats is in the blue–green region; protanomals have least color saturation close to 490 nm, whereas the deuteranomals' region is closer to 500 nm. (Adapted from Chapanis A: Spectral saturation and its relation to color-vision defects. J Exp Psychol 34:24, 1944.)

While for the normal trichromat, the least saturated part of the spectrum is the yellow, and saturation increases from there toward both ends of the spectrum, dichromatic observers see one part of the spectrum as completely indistinguishable from white or gray. Saturation for them increases away from this point. This point in the spectrum is called their neutral point and falls close to 492 nm for protanopes, 498 nm for deuteranopes, and close to 571 nm for tritanopes.58,59 The saturation thresholds for normal vision and for red-green dichromats are shown in Figure 15. Anomalous trichromats have saturation discrimination similar to that of dichromats, having least saturation in the blue–green portion of the spectrum; unlike the dichromats, they have no neutral point.

Back to Top
ACQUIRED COLOR VISION DEFECTS
In recent years it has become quite clear that color-defective vision may also be acquired as a result of ocular or systemic disease and that it probably is quite common. Acquired color-vision deficiencies may be of the red–green or blue–yellow type, the latter occurring more frequently. Sometimes the color-vision anomaly is a mixed red–green and blue–yellow defect.

Acquired color-vision defects have been documented for many years, and much of the early information on the defects was summarized and classified by Kollner.60 The defect is typically acquired along with pathologic changes in the visual system secondary to disease, chemical poisoning, or injury. Much clinical data suggest that acquired red–green deficiencies are caused by lesions in the ganglion cell layers, optic nerve, and visual pathways, whereas acquired blue–yellow deficiencies are the result of lesions in the receptor and outer plexiform layers.60–62 This persistent clinical observation often has been stated as Kollner's rule. Table 3 shows examples along with a few exceptions to this rule. (The clinician should be aware that the term blue yellow defect is a misnomer. As Wright pointed out, a tritanope never confuses pure blue and pure yellow. A better term for so-called blue–yellow defects is tritan.63)


TABLE 3. Acquired Color-Vision Defects Associated With Eye Disease


ConditionColor-Vision DefectConditionColor-Vision Defect
GlaucomaB-Y  
Retinal detachmentB-YOptic neuritis (including retrobulbar neuritis)R-G
Pigmentary degeneration of retina (including retinitis pigmentosa)B-YTobacco or toxic amblyopiaR-G
Senile macular degenerationB-YLeber's optic atrophyR-G
Myopic retinal degenerationB-YLesions of optic nerve and pathwayR-G
ChorioretinitisB-YPapillitisR-G
Retinal vascular occlusionB-YHereditary juvenile macular degeneration (Stargardt's and Best's disease)R-G
Diabetic retinopathyB-Y  
Hypertensive retinopathyB-Y  
PapilledemaB-YDominant hereditary optic atrophyB-Y
Methyl alcohol poisoningB-YJuvenile macular degenerationB-Y or R-G
Central serous retinopathy (accompanied by luminosity loss in red)B-Y  

(Adams AJ: J Am Optom Assoc 45 [1]:35, 1974)


There are a number of important clinical distinctions between the acquired and hereditary color-vision defects. A history of recent color-naming difficulties is a characteristic of acquired color-vision defects not found in the hereditary condition. Patients with hereditary color-vision defects rarely misname colors. They have learned to use the same labels or names that normals use, and only in situations in which there are a minimal number of clues to the “correct” color name do they make mistakes. However, patients with recent changes in color vision typically will use incorrect color names or notice that the color appearance of familiar objects has changed. For instance, to a patient with central serous retinopathy or age-related macular degeneration, violets and blues may appear colorless or green. Given the same retinal conditions, orange and reds may both be seen as red. In retrobulbar neuritis, a patient may begin to confuse greens and yellows and oranges, calling them all yellow. To the same patient, violets and blues may both appear blue, while reds may appear dark and colorless.

The detection of a blue–yellow defect should alert the practitioner to the possibility of an acquired color-vision defect associated with ocular pathology. With acquired color-vision defects blue–yellow defects are more common. The situation is different with the hereditary color-vision defects. Hereditary red–green defects are common; hereditary blue–yellow defects are rare (perhaps 0.0001%)

Acquired color-vision defects generally affect one eye more than the other; indeed, only one eye may be involved. Consequently, such a patient will perhaps consider a carrot to be orange when seen through the normal eye and yellow when seen through the affected eye. Because of this, it is wise to test color vision monocularly and to retest with the other eye. Except in extremely rare cases, hereditary color-vision defects affect the two eyes equally. With hereditary color-vision defects, both eyes can be expected to have equal color vision and testing the second eye acts only as a retest or check procedure. The common procedure of binocular color-vision testing may fail to disclose anything more than the best color vision of the two eyes, and the monocular color-vision defect associated with eye or visual pathway disease would be missed.

Most hereditary color-vision defects are sex-linked recessive and result in confusion of reds, browns, olives, and golds with one another; pastel pinks, oranges, yellows, and greens will look similar to one another, and purples are confused with blues. Many of the available color-vision tests label these people as red-green defective (in fact, fewer than 30% of them are ever likely to confuse a pure red with a pure green). The patient with a blue–yellow defect never confuses purple with blues; and browns, golds, and olives are readily distinguished from one another. He or she does, however, confuse pastel blues with pastel green, in addition to calling some deep blues gray. Most of the available clinical tests for “color blindness” were designed exclusively for the detection of red–green defects. For example, the widely used pseudoisochromatic plate tests of Ishihara, Dvorine, and the American Optical Corporation (AOC) do not allow for testing of blue–yellow vision. The American Optical Hardy-Rand-Rittler test (AO H-R-R), the Tokyo Medical College Plates (TMC), and the Farnsworth panel D-15 tests all allow for testing of blue–yellow and red–green defects and are therefore useful in detecting all types of acquired color defects.

Testing color vision over several periods will show whether the defect changes, thus helping the clinician to differentiate between hereditary and acquired defects. Acquired color-vision defects vary in severity with the course of associated pathology. With long-standing pathology, the color defect may be both red–green and blue–yellow, making the defect difficult to characterize. Hereditary color-vision defects are constant in type and severity throughout life.

Because acquired color-vision defects generally are associated with ocular pathology, the patient usually will report other visual symptoms. Visual acuity usually is reduced (although visual acuity losses may be preceded by color-vision losses, as is the case in Stargardt disease, a macular degeneration found in young people). Visual field defects may be present, and disturbance of the macular region may be detected by other tests such as the Amsler Grid.

Many attempts have been made to identify the basis of acquired color vision defects, and most have attempted to pursue changes in vision mediated by a single cone type or by physiologic pathways thought to be biased heavily toward conveying color information (e.g., P pathways or opponent pathways). Perhaps the biggest effects of eye disease have been seen with tests directed toward testing the pathways carrying signals from the S (blue) cones.63–65 These pathways seem to be particularly susceptible to sensitivity loss relatively early in retinal or visual pathway disease. For example, in diabetes, S cone sensitivity loss occurs before irreversible complication in the eye (i.e., preretinopathy).64 The loss is selective for signals in the S cone pathways and, at least in early stages, involves neither other color pathways nor the achromatic processing of signals. The deficit is revealed under bright yellow field adaptation conditions, and experiments suggest that in addition to likely involvement of the receptors themselves, at least part of the dysfunction involves some anomaly of the sensitivity control mechanisms beyond the receptor.64,66

Figure 16 illustrates how the stimuli are presented in order to isolate the S cone vision pathways with blue flashes on a bright yellow background. This approach is also used in the more recently developed SWAP perimetry (short wavelength automated perimetry). A recent study has shown that SWAP testing may reveal as many as 20% of visual field abnormalities before retinopathy in diabetes.67

Fig. 16 Each cone photopigment has some sensitivity to light across the spectrum, although each differs from the other. Perhaps surprisingly, the blue cones (S cones) are no more sensitive to blue light than the red or green cones (upper left) .All three cones are involved in the detection of blue lights in a normal everyday environment. However, gazing at a bright yellow light (i.e., white light with blue/violet removed) desensitizes the red (L) and green (G) cones and leaves the blue (S) cones more sensitive to deep blue or violet light (lower left) when it is flashed on top of the yellow background (upper left).

These early indications of functional change before the serious and irreversible blood–retina breakdown heralded by retinopathy are important. They provide a basis for examining the efficacy of new and prophylactic treatments, a measure of the relative effectiveness of different treatments at early stages, a potential prognostic indicator, and a more functional monitor of diabetic control.

Surprisingly, the S pathway sensitivity loss at the fovea is not only associated with the more advanced retinopathic sign of edema, but it has been shown on a limited study population that it closely follows blood glucose levels of diabetic patients for minutes, hours, or months.68 As blood glucose level increases, S pathway sensitivity decreases.

Similar approaches to measuring S pathway integrity have shown sensitivity losses within the central visual field of some ocular hypertensives (OHTs) and most early primary open-angle glaucoma patients (POAG).69 A subsequent 5-year longitudinal study of OHT and POAG patients has shown that such measures are predictive of subsequent visual field loss. These were the first vision measures shown to predict individual field loss and associated ganglion cell damage. In general, short wavelength field defects are present 1 to 2 years before the appearance of defects on standard perimetry. The field defects are seen in automated perimetry to evolve or progress in regions in which short-wavelength pathway sensitivity losses had previously been demonstrated.70,71

CEREBRAL ACHROMATOPSIA

In addition to changes in color vision associated with retinal and optic nerve insult, damage to cortical areas can affect color vision. Cortical damage can cause the most pronounced and disturbing change in color vision, acquired achromatopsia (also termed dyschromatopsia). In the extreme situation, the world is perceived in black and white (monotones), even though spatial vision is largely unaffected. The most common cause of this disorder is infarction affecting the lingual and fusiform gyri, ventral to the occipital lobe.31 Often there is an associated prosopagnosia (loss of face recognition), topographic memory loss, and a superior altitudinal field defect caused by concurrent damage to the inferior tip of striate cortex. Several interesting observations have been made regarding color processing in these individuals, but caution must be exercised in grouping all cases together because lesion sizes and sites vary, and the more specialized the testing, the more heterogeneous the population appears. A few interesting cases are briefly described. Reviews of this subject are by King-Smith72 and Plant.73 For an historical perspective, see Zeki.31

One patient described by Young and Fishman perceived no color and could identify no plates of the Ishihara color test other than the demonstration plate.74 Increment threshold test conditions, which in normals reveal S cone function, revealed M cones in the patient. The authors suggest that the lack of measurable S cone activity is consistent with S signals traveling along chromatic pathways only. Because this is the damaged pathway, there is a selective blindness to S cone signals. Although the M cone branch of a threshold-versus-radiance curve was measurable, the signals were presumably detected through a luminance pathway and were incapable of producing a color percept. In an individual who clearly behaves differently to the first case but in whom there also is no evidence of color perception, Mollon has reported all three cone mechanisms (π3, π4, and π5) by increment thresholds.75 Apparently the retinal machinery is present, but later areas are not able to make use of the information to generate colors. Some cerebral achromats are able to correctly identify plates of the Ishihara test.76,77 The explanation here is that the system is intact at least to the stage from which form information is extracted on the basis of chromatic contrast, but that beyond this, the associated color percepts of the objects cannot be accessed or created by the patient. When asked how the patient knows there is a color figure on an Ishihara plate when he or she can see no colors, the patient will claim there is a “texture” difference. Some of the differences between observers may be caused by testing at different light levels. Abnormal reductions in high- and, in particular, low-contrast visual acuity have been demonstrated in an achromat when luminance is reduced.78 The performance of this individual on standard clinical color tests also was quite dependent on light level. This effect of light level has perhaps been neglected when gauging the extent to which color pathways are selectively damaged in this disorder.

Back to Top
A METRIC FOR COLOR SPACE: PREDICTING ABNORMAL COLOR VISION IN THIS SPACE

TRICHROMACY OF NORMAL VISION

The fact that the normal human eye can match any color by the mixture of three other colors (none of which can be mixed to match the third “primary” color) is what leads to the conclusion that normal vision is trichromatic. James Clerk Maxwell in 1855 provided the first quantitative data on trichromacy. He used a spinning top to additively mix colors and determined the relative amounts of various primaries needed to match a reference white.5 It should be clear that trichromacy is an empirical finding and it implies that there are three fundamental variables or channels, the relative outputs of which determine our color matching behavior. It does not state that there are three cone pigments, although this is certainly an appealing and simple connection to make. Conceptually one will not go far wrong in making this connection.

A more recent approach is to use a fixed set of primaries and to determine the relative amounts of each needed to perfectly match all visible wavelengths in turn. In 1931 a set of color mixing data was adopted by the CIE (Commission Internationale d'Eclairaige) as the Standard Colorimetric Observer with red, green, and blue color primaries (RGB) This was the first step in deriving an internationally recognized color system based on human visual performance. The CIE 1931 RGB system could be used to specify colors as seen by the human eye. The amounts of these three RGB primaries allowed specification of the color matches of the monochromatic wavelengths across the spectrum assigning them “tristimulus values.” In specifying any colors the relative amounts of these primaries (r, g) required to match a color can be used to generate a two-dimensional chromaticity plot.

In the RGB system of colorimetry, some colors have a negative chromaticity coordinate. This tends to occur when attempting to make a match to many blue–green lights. However, conversion of one set of primaries to another is simply matrix algebra and there are solutions in which the color matching functions are all positive. In these cases, the primaries lie outside the spectral locus, which means that they are unrealizable or imaginary primaries. This has been performed by the international community with the CIE 1931 XYZ system. It has no negative numbers. The XYZ system has one further feature. The spectral shape of the tristimulus values of the Y primary, for the equal energy monochromatic spectrum, was chosen to match the CIE 1924 luminosity curve. Consequently, two samples with same Y tristimulus values are defined as having equal luminance, regardless of their Z and X values. This means that luminance can be derived by calculating the total amount of Y primary in the XYZ mixture required to match the color that is being specified. Again, the amounts of each of these three XYZ primaries needed for color matches of the individual monochromatic wavelengths across the spectrum allows specification of their “tristimulus values” (Fig. 17).

Fig. 17 The XYZ color matching functions (tristimulus values) for the equal energy monochromatic spectrum.

In specifying any other colors the relative amounts of these primaries (x, y) required to match a color can be used to generate a point in the two-dimensional x, y chromaticity plot (Fig. 18).

Fig. 18 CIE chromaticity diagram. The relative amounts of each of the X, Y, and Z primaries in a mixture required to match that color are expressed as chromaticity coordinates (x, y, z). Because the coordinates represent relative amounts of primary [e.g., x = X/(X + Y + Z)], only two of them are required to specify the chromaticity of a color; the luminance quantity is expressed separately as the Y value. Two chromaticity (x, y) coordinates allow this color specification in a two-dimensional space. The z axis is in the plane of the observer. (Adapted from an oil painting by L. Condax; reproduced with permission.)

Any color can be specified in this XYZ color space, and this notation is the most commonly adopted in describing conditions for experiments in color vision and identifying colors used in color vision testing procedures. It also finds wide application in industry and agriculture.

A fundamental property of this space and of all color spaces is that the mixture of any two colors results in a color located in the color space somewhere along the line joining the two mixture colors. Similarly, a color resulting from the mixture of three colors will be found in the area bounded by the three colors. In that sense, the only colors available on a color TV or computer screen are those falling within the triangle formed in the color space by the locations of the colors of the three phosphors or primaries used to generate the colors.

Because one set of color matching data from a set of primaries can be readily converted to the matches for another set of primaries as a result of observed laws of color additivity (Grassman's laws) there is considerable freedom in choosing a set of primaries for color specification. Of all the possible sets of color matching functions, there is one particular set that corresponds precisely to the spectral sensitivities of the three response systems in the eye that are responsible for trichromatic behavior. Therefore, it is convenient to think of color matching functions as being functionally equivalent to the spectral sensitivities of the cones, despite acknowledging that trichromacy in not necessarily imposed by three cone pigments.

COLOR-DEFECTIVE VISION: DICHROMACY

This consideration in the context of spectral sensitivities of the cones makes it easier to understand how the colors within the normal's color space collapse in a very predictable way for color defectives who behave as if they have only two of the three cone types (dichromats) and can match any color with just two color primaries.

In any trichromatic color space, such as CIE XYZ, one can identify lines running through the color space along which colors appear identical for dichromats. These are called confusion lines. For color normals, colors continually change along these confusion lines entirely because of the changing absorption in just one of the three photopigments. The absorptions in the remaining two cone types are constant.

If that one cone photopigment is missing, then there is no cue to the color changing along the line. Each of the 3 dichromat types has different confusion lines Confusion lines allow us to predict which colors will be indistinguishable from each other for a particular type of dichromat. See Figures 19 and 20.

Fig. 19 Color space and confusion lines for protanopes, deuteranopes, and tritanopes. The points on the chromaticity diagram from which the confusion lines fan out are called the copunctal or convergence points.

Fig. 20 Confusion lines for colors used against a gray background in plate (#17) from a new version of a common book test (AOHRR) shown at bottom. Note the colors near the spectral locus (left side) for the confusion line that passes through gray (white) for protanopes (top) and deuteranopes (middle). They differ slightly, but enough to distinguish these dichromats from each other. With this plate in the actual book test (illustrated bottom) each sees only one of the two symbols. Reproduced with permission from Richmond Products Inc, Boca Raton, FL.

Consequently, the CIE chromaticity diagram with the appropriate confusion lines allows us to understand which colors are confused by dichromats. These confusion lines provide a rational basis for designing and interpreting clinical tests of color vision (see next section).

With the advent of carefully controlled color presentations on computers it is possible to expand the kind of stimuli used in both clinical and research applications. Today researchers are able to stimulate different physiological important color pathways selectively and control the luminance of the stimuli while changing the shape and timing of stimuli quite precisely. This has significant implication for the clinical study of color vision in eye disease where we have already seen that color perception losses are often specific to the blue cones or to color pathways. A detailed example is shown in Figure 21.

Fig. 21 A: Three-dimensional color space for specification of cone stimulation. The three orthogonal axes in are constant S along which only L and M cone stimulation changes, constant LM along which only S cones are modulated (i.e., a tritanopic confusion axis), achromatic or luminance along which the sum stimulation of all three cone types changes, but not their relative excitations. Any modulation can be specified by the azimuth (ϕ) and elevation (Θ) of the vector joining the origin and a point on the surface of the sphere. The shaded area indicates the isoluminant plane through the achromatic origin. (Adapted from Derrington AM, Krauskopf J, Lennie P: Chromatic mechanisms in lateral geniculate nucleus of macaque. J Physiol Lond 357:241, 1984) B: Actual color variation in the isoluminant plane noted in A. C: Polar plot of the VEP responses from a patient with a history of central serous choroidopathy. The ratios of the amplitudes (affected eye to unaffected eye) are plotted as a function of direction in the isoluminant plane. The inner circle indicates a ratio of 1 (i.e., equivalent amplitudes in each eye). D: Same as in C except the difference in latencies between the eyes is plotted (inner circle = zero difference; second circle = 20-msec difference).

Back to Top
COLOR VISION TESTING IN CLINICAL PRACTICE
A large number of color-vision tests are available for use in clinical practice. Unfortunately, as mentioned previously, many were designed for the relatively common hereditary red–green defects and do not allow for the testing of blue–yellow defects. Further, some of the tests have limited usefulness in grading the severity of the defect.

BOOK TESTS

Perhaps the most common form of test is the pseudoisochromatic plates. The Dvorine, Ishihara, AOC, AO H-R-R, and TMC plate tests are used most frequently in this country.79 All of these tests consist of plates made up of colored dots. In general, the colored dots are arranged so that to the normal eye the grouping of certain colors produces a figure. The figure usually is a number or a symbol, but in some of the tests (e.g., Ishihara and Dvorine) winding paths also are used for testing illiterates or children unfamiliar with letters. The dots of the figures and background cover a wide range of lightness values so that the recognition of the figure can be made only by color discrimination of either hue or saturation.

Book or plate tests have been remarkably successful in detecting color defective vision. The colors of the figure and background are carefully chosen to lie close to confusion lines in color space. For example, many figures on the Ishihara Color Plate Test use a reddish, orange, and yellow dotted background within which is embedded a green number made up of dots with the same range brightness (so the number cannot be detected by brightness difference alone). Color defectives may be unable to discriminate the green number from the background because both color sets lay close to one of their confusion lines, and therefore the number is hidden. Ishihara book tests have one or more diagnostic plates on which the color normal sees both a red and a purple number on a gray background. These plates help distinguish protan from deutan observers.

In the nonspectral purples, the dichromat has a zone that is indistinguishable from gray. A number of color-vision tests are designed to take advantage of the color defective's confusion of grays with purples and blue-greens. Figure 15 shows the small but significant difference in the most neutral spectral locus for the two red–green color defectives. This difference is enough to allow relatively clear distinction between protan and deutan defects in color-vision tests.

ARRANGEMENT TESTS

Two very useful tests are the Farnsworth-Munsell 100-hue test and the Farnsworth D-15 test. Both tests are made from colored papers in the Munsell color system. The Munsell colors are widely used as reference colors in industry and agriculture and the textile industry. It is arguably the most popular color specification system based, again, on three attributes—consistent with the trichromatic nature of normal color vision. The Munsell method of identifying colored surfaces (H V/C) locates a color in terms of three subjective attributes—hue (dominant spectral color), value (lightness), and chroma (lack of whiteness). All colors in the Munsell system are represented in a cylinder with 100 hues arranged and named around the circumference, with the lightest value at the top of the cylinder and the highest chroma on the outside of the cylinder (Fig. 22).

Fig. 22 The Munsell color system. Object colors are specified on scales of hue, value, and chroma. The hue dimension is located on the circumference of the cylinder. Any vane on the model represents a particular hue. Beginning with 10 basic color names, designating each as having 10 steps or gradations to the next color (e.g., R through 10 R for basic red to the next named color), the system ends up with an array of 100 hues around the circle. These carry symbols corresponding to color names (red, yellow, green, blue, purple) with combination names for each adjacent color in the circle. The value dimension is indicated by moving up or down the cylinder for a given hue. (Colors aligned horizontally all have the same value.) The lightest expression of that color (highest value) is at the top of the cylinder while the darkest is at the bottom. The chroma dimension, which has to do with the degree of saturation of the color, is indicated by how far a particular hue is from the axis of the cylinder. (Colors aligned vertically all have the same chroma.) At the axis a particular color, such as red, would be completely desaturated and would look white or gray to the eye. For each step outward, the color becomes increasingly saturated. On the circumference, as far out from the axis as possible, the color would look as vivid as possible. Because of manufacturing difficulties in producing surface colors, not all hues can be produced with the same chroma, and the Munsell cylinder consequently begins to look like a tree. All steps within a scale are intended to represent equal visual scale intervals for a normal observer. (Model by All-Color Company, Inc.; reproduced with permission of Lorain Fawcett, President.)

These Munsell surface colors will appear to change with changes in the spectral energy distribution of the light source illuminating them; consequently, their location on the CIE diagram (chromaticity coordinates) has been specified with standard illuminants. The Munsell colored papers cover a wide range of colors and are widely used in medicine and industry.

FARNSWORTH-MUNSELL 100-HUE TEST

The 100-hue test consists of 85 colored papers, selected from the Munsell hue circle, mounted in plastic caps. The 85 different color caps are selected to represent equal steps of color difference around a complete color circle. The caps are divided into four groups. Each group is assigned to a separate tray representing a quadrant in the color circle. The test is designed as a hue discrimination test, so the caps differ only in hue, being of equal saturation and of more or less constant level of luminance. The subject is given one tray at a time and allowed 2 minutes with each tray to arrange the colors in serial order according to their hue; color defectives produce errors in characteristic sections of the color circle. The total number of errors and their position on the color circle suggest the diagnosis of the type of the defect and a measure of the severity. The 100-hue test is one of the few tests that allows the grading of the performance of normal color-vision patients into superior, moderate, and poor hue discrimination. Results of this test can be used in the same way as one might grade stereoscopic acuity among patients who have stereopsis. However, because of the time required to administer the test (15 to 20 minutes), it is unlikely to be of practical use for routine testing of color vision.

FARNSWORTH D-15 TEST

Perhaps the most clinically useful test is the Farnsworth Panel D-15 test (Figs. 23 and 24) and its related desaturated versions of the test. It was designed to dichotomize patients into those who are unlikely to experience difficulties with their color vision and those that are likely to have difficulties with colors. It is therefore a relatively easy test to pass for many anomalous trichromats but it will fail almost all dichromats (Fig. 25). In many respects it is a miniature version of the 100-hue test, consisting of 15 caps that form a color circle. As in the 100-hue test, the caps are to be arranged in serial order according to hue. However, it is different in principle in that it allows the patient the opportunity to confuse colors across quadrants of the color circle. For instance, reds can be confused with blue–greens. It is this feature that provides the diagnostic red–green and blue–yellow failures. In the more severe cases (dichromats), the arrangement of the caps is essentially along the confusion lines of color space discussed earlier in this chapter. A common clinical situation then is for a young male to fail the Ishihara plates but pass the D-15 arrangement test. This almost certainly indicates anomalous trichromacy, but without the axis of the errors on the D-15, there is no indication whether the protan or deutan variety is present. Protanopes and deuteranopes will fail both the Ishihara and D-15 tests, and their error axis will be diagnostic of these conditions.

Fig. 23 The Farnsworth D-15 panel test (bottom of figure) and the AO-HRR pseudoisochromatic plate test. In the D-15 test, one of the 16 caps (the reference blue–violet cap) is fixed. The remaining 15 caps are to be arranged in sequential hue order. Each cap is numbered on the back.

Fig. 24 Typical scores on the Farnsworth D-15 panel test for normal, protan, tritan, and deutan observers. The connecting line indicates the cap arrangements of the patient, and the orientation of the lines suggests the diagnosis of the type of defect.

Fig. 25 Scores on the Farnsworth D-15 panel test for deutan and tritan color defectives. For the deutan, caps 1 and 15 look more alike than caps 1 and 2 and are consequently placed side-by-side by deutan observers. Caps 1 and 15 lie along the same confusion axis of the deutan (see color in Fig. 4). By contrast, the tritan sees caps 7 and 15 as more alike than caps 7 and 8. The orientation of the errors is indicative of the type of color defect.

The D-15 test has the advantage that it was never intended to screen normals from defectives, but rather is intended to separate those likely to be handicapped by their defect (moderate and severe defects) from those unlikely to experience difficulty with colors (mild defectives and normals). Linksz has claimed that “any subject who passes this test should have no difficulty in performing almost any task in which color vision is a factor, even if a more stringent test might have labeled him color defective.”80 This distinction makes it possible to give patients meaningful counseling on their color-vision problems. All too frequently a patient with a mild color-vision defect has been advised that he or she is color blind because of failing a pseudoisochromatic plate test. Less than half of those who fail plate tests have significant practical problems as a result of their defect. Two tests deserve further attention at this time.

ANOMALOSCOPE

The first is the anomaloscope. As mentioned previously in this chapter when discussing Rayleigh, the matching task in the anomaloscope (a mixture of red and green adjusted to match a yellow) has become the basis for classifying hereditary red–green color defectives. Most other color-vision tests are evaluated using the anomaloscope as the reference test. The Nagel anomaloscope (named after the original designer of the instrument) allows for the identification of red–green color deficiencies; the Pickford-Nicolson anomaloscope allows for the detection of blue–yellow and red–green defects. Neither of these forms of the anomaloscope often is found in the practitioner's office. The high cost seems to have been the limiting factor. However, inexpensive and spectrally pure light-emitting diodes can lead to the availability of relatively inexpensive commercial models of the anomaloscope suitable for office use by the practitioner.

Another test also deserves mention. The Sloan achromatopsia test is one of the few tests for total color blindness. The test uses six highly saturated standard Munsell colors from around the color circle. Each color is compared with a graded series of gray samples. Only achromats can make a satisfactory match of the color to one of the grays. Achromats make characteristic lightness matches; normals and color defectives can never satisfactorily make the match.81

There are many other tests of color vision for screening, diagnosis, occupational fitness, and color aptitude. Such tests as the Holmgren wool test, Nagel charts, Stilling charts, the Rabkin and the Bostrom-Kugelburg charts, the Lovibond test, the Roth 28-hue test, various lantern tests (e.g., Sloan color-threshold test and the Farnsworth New London Navy lantern), and the Inter-Society Color Council color aptitude test are all well-described elsewhere.82,83

TESTS OF TOTAL COLOR BLINDNESS

Something should be said about truly color blind patients, i.e., monochromats, many of whom completely lack the ability to distinguish between wavelengths in the spectrum. These individuals are quite rare; despite this, the more common of two types is called a typical monochromat (the rod monochromat or achromat). The rod monochromats, in addition to being color blind, are photophobic, exhibit nystagmus, and have low visual acuity; all these characteristics are consistent with the assumption that they possess only rod receptors. Their luminosity curve, as expected, peaks close to 500 nm, and dark adaptation does not show the initial cone portion of the curve seen in normals.81 Rod monochromatism is a simple autosomal recessive characteristic. Its prevalence is almost the same in both sexes.

Several standard clinical tests are useful in the diagnosis of rod monochromatism. These include the ERG (which reveals essentially normal rod responses but no cone responses), acceptance of the full range of red–green matches on the Nagel anomaloscope with scotopic brightness matches, a scotopic luminosity function using the Sloan achromatopsia test, and failure on color plate tests such as the Ishihara and the H-R-R series. Typical rod monochromats are further divided into complete and incomplete varieties. Complete rod monochromats show no evidence of functional cones, whereas the incomplete variety does. The clinician should be aware that using the aforementioned test battery will not distinguish between complete and incomplete achromats, including the X-linked or blue cone monochromats. More sophisticated testing, including spectral sensitivity measures and large-field or high-intensity color matching, are needed to detect the hidden cone function in many of these individuals. Approximately 60% of clinically classified autosomal recessive rod monochromats have some identifiable cone function.84 Blue cone monochromats are easily distinguished from the autosomal variety using the Berson test.85 This test requires the subject to identify one blue arrow among three scotopically matched green arrows. Several plates are shown, each with slight variations in the chromaticities of the arrows to allow for individual variations in media spectral filtering. Rod monochromats (complete and incomplete varieties) all fail at least one of the plates, whereas blue cone monochromats easily identify the blue arrow on all plates. Cone monochromats, known as atypical monochromats, are indeed rare and may have good visual acuity.

CLINICAL SELECTION OF COLOR-VISION TESTS

Each practitioner should understand and be prepared to test for both red–green and blue–yellow defects (the latter primarily to detect acquired color vision losses), detect the presence or absence of normal color vision, and assess the severity of the defect. Most of the common, pseudoisochromatic plate tests do not allow the first and are very limited in the third. All of those mentioned in this chapter are excellent screeners of normal and defective color vision for the hereditary red–green defect. Only the AO H-R-R plates provide for the first, second, and third. The Farnsworth D-15 test satisfactorily accomplishes both severity and diagnostic aspects of color-vision testing and provides an excellent basis for patient counseling. An excellent color-vision testing battery is provided by the combination of a pseudoisochromatic plate test and the D-15 (see Fig. 23). The pseudoisochromatic plate test screens out the 95% of the population who have normal color vision. For the 5% of the population who are color defective, it is appropriate to do further testing using the D-15 to estimate the degree to which the defect is likely to be of practical significance.

Pigment tests (such as those mentioned in this chapter) depend on controlled lighting for their successful application. All of the tests should be performed with “daylight” conditions with not less than 20-foot candles illuminating the plates. Unfortunately, natural daylight varies in quality tremendously from day to day, and the results of color-vision tests vary with the color temperature of the light; more test-plate errors are made as the color temperature increases. If the color temperature of the light is too low (as is the case, for example, when using ordinary tungsten lamps), color-defective patients, particularly those with deuteranomaly, begin passing the screening tests. The MacBeth easel daylight lamp is a suitable light source and is widely used in clinics and research institutes. However, ordinary daylight fluorescent lamps are a satisfactory alternative for most clinical purposes. Most of the pigment tests should be performed at approximately arm's length, in the absence of glare. Glare is best avoided by placing the test plates at 45 degrees to the light source and perpendicular to the patient. Instructions for most color-vision tests include recommended time limitations, and these should be adhered to for valid results.

PATIENT SELECTION

Color-vision testing is obviously not required in every patient's examination. However, we suggest the following general guidelines for patient testing:

  All children at an early age. Testing should be performed prior to the first grade. Color is used as an aid in teaching mathematics and English. Children who have difficulty distinguishing colors may be misdiagnosed as having learning difficulties unless it is known that they have a color-vision defect.
  All patients on their first office visit. To establish a baseline from which color changes may occur (in acquired color-vision defect), monocular testing should be performed during the patient's first office visit.
  All patients with an undiagnosed low visual acuity. A number of macular disturbances are associated with minimal fundus signs. Many of these patients have minimal acuity loss in the early stages and otherwise have very few symptoms. An acquired color-vision defect would suggest ocular disease. In the case of a middle-aged patient with only slight lowering of acuity in one eye and non-pathognomonic fundus signs, a clinician might have difficulty distinguishing among senile macular degeneration, retrobulbar neuritis, and amblyopia. However, color-vision testing is useful in the differential diagnosis; the first condition is characterized by a blue–yellow defect, the second by a red-green defect, and the third by normal color vision.
  All patients who report recent color disturbances or differences between the eyes. Because patients with hereditary color-vision defects have constant color-vision defects throughout their lives, and because they almost always have the same color vision in each eye, the occurrence of a sudden monocular color-vision defect should make the practitioner suspect some form of ocular disease.

Back to Top
CORRECTION OF COLOR-VISION DEFECTS?
Most practitioners in the past have regarded color-defective vision as incurable. Some have omitted color-vision testing from their routine examination on the grounds that the defect is hereditary, constant, and impossible to cure or correct. Clearly, acquired color-vision defects can be treated indirectly by treating the ocular disease underlying the vision changes. Most of these color-vision defects are potentially reversible in that they tend to follow the course of the disease. More important, the detection of an acquired color-vision defect may be a significant first step in the detection of the ocular disease.

COLORED FILTERS

Hereditary color-vision defects are indeed constant throughout life, and although these defects cannot be cured, it is possible to improve discrimination of some colors with the use of red filters. This fact has been known for some time, although practitioners have rarely taken advantage of it for their patients. For example, many color defectives cannot distinguish reds and oranges from greens and browns. A red filter often enables these people to make these distinctions. The difference made by the filters can easily be observed by anyone with normal color vision. Red and green objects that look equally bright with the naked eye have a brightness difference when viewed through a red filter—now the red looks very bright, and the green dark (because no green light gets through the filter). For the color defective the view through a filter may represent the first clue that the red and green are distinguishable.

We have found dichromats who will pass the Ishihara plate test if allowed to hold a red filter over one or both eyes. The normal random lightness of the dots making up the background and figure of the plate is lost when viewed through a red filter. The figure usually is made up of dots that are either more red or more green than the background. The red filter causes the figure to stand out; all of the dots making it up appear either darker or lighter than its background. Of course passing the color-vision test under these conditions does not necessarily suggest an overall improvement in color discrimination.

However, for the color defective who needs to distinguish reds from greens, the red filter may be an enormous help. Interest in the use of red filters to improve the discrimination of colored objects has been stimulated by the introduction of a red-tinted contact lens (X-Chrom) for monocular wearing.85b A number of reports suggest that some color-defective patients find this helpful.

As Schmidt has pointed out in an excellent review of visual aids for the correction of color-vision deficiencies, a useful aid for the red–green deficient is one that will enable him or her to differentiate red, green, and yellow from one another; blue and purple from each other; and reds, gray, and blue–greens from one another.86 Color filters may be used to do this in one or two ways. First, colored filters can be used for successive comparisons of the brightness relationship in the objects of regard. The red filter previously described is helpful in that way.

Second, there are filters that can change the saturation or vividness of a color. Filters of this type absorb in the neutral zone of the color defective's (blue–green) spectrum. They reduce the spectral wavelengths that would only act to desaturate the color of the object to the color defective. Schmidt has pointed out that most filters of this type are magenta, absorbing all wavelengths from blue–green to green and passing wavelengths at both ends of the spectrum.86 For the color normal, the yellow region of the spectrum is the most neutral in color, and a filter that absorbs yellow selectively (neodymium) enhances vividness of colors for normals.

With patience, the practitioner often can find solutions to occupational color-vision problems. For example, a magenta filter (e.g., Kodak Wratten filter #30) has been used effectively for color-defective students learning histology.87 The filter enhances red- and blue-stained components in the tissue. Kernell used a green (Kodak Wratten filter #57) and two red filters (Kodak Wratten filters #23 and #26) side-by-side to help workers identify color-coded resisters by successive comparisons of brightness.88 As has been noted already, a red filter (e.g., Kodak Wratten filter #29 or #26) often is useful as a first step in assessing whether a colored filter will help a particular patient cope with occupational needs. Of course there are some drawbacks to this use of filters. It is important for the practitioner to recognize that most often the color filter is creating improved discrimination of some colors (hopefully those for which discrimination is important in the patient's occupation) while reducing discrimination of others.

A series of papers by Richer and Adams89–92 explain how the shift of colors in the color space diagram, by filter manipulation, may place critical colors off the confusion axes of color defectives and thus make them more distinguishable. The research supports the more anecdotal evidence of improved color discrimination for selected colors as noted. Because the underlying cause of most color defects is an altered or absent photopigment, simply viewing the world through colored lenses does not correct this problem, and there is little reason to believe that colored filters improve the overall color discriminations of a color defective. However, if one eye receives a different color filter than the other, then there is the theoretical possibility that the brain of the color defective could learn to interpret this differential information in a way that leads to an increase in overall color discrimination abilities overall. However, in practice this has never been demonstrated.

Colored filters (including tinted spectacle lenses) should never be worn for clinical color tests. Use of a red lens to help an individual pass an Ishihara test is like allowing an individual to stand closer to the acuity chart so he can read the 20/20 line.

Back to Top
MOLECULAR BIOLOGY OF CONE PHOTOPIGMENTS

VARIATIONS IN X-LINKED PIGMENTS IN COLOR-NORMAL OBSERVERS

The genes that code for L and M cone photopigments are on the X-chromosome. There are variations in the number of L and M pigment genes in color normals, with the most common arrangement being a single L pigment gene followed by two M pigment genes.93 Furthermore, there are variations among L and M genes of color normals. Each gene codes for an opsin molecule, which is a long strand of 364 amino acids. The opsin is embedded in the cone membrane lipid bilayer, and it is folded such that the membrane is crossed seven times. The L and M nucleotide sequences have 98% identity. The chromophore, 11 cis-retinal, is attached at amino acid (Lysine) site 312, and it is weakly bound to other amino acid sites by side chains. It is the bonding relationship between the opsin and the chromophore that provides the spectral tuning of a pigment. There are 18 dimorphic sites in the amino acid sequence of X-linked pigments.94 These are shown in Fig. 26. A limited subset of these 18 sites is responsible for spectral peak location.

Fig. 26 A schematic representation of the L/M opsin molecule. Each circle is an amino acid. The colored amino acids represent those sites that are known to differ among X-linked cone opsins. Positions 227 and 285 are sites that together shift the spectral peak of a pigment approximately 20 nm. They are the determinants of whether a pigment is classified as L or M. Other sites produce smaller shifts in the wavelength of peak sensitivity. Some dimorphic sites do not appear to shift peak sensitivity in all pigments. Site 180 plays an important role in variations in normal color vision. (Reprinted form Neitz M, Neitz J. Molecular genetics and the biological basis of color vision. In Backhaus WGK, Kliegl R, Werner JS (eds): Color Vision: perspectives from different disciplines. Berlin: Walter de Gruyter, 1998:101–119. Copyright 1998. Reproduced with permission of Walter de Gruyter Gmbtl & Co. KG.)

Of the 18 dimorphic sites, two are particularly critical as the amino acids here determine whether a pigment is considered to be L or M. At positions 277 and 285, the respective presence of phenylalanine and alanine produces an M pigment whereas tyrosine and threonine produce an L pigment. The spectral separation (wavelength of peak absorption) produced by this dimorphism is approximately 20 nm.94 Dimorphic changes at five other locations produce smaller shifts in the wavelength of peak absorption. Changes at other sites may play a role in variations in normal color vision. In particular along the L pigment gene, position 180 appears important in determining color matching behavior.95 Careful measurements of the Rayleigh match in color normal men shows that the match midpoints are somewhat bimodally distributed,96 and that the distribution to which an individual belongs is determined largely by the specific amino acid (serine or alanine) at position 180 along the L opsin. Thus the L opsin contributes strongly to color vision variations among color normal males. The distribution of match midpoints for color normal females is broad, it is unimodal and it is centered on the male midpoint. This is expected if females express on average half their L pigments with alanine at180 and half with serine at 180. The important consequence, of course, is that a color normal retina that expresses two types of L pigment contains four cone pigments (two L, one M, and one S), not the classically described three. Furthermore, Sjoberg et al 97 have shown that in color normal males, more than just the first two pigment genes along the X chromosome can be expressed. In their study, 8% of color normal males expressed multiple different L pigment genes, in addition to an M pigment. Clearly, some eyes have more than three cone pigments and yet trichromacy prevails. Thus trichromacy is unlikely to be determined solely by the number of photopigments.

Variations in amino acid sequence among normal L and M pigments produce families of absorption curves with slightly different peak wavelengths. Fig. 27 shows a series of pigment absorption curves resulting from known amino acid sequences coded by L and M genes. This means that two color normal individuals might in fact have different M pigments and different L pigments.

Fig. 27 Absorption spectral of families of L and M pigments occurring in humans. The wavelengths of peak absorption are taken from Asenjo et al (1994). The small shifts in peak sensitivity are the result of changes in the amino acids shown in Figure 26.

Variations in X-linked Pigments in Common Color Vision Defects

Anomalous trichromats are those individuals who show behavioral evidence of trichromacy but who make color matches that are rejected by color normal individuals. Anomalous trichromacy is the most common form of color vision defect. Traditionally deuteranomalous and protanomalous individuals were thought to have anomalous M and L pigments respectively. The anomalous pigments were thought to have spectral peaks intermediate between the normal L and M spectral peaks.

For a long time, it has been known that there is considerable variation in color vision among anomalous trichromats of either type. An attractive notion to account for color vision variation among anomalous trichromats is that the more the spectral sensitivity of the anomalous pigment overlaps with the remaining normal pigment, the worse the color vision.98 This is termed the spectral proximity hypothesis.99 In deuteranomalous males there is a strong relationship between the spectral separation of the X-linked pigments determined by molecular biology and chromatic discrimination performance,100 confirming that spectra proximity indeed determines the magnitude of the color vision defect. As discussed , the normal L and normal M pigments come from two distinct families of pigments, rather than being canonical pigments. Thus the degree of color defect in anomalous trichromats depends on the spectral location of the “normal” pigment in addition to the spectral location of the so-called anomalous pigment.

About two-thirds of those with deuteranomaly have two different L genes followed by one M gene. However, because the M gene is the last in the array, it is not expressed.101 The first L gene is normal and the second one is chimeric, made in part from an L and in part from an M gene. It encodes the anomalous pigment but because of the specific amino acids at positions 277 and 285, it is considered to be L. Traditionally, those with deuteranomaly were thought to have an anomalous M pigment, so molecular biology suggests a change in the way we describe anomalous pigments. The reduced spectral separation of the L and the chimeric L pigments confers deuteranomaly to the subject. Interestingly, the arrangement of two L genes, one normal and one chimeric, followed by an M gene is also seen in some color normal males. Thus the “anomalous” pigment in deuteranomaly is present in some color normal males. It appears that color vision can remain normal because of the spectral peak location of the first L pigment, and the resultant spectral separation of the two expressed L pigments. The important finding here is that there does not appear to be a unique anomalous pigment underlying deuteranomaly.

Deuteranopes, for the most part are missing all genes that code for the M pigment. They typically have a single L gene on their X chromosome which codes for an L pigment that is identical in amino acid sequence to L pigments in color normal individuals. The spectral variation in normal L pigments is also seen in the L pigments of deuteranopes. Those few deuteranopes who do have an M gene have a mutation that causes the pigment to be non-functional.102

Protanomalous trichromats typically show a gene arrangement on the X chromosome consisting of a chimeric M gene (which codes for the anomalous pigment) in the first position along the array, followed by a normal M pigment gene. Unlike the situation for deuteranomaly, the anomalous pigment in protanomaly appears to be unique to color defectives, and it is not found in color normal individuals. It has been proposed that some protanomalous individuals manifest their trichromacy on the basis of an S cone pigment and two M pigments that have the same spectral peak but different optical densities.103 Increasing the optical density of a pigment broadens its spectral absorption rather than shifting the spectral peak. This small change in spectral shape of the absorption curve can be used for color discrimination.

Protanopes might be expected to express one of the normal M pigments and no L pigment. Frequently, however, protanopes have a chimeric M-pigment gene at the first position in the array, and although the amino acid sequence of this pigment is different from that of any in the family of normal M pigments, the spectral peak of the pigment is indistinguishable from a normal M pigment. Thus protan color defects seem to be associated with pigments that are not found in color normals while deutan defects typically are associated with pigments seen in the color normal eye.104

Tritan Color Defects

Tritanopia is an autosomal dominant hereditary color vision defect characterized by functional loss of the S cone photopigment. The S cone photopigment is coded on chromosome 7. Tritanopia is rare. At least three different point mutations in the S opsin gene have been shown to produce tritanopia.105,106 The point mutations are likely to disrupt protein folding as they are located in the membrane spanning regions. Whether there is a separate entity, tritanomaly, to complement protanomaly and deuteranomaly is not clear. There is evidence from color matching for an altered functional S cone photopigment in pedigrees of tritanopes,107 which suggests that tritanopia and tritanomaly might be different manifestations of the same basic genetic defect. There is probably an additional condition termed incomplete tritanopia in which there is a reduction in S cone system sensitivity, a kind of partial dichromacy. The genetic origins of tritanomaly and incomplete tritanopia are still open questions. To encompass defects within this family of disorders, the term tritan is used.

Blue Cone Monochromacy

The condition of blue cone monochromacy, in which an individual has rods and S cones but no L or M cones, is a rare, X-linked stationary condition. Subjects have poor acuity, variable nystagmus, photophobia, and some residual color vision. The remaining color vision is based on a comparison of signals from rods and S cones.50,51 Work on 12 families of blue cone monochromats has shown that there are two genetic subgroups, although there may be more.108 The first group has a single pigment gene on the X-chromosome that has an inactivating point mutation. The second group has a deletion of the locus control region (LCR) on the X-chromosome. The LCR is presumably a control site for the expression of L and M genes.

Rod Monochromacy

This autosomal recessive disorder is characterized by rod dominated vision, with complete or incomplete loss of cone function. The mutation responsible for this range of disorders appears to involve a point mutation in either the alpha or beta subunit of the cyclic-GMP gated ion channel.109,110 This abolishes phototransduction in all cone classes.

Back to Top
REFERENCES

1. Young T: On the theory of light and colours. Philos Trans R Soc Lond [Biol] 92:12, 1802

2. Helmholtz HLF von: Die Lehre von den Tonempfin-dungen als physiologische Grundlage fur die Theorie der Musik. Brunswick, Viewig, 1863

3. Hering E: Outlines of a Theory of the Light Sense. In LM Hurrich, D Jamieson (eds): Cambridge: Harvard Press, 1964

4. De Valois RL, De Valois KK: Neural coding of color. Handbook of Perception, Vol 5, Seeing. New York: Academic Press, 1975

5. Maxwell JC: On the theory of three primary colours. Lecture at the Royal Institution of Great Britain, May 17, 1861. In Niven WD (ed): Scientific Papers, Vol 1. London: Cambridge University Press, 1890:445–450

6. Baylor DA: Photoreceptor signals and vision. Proctor lecture. Invest Ophthalmol Vis Sci 1:34, 1987

7. Brown PK, Wald G: Visual pigments in human and monkey retinas. Nature (London) 200:37, 1963

8. Stockman A, Sharpe LT, Fach C C: The spectral sensitivity of the human short-wavelength cones. Vision Research , 39, 2901–2927, 1999

9. Stockman A, Sharpe LT: Spectral sensitivities of the middle- and long-wavelength sensitive cones derived from measurements in observers of known genotype. Vision Research , 40, 1711–1737, 2000

10. Rushton WAH: Visual pigments in man. In Dartnall HJA (ed): Handbook of Sensory Physiology, Vol. VII/1. Photochemistry of Vision. New York: Springer-Verlag, 1972:364–394

11. Ahnelt PK, Kolb H, Pflug R: Identification of a subtype of cone photoreceptor, likely to be blue sensitive, in the human retina. J Comp Neurol 255:18, 1987

12. Vimal RL, Pokorny J, Smith VC, Shevell SK: Foveal cone thresholds. Vision Research 29(1):61–78, 1989

13. Roorda A, Williams DR: The arrangement of the three cone classes in the living human eye. Nature. 397(6719):520–522, 1999

14. Williams DR, Collier RJ, Thompson BJ: Spatial resolution of the short wavelength mechanism. In Mollon JD and Sharpe LT (eds): Colour Vision Physiology and Psychophysics. London: Academic Press, London, 1983:487–503

15. Roorda A, Metha AB, Lennie P, Williams DR: Packing arrangement of the three cone classes in primate retina. Vision Res 41(10–11):1291–1306, 2001

16. Lee BB: Receptors, channels and color in primate retina. In Backhaus, Kliegl and Werner (eds):Color Vision; Perspectives from different disciplines. Berlin: Gruyter, 1998:79–88

17. Svaetichin G: The cone action potential. Acta Physiol Scand 29(suppl 106): 565, 1953

18. Dacey DM, Lee BB, Stafford DK, Pokorny J, Smith VC: Horizontal cells of the primate retina: cone specificity without spectral opponency. Science 271(5249):656–659, 1996

19. DeValois RL: Neurophysiology of color vision. In Chalupa LM, Werner JS (eds): The visual neurosciences. Cambridge, Mass: MIT Press, 2004

20. Dacey DM: Primate retina: cell types, circuits and color opponency. Prog Retin Eye Res 18(6):737–763, 1999

21. Mariani AP: Bipolar cells in monkey retina selective for the cones likely to be blue-sensitive. Nature. 308(5955):184–186, 1984

22. Kolb H: How the retina works. American Scientist , 91, 28–35, 2003

23. Dacey DM, Packer OS: Colour coding in the primate retina: diverse cell types and cone-specific circuitry. Curr Opin Neurobiol. 13(4):421–427, 2003

24. Diller L, Packer OS, Verweij J, McMahon MJ, Williams DR, Dacey DM: L and M cone contributions to the midget and parasol ganglion cell receptive fields of macaque monkey retina. J Neurosci 24(5):1079–1088, 2004

25. Lennie P: Color vision: putting it together. Curr Biol 10(16):R589–R591. 2000

26. Dacey DM, Lee BB: The “blue-on” opponent pathway in primate retina originates from a distinct bistratified ganglion cell type. Nature. 367(6465):731–735, 1994

27. Dacey DM, Peterson BB, Robinson FR, Gamlin PD: Fireworks in the primate retina: in vitro photodynamics reveals diverse LGN-projecting ganglion cell types. Neuron. 37(1):15–27, 2003

28. Derrington AM, Krauskopf J, Lennie P: Chromatic mechanisms in lateral geniculate nucleus of macaque. J Physiol (Lond) 357:241, 1984

29. De Valois RL, Cottaris NP, Elfar SD, Mahon LE, Wilson JA: Some transformations of color information from lateral geniculate nucleus to striate cortex. Proc Natl Acad Sci U S A 97(9):4997–5002, 2000

30. Meadows JC: Disturbed perception of colours associated with localized cerebral lesions. Brain 97(4):615–632, 1974

31. Zeki S: A century of cerebral achromatopsia. Brain 113:1721, 1990

32. Beauchamp MS, Haxby JV, Jennings JE, DeYoe EA: An fMRI version of the Farnsworth-Munsell 100-Hue test reveals multiple color-selective areas in human ventral occipitotemporal cortex. Cereb Cortex 9(3):257–263, 1999

33. Zeki S: Color coding in the cerebral cortex: The reaction of cells in monkey visual cortex to wavelengths and colours. Neuroscience 9:741, 1983

34. Schein SJ, Desimone R: Spectral properties of V4 neurons in the macaque. J Neurosci 10(10):3369–3389, 1990

35. Willmer EN: A physiological basis for human colour vision in the central fovea. Doc Ophthalmol 9:235, 1955

36. Hsia Y, Graham CH: Spectral luminosity curves for protanopic, deuteranopic, and normal subjects. Proc Natl Acad Sci 43:1011, 1957

37. Pitt FHG: The nature of normal trichromatic and dichromatic vision. Proc R Soc Lond [Biol] 132B:101, 1944

38. Blackwell H, Blackwell O: Rod and cone receptor mechanism in typical and atypical congenital achromatopsia. Vision Res 1:62, 1961

39. Brindley GS: The effects on colour vision of adaptation to very bright lights. J Physiol (London) 122:332, 1953

40. Stiles WS: Separation of the “blue” and “green” mechanisms of foveal vision by measurements of increment thresholds. Proc R Soc Lond [Biol] 133:418, 1946

41. Stiles WS: Increment thresholds and the mechanisms of color vision. Doc Ophthalmol 3:138, 1949

42. Stiles WS: Further studies of visual mechanisms by the two colour threshold method. Coloquio Sobre Problemas Opticos de la Vision: I. Conferencias Generales. Madrid: Union Internat'l de Physique Pure et Appliquée, 1953:65–103

43. Stiles WS: Color vision: The approach through increment-threshold sensitivity. Proc Natl Acad Sci 45:100, 1959

44. Wald G: The receptors of human color vision. Science 145:1007, 1964

45. Sperling HG, Harwerth RS: Red-green cone interactions in the increment threshold spectral sensitivity of primates. Science 172:180, 1971

46. King-Smith PE, Carden D: Luminance and opponent-color contributions to visual detection and adaptation and to temporal and spatial integration. J Opt Soc Am 66:709, 1976

47. Thornton JE, Pugh EN: Red/Green color opponency at detection threshold. Science 219:191, 1983

48. Hurvich LM, Jameson D: Some quantitative aspects of an opponent-colors theory. II. Brightness, saturation, and hue in normal and dichromatic vision. J Opt Soc Am 45(8):602–616, 1955

49. Abramov I, Gordon J, Chan H: Color appearance in the peripheral retina: effects of stimulus size. J Opt Soc Am A 8(2):404–14, 1991

50. Alpern M, Lee GB, Maaseidvaag F, Miller SS: Colour vision in blue cone monochromacy. J Physiol 212:211, 1971

51. Haegerstrom-Portnoy G, Verdon W: Transient tritanopia in a blue cone monochromat. Clin Vis Sci 6:229, 1991

52. Seebeck A: Uber den bei manchen Personen vorkommendon Mangel an. Ferbensinn, Ann Phys Chemic 42:177, 1837

53. Rayleigh Lord: Experiments on colour. Nature (Lond) 25:64, 1881

54. Wright WD: Researchers on Normal and Defective Colour Vision. St. Louis: CV Mosby, 1947

55. Piantanida T: Polymorphism of human color vision. Am J Optom Physiol Opt 53(10):64

56. Cole BL, Brown B: Optimum intensity of red road-traffic signal lights for normal and protanopic observers. J Opt Soc Am 56:516, 1966

57. Heath GG: Luminosity curves of normal and dichromatic observers. Science 128:775, 1958

58. Wright WD: The characteristic of tritanopia. J Opt Soc Am 42:509, 1952

59. Walls GL, Heath GG: Neutral points in 138 protanopes and deuteranopes. J Opt Soc Am 46:640, 1956

60. Kollner H: Die Storungen des Farbensinnes, ihre klinischee Bedeutung und ihre Diagnose. Berlin, Karger, 1912

61. Francois J, Verriest G: On acquired deficiency of colour vision. Vision Res 1:201, 1961

62. Cox J: Colour vision defects acquired in diseases of the eye. Br J Physiol Opt 17:195, 1960

63. Pokorny J, Smith VC, Verriest G, Pinkers AJLG: Congenital and acquired color vision defects. New York: Grune and Stratton, 1979

64. Adams AJ: Chromatic and luminosity processing in retinal disease. Am J Optom Physiol Opt 59:642, 1982

65. King-Smith PE: Psychophysical methods for the investigation of acquired color vision deficiencies. In Foster DH (ed): Inherited and acquired color vision deficiencies. Boca Raton: CRC Press, 1991:38–54

66. Greenstein VC, Shapiro A, Zaidi Q, Hood DC: Psychophysical evidence for post-receptoral sensitivity loss in diabetics. Invest Ophthalmol Vis Sci 33:2781, 1992

67. Han Y, Adams AJ, Bearse MA, Jr. , Schneck ME: Multifocal Electroretinogram (mfERG) and Short Wavelength Automated Perimetry (SWAP) Measures in Diabetic Eyes with Little or No Retinopathy. Arch Ophthalmol In press , 2004

68. Schneck ME, Adams AJ, Volbrecht VJ, Linfoot JL: Acute changes in blood glucose and their effects on color vision function in diabetes. In Drum B (ed): Colour Vision Deficiencies XI, Netherlands: Kluwer Academic Publishers, 1992:175–183

69. Heron G, Adams AJ, Husted R: Central visual field measures of blue-sensitive pathways in glaucoma and ocular hypertension. Invest Ophthalmol Vis Sci 29:64, 1988

70. Johnson CA, Adams AJ, Casson EJ, Brandt JD: Blue-on-yellow perimetry can predict the development of glaucomatous field loss. Arch Ophthalmol (in press)

71. Johnson CA, Adams AJ, Casson EJ, Brandt JD: Progression of glaucomatous visual field loss for blue-on-yellow and standard white-on-white automated perimetry. Arch Ophthalmol (in press)

72. King-Smith PE: Cortical color defects. In Drum B, Verriest G (eds): Colour Deficiencies IX. The Hague: Dr W Junk, 1989:131–143

73. Plant GT: Disorders of colour vision in diseases of the nervous system. In Foster DH (ed): Inherited and Acquired Colour Vision Deficiencies. Boca Raton: CRC Press, 1991:173–183

74. Young RL, Fishman G: Loss of color vision and Stiles' π 1 mechanism in a patient with cerebral infarction. J Opt Soc Am 70:1301, 1980

75. Mollon JD, Newcombe F, Polden PG, Ratcliffe G: On the presence of three cone mechanisms in a case of total achromatopsia. In Verriest G (ed): Color Vision Deficiencies V. Bristol: Hilger, 1980:130–135

76. Victor JD, Maiese K, Shapley R, Sidtis J: Acquired central dyschromatopsia-analysis of a case with preservation of color distrimination. Clin Vis Sci 4:183, 1989

77. Kinsbourne M, Warrington EK: Observations on colour agnosis. J Neurol Neurosurg Psychiatry 27:296, 1964

78. Haegerstrom-Portnoy G, Plant G, Verdon W: Cerebral achromatopsia: effect of ambient light level. Invest Ophthalmol Vis Sci 32(suppl):2679, 1991

79. Heath GG: Color vision. In Borish I (ed): Clinical Refraction, 3rd ed. Chicago: Professional Press, 1970

80. Linksz A: An Essay on Color Vision. New York: Grune & Stratton, 1964

81. Sloan LL: Congenital achromatopsia: A report of 19 cases. J Opt Soc Am 44:117, 1954

82. Burnham RW, Hanes RM, Bartleson CJ: A Guide to Basic Facts and Concepts. New York: Wiley, 1963

83. Lakowski R: Theory and practice of colour vision testing: A review. Part 2. Br J Ind Med 26:265, 1969

84. Haegerstrom-Portnoy G, Schneck ME, Verdon WA, Hewlett SE: Clinical vision characteristics of the congenital achromatopsias. II. Color vision. Optom Vis Sci 73(7):457–465, 1996

85. Berson EL, Sandberg MA, Rosner B, Sullivan PL: Color plates to help identify patients with blue cone monochromacy. Am J Ophthalmol 95:741, 1983

85b. Zeltzer HI: The X-Chrom lens. J Am Optom Assoc 42(9):933, 1971

86. Schmidt I: Visual aids for correction of color deficiencies. Can J Opt 38(2):38, 1971

87. Olson IA: The use of colour filters by students with congenital colour defects in the learning of histology. Med Biol Illus 21:52, 1971

88. Kernell D: A simple and inexpensive method for helping “red-green blind” persons to identify colors. Rev Sens Disability 17:9, 1974

89. Richer S, Adams AJ: “Development of quantitative tools for filter-aided dichromats”, American Journal of Optometry and Physiological Optics, 61(4):246–255, 1984

90. Richer S, Adams AJ: An experimental test of filter-aided dichromatic color discrimination. Am J Optom Physiol Opt, 61(4):256–264, 1984

91. Richer S, Little AC, Adams AJ: The effect of ophthalmic filter thickness on predicted monocular dichromatic luminance and chromaticity discrimination. Am J Optom Physiol Opt 61(11):666–673, 1984

92. Richer S, Adams AJ, Little AC: Toward the design of an optimal filter for enhancement of dichromatic monocular chromatic discrimination. Am J Optom Physiol Opt 62(2):105–110, 1985

93. Neitz M, Neitz J: Numbers and ratios of visual pigment genes for normal red-green color vision. Science. 267(5200):1013–1016, 1995

94. Neitz M, Neitz J: Molecular genetics and the biological basis of color vision. In Backhaus, Kliegl and Werner (eds): Color Vision; Perspectives from different disciplines. Berlin: De Gruyter, 1998:101–119

95. Winderickx J, Lindsey DT, Teller DY, et al: Polymorphism in red photopigment underlies variation in color matching. Nature 356:431, 1992

96. Neitz J, Neitz M, Jacobs GH: More than three different cone pigments among people with normal color vision. Vision Res. 33(1):117–122, 1993

97. Sjoberg SA, Neitz M, Balding SD, Neitz J: L-cone pigment genes expressed in normal colour vision. Vision Res 38(21):3213–3219, 1998

98. DeMarco P, Pokorny J, Smith VC: Full-spectrum cone sensitivity functions for X-chromosome-linked anomalous trichromats. J Opt Soc Am A 9(9):1465–1476, 1992

99. Regan BC, Reffin JP, Mollon JD: Luminance noise and the rapid determination of discrimination ellipses in colour deficiency. Vision Res 34(10):1279–1299, 1994

100. Neitz J, Neitz M, Kainz PM: Visual pigment gene structure and the severity of color vision defects. Science 274(5288):801–804, 1996

101. Hayashi T, Motulsky AG, Deeb SS: Position of a “green-red” hybrid gene in the visual pigment array determines colour-vision phenotype. Nat Genet 22(1):90–93, 1999

102. Kazmi MA, Sakmar TP, Ostrer H: Mutation of a conserved cysteine in the X-linked cone opsins causes color vision deficiencies by disrupting protein folding and stability. Invest Ophthalmol Vis Sci 38(6):1074–1081, 1997

103. Neitz J, Neitz M, He JC, Shevell SK: Trichromatic color vision with only two spectrally distinct photopigments. Nat Neurosci 2(10):884–888, 1999

104. Neitz M, Neitz J: Molecular genetics of human color and color vision defects. In Chalupa LM, Werner JS (eds): The visual neurosciences. Cambridge, Mass: MIT Press, 2004:974–988

105. Weitz CJ, Miyake Y, Shinzato K, Montag E: Human tritanopia associated with two amino acid substitutions in the blue-sensitive opsin. Am J Hum Genet 50:498, 1992

106. Weitz CJ, Went LN, Nathans J: Human tritanopia associated with a third amino acid substitution in the blue-sensitive visual pigment. Am J Hum Genet 51:444, 1992

107. Pokorny J, Smith VC, Went LN: Color matching in autosomal dominant color defect. J Opt Soc Am 71:1327, 1981

108. Nathans J: Molecular genetics of human blue cone monochromacy. Science 245:831, 1989

109. Wissinger B, Gamer D, Jagle H, Giorda R, Marx T, Mayer S, Tippmann S, Broghammer M, Jurklies B, Rosenberg T, Jacobson SG, Sener EC, Tatlipinar S, Hoyng CB, Castellan C, Bitoun P, Andreasson S, Rudolph G, Kellner U, Lorenz B, Wolff G, Verellen-Dumoulin C, Schwartz M, Cremers FP, Apfelstedt-Sylla E, Zrenner E, Salati R, Sharpe LT, Kohl S: CNGA3 mutations in hereditary cone photoreceptor disorders. Am J Hum Genet 69(4):722–737, 2001; Epub Aug 30, 2001

110. Wissinger B, Jagle H, Kohl S, Broghammer M, Baumann B, Hanna DB, Hedels C, Apfelstedt-Sylla E, Randazzo G, Jacobson SG, Zrenner E, Sharpe LT: Human rod monochromacy: linkage analysis and mapping of a cone photoreceptor expressed candidate gene on chromosome 2q11. Genomics 51(3):325–331, 1998

Back to Top