Chapter 111
Confocal Scanning Laser Topography of the Optic Nerve
ROBERT D. FECHTNER and FREDERICK S. MIKELBERG
Main Menu   Table Of Contents

Search

CONFOCAL LASER SCANNING OPHTHALMOSCOPY
ACCURACY
REPRODUCIBILITY
COMPARISONS WITH MEASURES OF VISUAL FUNCTION
DISTINGUISHING BETWEEN NORMAL AND ABNORMAL
DETECTING CHANGE
CONCLUSION
REFERENCES

A change in the appearance of the optic nerve is a hallmark of glaucoma. The observed changes in the optic nerve are associated with the loss of retinal ganglion cell axons (which constitute the nerve fiber layer of the retina). As the axons of the retinal ganglion cells degenerate, there is a decrease in the volume of neural tissue in the optic nerve, resulting in an enlarged optic cup and a change in topographic configuration. Detecting and diagnosing progressive damage from glaucoma depends on identifying these changes and the corresponding loss of visual function.

Clinical examination of the optic nerve has been possible since the development of the direct ophthalmoscope by Helmholz in 1851. Assessment of the appearance of the optic nerve head (ONH) is an important part of the glaucoma examination. Before the development of advanced technologies, careful comparison of simultaneous stereo-optic nerve photographs was, perhaps, the clinician's best tool for detecting progressive optic nerve damage. The photographs can be stored for subsequent study and review. Unavoidably, however, this technique is qualitative and subjective because it involves the interpretation of subtle findings by the clinician.

The need for accurate, reproducible, and cost-effective quantitative techniques of assessing the optic disc, along with appreciation of the limitations of subjective clinical observation, stimulated the development of new technologies. Many of the early innovative techniques developed for quantitative analysis of the ONH were not clinically practical. They suffered from problems with reproducibility, were cumbersome or too costly for clinical use, and did not become widely available.

Recent technological advances have stimulated the development of a new generation of instruments, the confocal scanning laser ophthalmoscopes (cSLOs) for quantitative examination of the ONH. The progress in microcomputers, diode lasers, and digital image acquisition have allowed improved capture, storage, retrieval, and analysis of optic nerve topography.

Back to Top
CONFOCAL LASER SCANNING OPHTHALMOSCOPY
Computer-assisted automated optic nerve imaging techniques have the potential to serve two important roles in the care of optic nerve disease. In the patient suspected of having glaucoma, they may distinguish between the normal disc and pathology. This is challenging, given the wide range of biologic variability. A more readily achievable goal may be to detect and quantify subtle progressive changes of the optic nerve. Although there are several strategies to detect visual field changes, all but the most obvious cases of optic nerve deterioration may escape clinical detection.

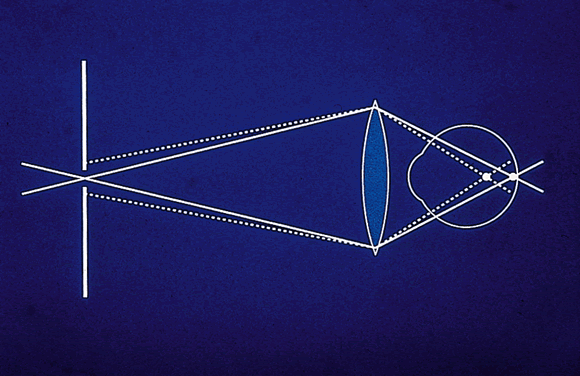
cSLOs represent an adaptation of confocal microscopy, an established imaging technology. The basic principle of confocal imaging is to illuminate through a single pinhole and image this point source on the object of interest. The light returns through the imaging optics and passes through a pinhole in a plane conjugate to the point of interest. Only light that returns from the point of interest can pass through the pinhole and be detected. Light from any point not in that focal plane will be greatly attenuated (Fig. 1). To image a plane rather than a point, an array of points in that plane must be scanned point by point. In a cSLO system, the illuminating light spot can be rapidly moved (scanned) across, resulting in a focal plane of data points or an optical section. This horizontal (x) and vertical (y) scanning is conducted using oscillating mirrors. Depth (z) is controlled (i.e., the focal plane is changed) by moving the objective lens. A transfer function is used to establish the location along the z-axis of maximum reflectivity. This is assumed to be the height at that coordinate and is used to generate the topography image.1

Fig. 1. Light reflected from the retinal plane passes through the pinhole to the detector. Light from any other plane cannot pass through the pinhole and is attenuated. This allows the creation of an optical section.

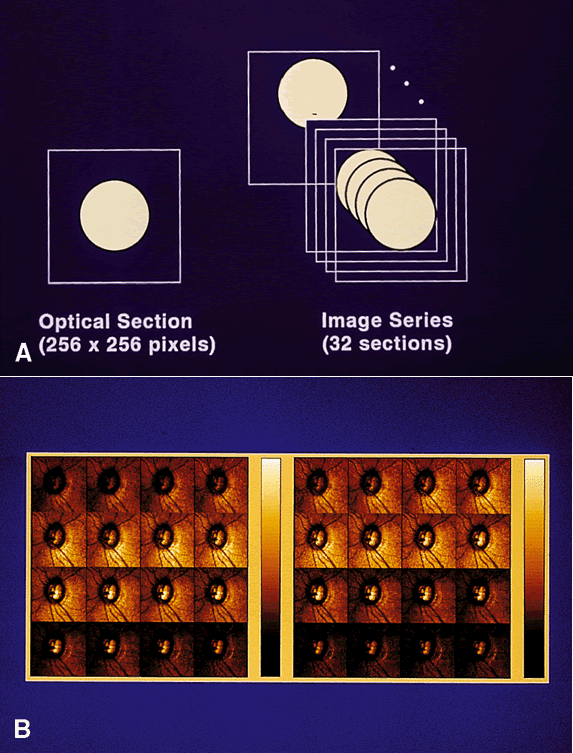
The cSLO generates a robust data set. Using a 256 × 256 matrix and 32 optical sections, the data set is approximately 65,000 height values from more than 2 million data points. When one considers that automated threshold perimetry generates only 72 discrete values, it is clear that powerful analysis strategies are needed to interpret the data. There are many approaches to data analysis. For example, data can be reviewed by pixel, region, or a derived parameter such as neuroretinal rim area. Most current strategies use only a subset of the 65,000 values.

A compact laser diode is used as the illumination source. Images can be obtained with light intensities as little as one thousandth of typical fundus flash illumination. The optical resolution is limited by the optics of the eye to about 10 μm transversely and 300 μm longitudinally.2 However, longitudinal measurements can be determined more accurately than this. If the serial optical sections are spaced closely, the height measurement can be determined from the plane of maximum reflectivity.

Clinically practical laser scanning optic nerve tomography first became possible in 1986 with the laser tomographic scanner (Heidelberg Instruments, Heidelberg, Germany). This instrument was used principally as a research tool and served as the prototype for the current generation of instruments. There are currently two commercially available cSLO systems—the Heidelberg retina tomograph (HRT; Heidelberg Engineering) and the topographic scanning system (Laser Diagnostic Technologies, Inc., San Diego, CA). Although both systems are based on the principles described above, there are hardware and software differences between them such as laser wavelength and definition of reference surface that makes direct comparisons difficult. No studies have directly compared the two instruments. These systems have been described in detail elsewhere.1–3

For typical optic nerve topographic measurement, the image series height range is defined by the operator to begin above the retinal plane and to terminate below the deepest point of the optic cup. Acquisition of a series of 32 images takes about 1 to 1.6 seconds, depending on the system used (Fig. 2). Examination can be performed undilated or dilated. Current practice is to obtain at least three images per session. Dilation is not needed if the pupil is at least 2.5 mm and the media are clear.

Fig. 2. A. An optical section consists of a 256 × 256 pixel array. Thirty-two optical sections are obtained along the z-axis to create an image series. B. These are the 32 individual optical sections that make up a topographic scan. Each is 256 × 256 pixels. The plane of focus for the first section is above the retina; the last scan is below the bottom of the optic nerve cup.

The 32 optical sections are processed to create a map with a resolution of 256 × 256 pixels. These 65,536 pixel values represent the height in the image relative to a reference plane (Fig. 3). This matrix of values can be analyzed using software included with the commercial systems, or the raw data can be exported and subjected to research strategies.

Fig. 3. The left image represents the extended-focus image. The optic nerve boundaries have been marked by the operator. The deepest pixels are color-coded blue. The right image is a topography map. Each of the 65,000 pixels is color-coded by depth. The darker pixels are deeper. The computer registers a numerical height measurement for each pixel.

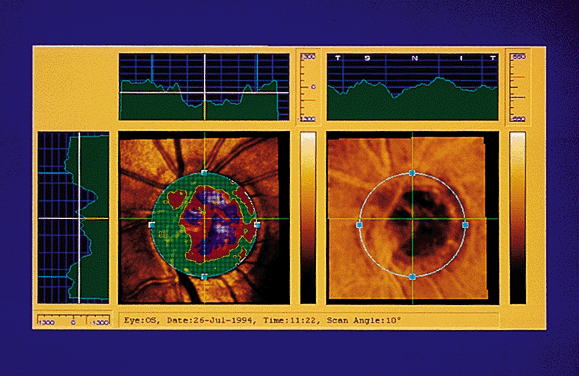
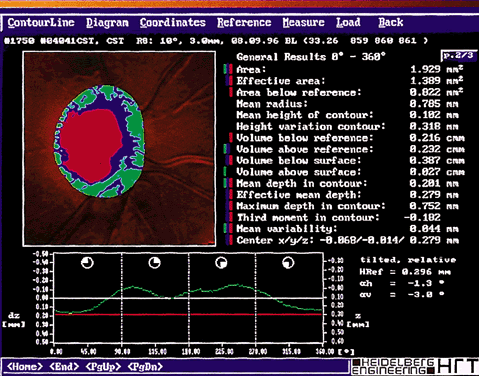
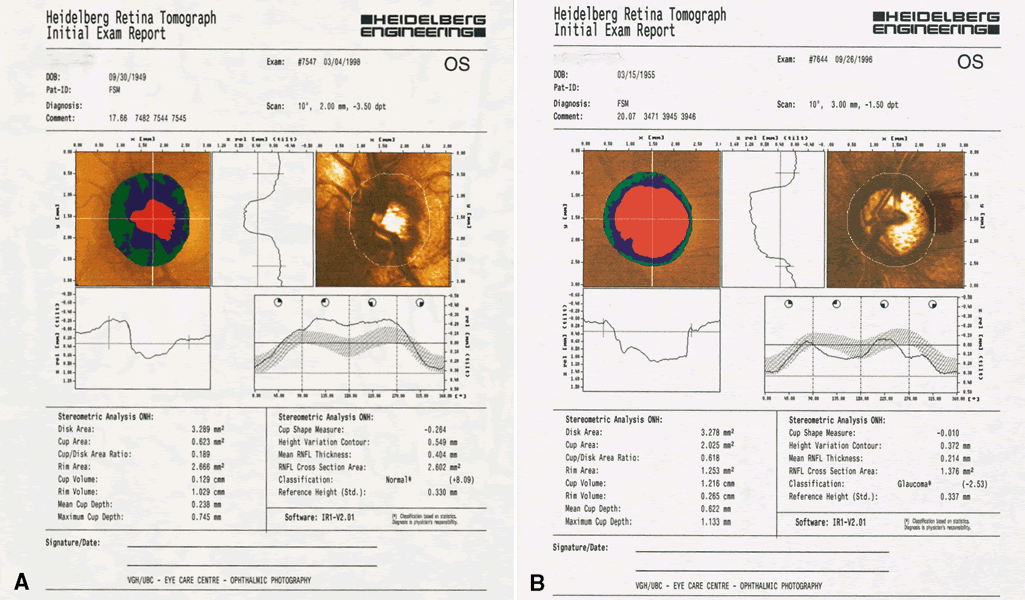
Once the images have been captured and before the system can compute topographic parameters, the operator must mark the area of interest, usually the optic nerve boundaries (Fig. 4). The computer establishes a retinal reference plane, then compares the depth measurements within the area of interest with respect to the reference plane (Fig. 5). The topographic data can be stored along with the area of interest data for comparison with subsequent images. Raw data can also be stored.

Fig. 4. The topographic parameters have been calculated and are displayed for the optic nerve. A color-coded map of the nerve is visible in this frame.

Fig. 5. A. This report was obtained from a healthy optic nerve. The left image indicates the relative depth. The horizontal and vertical cross-sections along the cross-hairs are represented below and to the right of the image. The right image is the extended-focus image, with the optic nerve boundary marked by the operator. Stereometric analysis values appear at the bottom of the report. B. This report is similar to A but represents a glaucomatous optic nerve.

There are two principal potential applications for ONH analysis in the diagnosis and treatment of glaucoma: (1) distinguishing between normal and pathologic ONHs and (2) identifying progressive change with sequential images of the same ONH. Essential to both these applications is an accurate and reproducible technology.

Back to Top
ACCURACY
It is difficult to assess the accuracy of in vivo measurements without histologic confirmation. Accuracy in this context refers to the correspondence between the measured values and the actual structure. Accuracy studies are more difficult to perform than reproducibility studies because the measurements must be compared with the “true” dimensions of the structure measured. It is difficult to find human eyes suitable for imaging about which valid histologic data will be available. Animal eyes can be studied, but they may differ structurally and optically in important ways from human eyes.

A plastic model was developed for accuracy studies,4 but this model has its limitations. In the living eye are several complex optical structures (cornea, lens, retina, choroid, retinal pigment epithelium) that can influence cSLO measurements. The plastic model can provide at best an approximation of expected accuracy in a living eye. Thus, there is limited information regarding the accuracy of these systems.

The accuracy of the HRT was assessed using such a model.5 The pooled coefficient of variations for volume below contour, volume below surface, and volume above surface were 2.4%, 4.1%, and 3.5%, respectively. The corresponding relative errors were 11.3%, 11%, and 3.8%. These estimates may not be valid in the living eye.

Measurements obtained in vivo with the HRT were also compared with planimetry measurements performed on the same eyes.6 The values obtained with the HRT were smaller, and the authors concluded the comparison between the two techniques should not be made. This is not surprising. It is likely that these represented differences in the definition of parameters and possibly differences in the optical systems. Although interesting, such comparisons will do little to determine accuracy without a known standard.

Despite the difficulties in determining the accuracy of these systems in the living eye, accuracy is probably not the limiting factor in the development of a clinically useful tool. Although accuracy may be more important when trying to categorize eyes as normal or abnormal, the detection of change depends more heavily on the reproducibility of the measurements. This is likely to be the most meaningful application of this technology, but the clinical ability of any of these systems to detect pathologic change remains to be demonstrated.

Back to Top
REPRODUCIBILITY
The reproducibility of a measurement is of great importance in determining the validity of a single measurement or detecting change through repeated measurements over time. In the context of optic nerve analysis, reproducibility is the ability to obtain the same measurement of the optic nerve (or other structures) when no structural change has occurred. An instrument with perfect reproducibility would provide identical results when the same structure is repeatedly measured. The better the reproducibility, the better the ability to detect small changes.

Reproducibility of cSLO measurements can be evaluated in different ways. Several studies have looked at the mean standard deviation of all pixels across several images as a measure of reproducibility. In studies of normal, glaucoma-suspect, and glaucomatous eyes, reproducibility with these systems has consistently been approximately 20 to 30 μm.7–9 These values have tended to improve with software and hardware refinement.

Chauhan and colleagues10 studied test-retest variability of topographic measurements of the optic nerve head in 30 normal and 30 glaucomatous eyes. Their analysis involved constructing empiric 90% confidence intervals for condensed pixels (4 × 4) pooled across three sequential images. The mean standard deviation equivalents of test-retest variability were 25.94 μm and 31.20 μm for the normal and glaucomatous eyes, respectively. This approach offers some advantages when looking for sequential change.

The cSLO systems calculate numerous parameters of optic nerve topography. Several investigators have looked at the reproducibility of specific parameters derived from these instruments. Rohrschneider and colleagues9 found coefficients of variation for parameters of 5.5% for cup area, 8.5% for rim area, 7.7% for cup volume, 6.4% for mean depth, and 6.7% for maximum depth.

Mikelberg and colleagues11 assessed the coefficient of variation and the reproducibility coefficient for the topographic parameters generated by the instrument. They pointed out that the coefficient of variation becomes elevated when the denominator of the equation is a small value, as can be the case with these parameters. They believe that the reliability coefficient, which takes into account the absolute value of the parameter in the population tested, may be a better measure. In their study, reproducibility coefficients ranged from 60.5% to 99.4%. Coefficients of variation ranged from 3.4% to 197.7%.

In a study of the effect of pupil size on reproducibility in normal eyes, the mean standard deviations of the height measurements through miotic, baseline, and dilated pupils did not differ significantly.12,13 Another study found that pupil size does not appear to affect measurements unless the pupil is less than 3 mm or unless a cataract is present.13 This supports the validity of obtaining images through undilated pupils with a cSLO.

Weinreb and colleagues14 investigated the effect of the number of images on reproducibility. Five images were recorded at each of five sessions through undilated pupils. Reproducibility between sessions improved when increasing numbers of images were used to create a baseline for each session. The improvements were small when increasing from three to five images. The investigators concluded that the optimal number of images to obtain per session was three, and this has become current practice.

There have been several other interesting observations regarding reproducibility. The lowest variability was found in the retinal areas with flat slopes away from blood vessels. The highest variability was found along the cup border and at blood vessels.10 The reproducibility of images obtained at a single session does not appear to differ from those obtained in sessions up to 4 weeks apart.15 A change in refractive error of greater than 2 diopters was found to induce a significant change in measured topography.16 Later versions of the software should correct for this.

These data support that cSLO systems can provide the clinician with accurate and reproducible data. Current practice is to obtain at least three images of the eye at each session, and to dilate if the pupil is less than 3 mm or if media opacities obscure the view. Sometimes the cSLO can image an optic nerve that cannot be adequately viewed clinically.

The values obtained with the commercially available cSLO systems for mean reproducibility per pixel are similar in all studies. There are several ways to assess the reproducibility of ONH analyzers. Mean standard deviation of repeated measurements is included in the software of the commercially available systems, and many studies have used this measure as an indication of reproducibility. Some studies have used the coefficient of variation (standard deviation divided by mean). This estimate can be problematic because the coefficient of variation approaches infinity when the denominator approaches zero. Others have suggested the use of confidence intervals when large databases become available. There is not general agreement on the best way to assess reproducibility. This will be an important issue as more investigations study progressive optic nerve change and attempt to establish statistical analysis tools.

Back to Top
COMPARISONS WITH MEASURES OF VISUAL FUNCTION
It appears that accurate and reproducible optic nerve topographic data are now obtainable from cSLO systems. Ultimately, this data will be of value only if it is relevant to the disease process. Several studies have explored this by examining the correlation of topographic data with measures of visual function.

Measurements with the HRT have been compared with various visual field indices. Looking at global indices, one investigator found a strong correlation between rim area and cup-shape measure with mean defect and pattern standard deviation.17 Another study of early to moderate glaucoma similarly found a good correlation between cup-shape measure and both mean defect and corrected pattern standard deviation.18

Correlations have also been found by some investigators for regional indices. In a study looking at topographic and visual field parameters, topographic parameters were found to relate to the appropriate location of visual field changes.19 Similarly, localized areas of optic nerve rim deficits have been found to correlate strongly with areas of short-wavelength perimetry deficit.20 However, not all studies have confirmed these observations.21

It is also possible to measure retinal topography with a cSLO. The peripapillary retinal height may reflect the thickness of the retinal nerve fiber layer. Several investigators have looked at the retinal nerve fiber layer cross-section or height and global visual field measures. These also have been found to correlate in some but not all studies.21–23

These studies support that the various topographic parameters and retinal nerve fiber layer parameters sometimes but not always correlate with both regional and global measures of visual function. Although we lack precise information relating anatomic structural changes and changes of visual function, these correlations strongly suggest that cSLO might detect abnormal optic nerve topography that reflects the structural and functional changes characteristic of glaucoma.

Back to Top
DISTINGUISHING BETWEEN NORMAL AND ABNORMAL
Clinicians have long recognized that it can be a particularly challenging problem to distinguish between normal and abnormal optic nerves, considering the wide range of biologic variation. Several investigators have approached this challenge with innovative strategies. In a study of normal, ocular-hypertensive, ocular-hypertensive with clinically abnormal retinal nerve fiber layer, and glaucomatous eyes, Airaksinen and associates24 found that rim volume was able to discriminate among the four groups, although there was considerable overlap between these groups. Similarly, others have found that although there were group differences among normal, ocular-hypertensive, and glaucomatous eyes, there was considerable overlap between groups.25,26

Using discriminant analysis, Mikelberg and colleagues27 were able to differentiate normal from early glaucoma with a sensitivity of 87% and a specificity of 84% using various parameters. They observed that for small crowded discs, it is difficult to make such determinations using their analysis.28

There are other novel approaches to analyzing data from cSLO topography,29,30 but all of these analysis strategies remain to be validated in large cohorts. It is likely that, similar to the progress in automated perimetry, new analysis strategies will continue to evolve.

Although group means have been found to differ among normal, suspect, and glaucomatous eyes, most of the studies have demonstrated considerable overlap between diagnostic groups. This has been a challenge with all glaucoma diagnostic technologies. Even when it is possible to find differences in group averages, it is often difficult to categorize an individual accurately when there is a wide range of biologic variability. From the foregoing studies, we can conclude that cSLO topographic parameters are able to differentiate the normal from the glaucomatous optic disc in a precise manner when looking at groups. It may be more difficult to identify early glaucomatous damage in an individual.

Back to Top
DETECTING CHANGE
Progressive optic neuropathy is the hallmark of glaucoma. Detecting change in optic nerve topography with a cSLO would be a most meaningful application. As suggested above, this quantitative technique may exceed the sensitivity of any available clinical tool for optic nerve examination. When evaluating a technology that may be more sensitive than accepted standards, it often is difficult to confirm the finding of the new technology until changes are observed with the less-sensitive standards. This may be the case with cSLO. Changes in optic nerve topography may precede visual field changes. It may take a large study and many years before this can be confirmed in a longitudinal study. No such studies have been reported with this relatively new technology. Several investigators have used other strategies to look for evidence of the ability to detect change.

There have not been any prospective series reported of patients with confirmed progression of glaucoma who have had documented optic nerve change on cSLO. Indeed, it is not clear what represents clinically significant change, although it is possible to define statistical change. This remains an important area for development of software and analysis strategies.

Several investigators have used models of change such as pre- and post-trabeculectomy and animal models.31–33 These results suggest that it will be possible to detect subtle topographic change from disease process. There remains the problem of confirming such change when other standard tests may be far less sensitive. Prospective longitudinal studies will be needed to answer these questions.

Back to Top
CONCLUSION
Any clinically useful ONH analyzer must be accurate and reproducible. It must be cost-effective, relatively simple to operate, and capable of capturing quality images from a large proportion of eyes. The cSLO systems seem to fulfill these criteria. Potentially, these instruments could assist in the diagnosis of glaucoma in two ways. First, as a screening examination, the nerve could be classified as normal or abnormal. Second, and probably more achievable, is the detection of progressive change over time.

Longitudinal studies are needed to establish the clinical utility of scanning laser topography. Any technique for identifying early structural changes in the optic nerve will require confirmation by a validated technique. Unfortunately, the current standard of achromatic threshold perimetry is not a sensitive indicator of early damage. At present, the ability of a cSLO to detect clinically significant optic nerve topographic change is not known.

When looking for change, there remains the challenge of identifying a stable reference plane or surface. The optic nerve is an unsatisfactory structure for establishing a reference surface; it is likely to change with the disease process. Changes in the retina over time are likely to be less marked. Most strategies now involve establishing a retinal reference surface away from the optic nerve.

Statistical strategies must be developed to analyze the huge data sets contained in digital optic nerve images. The interface between the optic nerve imaging systems and microcomputers can offer a potentially powerful tool for analysis. Several innovative approaches have been developed, and more will surely follow.

It will likely be another several years before quantitative optic nerve analysis will be widely incorporated in general practice. Large cross-sectional studies will be required to establish normative parameters. Long-term prospective studies are needed to establish which structural parameter will be most sensitive for detecting pathologic change. However, if there are not alterations in the imaging hardware, data collected now will be available for subsequent review as analysis techniques advance.

With current methods, clinicians have been quite poor at detecting all but the most noticeable changes over time in the optic disc. The cSLO systems may improve our sensitivity at detecting the structural changes pathologic for glaucoma. This would allow earlier detection of disease and better monitoring for progression.

Back to Top
REFERENCES

1. Fechtner RD, Ikram F, Essock EA: Advances in quantitative optic nerve analysis. In Burde RM, Slamovits TL (eds): Advances in Clinical Ophthalmology, Vol. 3, pp 203–224. St. Louis, Mosby-Year Book, 1996

2. Fechtner RD, Dreher AW, Weinreb RN: The laser scanning ophthalmoscope. In Varma R, Spaeth GL, Parker KW (eds): The Optic Nerve in Glaucoma, pp 269–276. Philadelphia, JB Lippincott, 1993

3. Mikelberg FS: Scanning laser ophthalmoscopy of the optic disc in glaucoma with the Heidelberg retina tomograph. Ophthalmol Clin North Am 10:435, 1998

4. Shields MB, Tiedeman JS, Miller KN et al: Accuracy of topographic measurements with the optic nerve analyzer. Am J Ophthalmol 107:273, 1989

5. Janknecht P, Funk J: Optic nerve head analyser and Heidelberg retina tomograph: Accuracy and reproducibility of topographic measurements in a model eye and in volunteers. Br J Ophthalmol 78:760, 1994

6. Spencer AF, Sadiq SA, Pawson P et al: Vertical optic disk diameter: Discrepancy between planimetric and SLO measurements. Invest Ophthalmol Vis Sci 36:796, 1995

7. Fechtner RD: Reproducibility of topographic measurements of the normal and glaucomatous optic nerve head with a new confocal laser scanning system. Am Acad Ophthalmol Annual Meeting, Dallas, 1992.

8. Lusky M, Bosem ME, Weinreb RN: Reproducibility of optic nerve head topography measurements in eyes with undilated pupils. J Glaucoma 2:104, 1993

9. Rohrschneider K, Burk ROW, Kruse FE, Vslcker HE: Reproducibility of the optic nerve head topography with a new laser tomographic scanning device. Ophthalmology 101:1044, 1994.

10. Chauhan BC, LeBlanc RP, McCormick TA, Rogers JB: Test-retest variability of topographic measurements with confocal laser scanning tomography in patients with glaucoma and control subjects. Am J Ophthalmol 118:9, 1994

11. Mikelberg FS, Wijsman K, Schulzer M: Reproducibility of topographic parameters obtained with the Heidelberg retina tomograph. J Glaucoma 2:101, 1993

12. Fechtner RD, Essock EA, Bene D, Smith H: The effect of pupil size on reproducibility of topographic measurements using a confocal laser scanning system. Invest Ophthalmol Vis Sci 35(supp):1347, 1994

13. Zangwill L, Irak I, Berry C et al: Effect of cataract and pupil size on image quality with confocal scanning laser ophthalmoscopy. Arch Ophthalmol 115:983, 1997

14. Weinreb R, Lusky M, Bartsch D et al: Effect of repetitive imaging on topographic measurements of the optic nerve head. Arch Ophthalmol 111:636, 1993

15. Chauhan BC, MacDonald CA: Influence of time separation on variability estimates of topographic measurements with confocal scanning laser tomography. J Glaucoma 4:189, 1995

16. Hosking SL, Flanagan JG: Prospective study design for the Heidelberg retina tomograph: The effect of change in focus setting. Graefe's Arch Clin Exp Ophthalmol 234:306, 1996

17. Iester M, Mikelberg FS, Courtright P et al: Correlations between the visual field indices and Heidelberg retina tomograph parameters. J Glaucoma 6:78, 1997

18. Brigatti L, Caprioli J: Correlation of visual field with scanning confocal laser optic disc measurements in glaucoma. Arch Ophthalmol 113:1191, 1995

19. Iester M, Swindale NV, Mikelberg FS: Sector-based analysis of optic nerve head shape parameters and visual field indices in normal and glaucomatous eyes. J Glaucoma 6:370, 1997

20. Yamagishi N, Anton A, Sample PA et al: Mapping structural damage of the optic disk to visual field defect in glaucoma. Am J Ophthalmol 123:667, 1997

21. Weinreb RN, Shakiba S, Sample PA et al: Association between quantitative nerve fiber layer measurement and visual field loss in glaucoma. Am J Ophthalmol 120:732, 1995

22. Eid TM, Spaeth GL, Katz LJ et al: Quantitative estimation of retinal nerve fiber layer height in glaucoma and the relationship with optic nerve head topography and visual field. J Glaucoma 6:221, 1997

23. Iester M, Courtright P, Mikelberg FS: Retinal nerve fiber layer height in high tension glaucoma and normal eyes. J Glaucoma 7:1, 1998

24. Airaksinen P, Burk ROW, Vihanninjoki K et al: Neuroretinal rim volume measurements with the Heidelberg retina tomograph. In Krieglstein GK (ed): Glaucoma Update V, p 91. Kaden: Verlag, 1996

25. Iester M, Broadway DM, Mikelberg FS et al: A comparison of normal, ocular hypertensive and glaucomatous optic disc topographical parameters. J Glaucoma 6:363, 1997

26. Zangwill L, Van Horn S, De Souza Lima M et al: Optic nerve head topography in ocular hypertensive eyes using confocal scanning laser ophthalmoscopy. Am J Ophthalmol 122:520, 1996

27. Mikelberg FS, Parfitt CM, Swindale NV et al: Ability of the Heidelberg retina tomograph to detect early glaucomatous visual field loss. J Glaucoma 4:242, 1995

28. Iester M, Mikelberg FS, Drance SM: The effect of optic disc size on diagnostic precision with the Heidelberg retina tomograph. Ophthalmology 104:545, 1997

29. Bartz-Schmidt KU, Sengersdorf A, Esser P et al: The cumulative normalized rim/disc area ratio curve. Graefe's Arch Clin Exp Ophthalmol 234:227, 1996

30. Asawaphureekorn S, Zangwill L, Weinreb RN: Ranked-segment distribution curve for interpretation of optic nerve topography. J Glaucoma 5:79, 1996

31. Irak I, Zangwill L, Garden V et al: Change in optic disc topography after trabeculectomy. Am J Ophthalmol 122: 690, 1996

32. Burgoyne CF, Hunt J, Qiu L et al: Changes within regions of the optic disc precedes change within regions of the peripapillary retina in a longitudinal study of experimental glaucoma by confocal scanning laser ophthalmoscopy (cSLO). Invest Ophthalmol Vis Sci 37(supp):S1090, 1996

33. Chauhan BC, Morgan WH, House PH, Yu D-Y: Effects of intraocular pressure and cerebrospinal fluid pressure modulation on optic nerve head topography. Invest Ophthalmol Vis Sci 37(supp):S664, 1996

Back to Top