
|
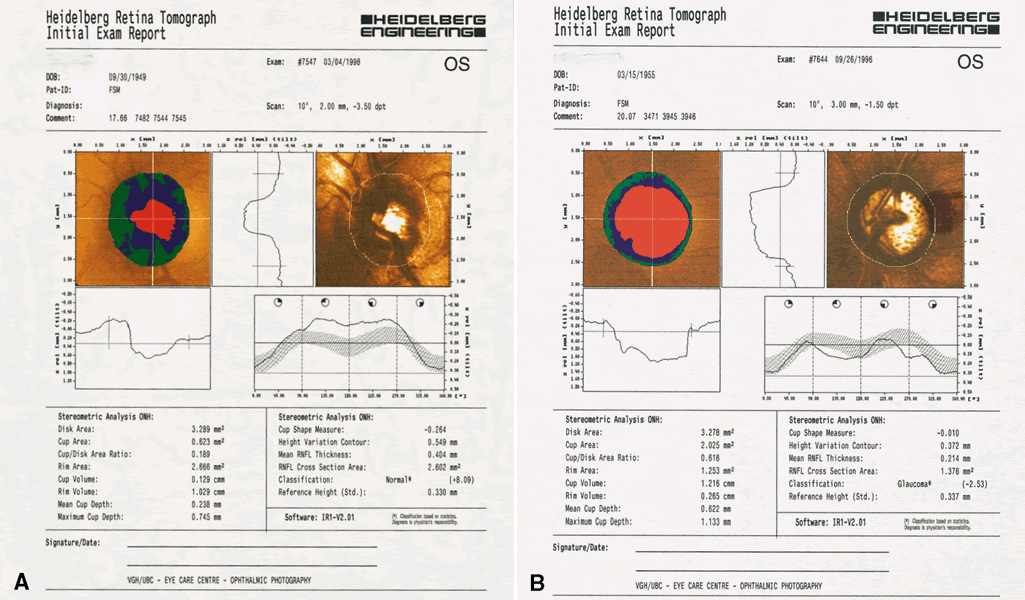
| Fig. 5. A. This report was obtained from a healthy optic nerve. The left image indicates the relative depth. The horizontal and vertical cross-sections along the cross-hairs are represented below and to the right of the image. The right image is the extended-focus image, with the optic nerve boundary marked by the operator. Stereometric analysis values appear at the bottom of the report. B. This report is similar to A but represents a glaucomatous optic nerve. |