|
The importance of the clinical measurement of the EOG lies in the fact that the amplitude of the response changes when certain luminance conditions are varied. Thus, if a patient is placed in darkness the potential will decrease, whereas if a bright light is turned on following dark adaptation the potential will increase.2
To obtain reproducible and comparable results, recommendations to standardize EOG testing have been made by the International Society of Clinical Electrophysiology of Vision (ISCEV).3 The reader should refer to this article for specific recommendations, but the essence of an EOG is as follows. After a preadaptation period of several minutes to acquaint the patient with the test, the lights are turned off for 15 minutes. Recordings for several saccades are made in the dark at 1-minute intervals. The lowest potential (dark trough) is reached in 8 to 12 minutes. A bright light is then turned on and recordings continue at 1-minute intervals with the potential increasing in amplitude until the highest point (light peak) is reached in 7 to 10 minutes. The ratio of the light peak to the dark trough is then calculated with normal being 165% or greater4 (Fig. 2).
|
It should be noted that this test may be performed with either dilated or undilated pupils, but the amount of light used to induce a full EOG light rise will vary with the pupillary size. Because the EOG light rise is proportional to the amount of light entering the eye up to an asymptote, it is important to have the necessary luminance to obtain a maximal response. Failure to account for this explains many of the lower-than-normal responses reported in the older literature.
Each laboratory should establish its own set of standards and these should be obtained using the standardized protocol referred to previously.
This electrical response is generated by the retinal pigment epithelium (RPE) with the light peak generated by a depolarization of the basal portion of the RPE.5 To generate this potential, intact photoreceptors, which are apposed to the RPE, are necessary.2
In the clinical situation the EOG almost always parallels the electroretinogram (ERG). Thus, in retinitis pigmentosa a patient with an extinguished ERG will show little or no EOG light rise. This is likewise true of any disorder in which there is a generalized degeneration of most of the photoreceptor cells, including drug-induced retinal toxicity and diffuse chorioretinitis.
Although specific abnormalities in the ERG may be recorded in a number of other abnormalities, including congenital stationary night-blindness (CSNB), X-linked retinoschisis, and cone dystrophy, the normalcy or abnormalcy of the EOG is dependent on the total number of functioning photoreceptors in these cases. Thus, in most cases of CSNB, there is an abnormality in neural transmission in the bipolar cell region; the EOG would be normal because of normal functioning rods.6 The same is true in X-linked retinoschisis. In cone dystrophy, although there may be an absence of cones, the large number of functioning rods give a normal EOG.
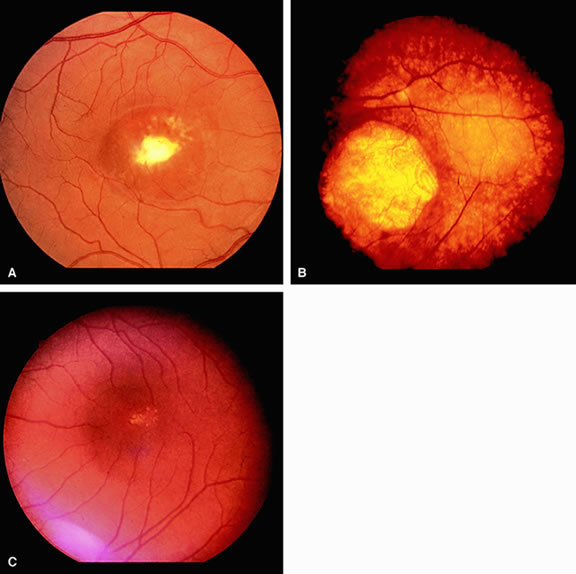
The only disorder in which a grossly abnormal EOG is found in the presence of a normal ERG is in the dominantly inherited disorder of Best's disease (vitelliform macular dystrophy).7 All patients with true Best's disease have an abnormal EOG with ratios invariably below 135% (Fig. 3). As is true of all autosomal dominant disorders there is a wide range of expressivity; thus, an individual who has the gene may show no fundus abnormalities yet has an abnormal EOG.8 Thus, this test serves as an electrophysiologic marker in this disorder and is important in assessing family members, as well as individuals with an atypical retinal picture (Figs. 4 and 5).
|
|
|
The group of disorders known as pattern dystrophies of the RPE9 and the autosomal dominant disease foveomacular dystrophy10 have been reported to have reduced EOGs in some cases, but the number of exceptions make this test less helpful in these disorders than in Best's disease.
A normal EOG is likewise important to rule out Best's disease in certain patients who may present with a vitelliform lesion. These disorders, which are usually an atypical presentation of a macular degeneration (pseudovitelliform degeneration), have a normal EOG; this finding eliminates the necessity of examining other family members.
A number of studies have shown a yet unexplained abnormality of the EOG, which may be clinically useful.11 Patients with malignant melanoma of the choroid show a markedly reduced EOG in the affected eye as compared with the normal fellow eye. Although there seems to be no relationship between the size of the melanoma and the EOG ratio, there is a relationship between location and EOG ratio; those in the posterior pole have a greater EOG loss than more peripheral tumors.