Chapter 67
Statistics in Ophthalmic Clinical Research
ARGYE HILLIS
Main Menu   Table Of Contents

Search

WHY STATISTICS?
GETTING STARTED
THREE FUNDAMENTAL IDEAS
RANDOMIZATION
DISTRIBUTIONS
INFERENCE
THE LOGIC OF HYPOTHESIS TESTING
TYPE I AND TYPE II ERRORS
THE SAMPLE SIZE AND RELATED PROBLEMS
A WORD OF CAUTION AND SUGGESTIONS FOR FURTHER READING
REFERENCES

WHY STATISTICS?
For centuries, medical knowledge accumulated without benefit of statistics. Even today, clinical experience is the sine qua non of ophthalmology, and certain astute clinicians seem to have an uncanny ability to perceive and describe clinical processes by some intuitive strategy that belies formalization. However, such talent is rare and even those who possess it find an understanding of basic statistical concepts important for two reasons: objectivity and communication. Objectivity is important because we all are inclined to see what we want to see. Awareness of the danger is no protection—it may simply lead to “leaning over backward” in the other direction. Ophthalmologists are becoming increasingly demanding of scientific evidence on which to base clinical decisions. Properly employed statistical methods assist in determining just what the data say and how certain we can be of the message. Like any good language, statistics is also a tool for communication. The ophthalmologist with a background in statistics can present findings convincingly and is able to understand and evaluate the findings of others.
Back to Top
GETTING STARTED
Every field has its own technical jargon. Statistics is no exception. One barrier to communication with statisticians is the fact that certain common English words are used as technical terms with meanings quite different from common usage. For example, in statistics the words random, significant, and bias do not mean “haphazard,” “important,” and “prejudice” but are mathematically defined terms representing statistical concepts.

A second barrier to learning statistics is the matter of mathematical notation. Statisticians are very fond of using mathematical shorthand. They may even use similar notation for different ideas or express the same idea using several different forms of notation. For example, a capital letter P may refer to “probability” or to a particular type of distribution, the Poisson distribution. A lower case p usually means “proportion,” but it may occasionally be used to mean “probability,” as in “p-value.” It is important in reading any statistically oriented material to pay close attention to definitions of notation.

Back to Top
THREE FUNDAMENTAL IDEAS
As the numeric computations of statistics become ever more accessible, the importance of understanding what the “answers” actually mean increases proportionally. A basis for such understanding rests in three fundamental ideas outlined below. These concepts, randomization, distributions, and inference are basic to all statistical thinking. Following the discussion of basic principles, important details of inference (type I and type II errors, sample sizes, and “intent to treat” analyses) are dealt with in more detail and several subjects of particular interest in ophthalmology and medicine are discussed, including life tables and the complexities of analyzing ongoing projects.
Back to Top
RANDOMIZATION
The word random is used casually in everyday life but has a very specific meaning in statistics. Statistics always deals with data that are a sample of the possible observations that might be made on a some larger set or “population” of items. If we could observe, for example, the outcome of all patients treated with a specific regimen (including past and future cases), no statistics would be needed. Instead, for better or for worse, our observations are just a partial sample from which we infer something about the whole (usually theoretical) population. In statistics, for a sample to qualify as random, each item in the underlying population must be equally likely to appear in the sample and the sample items must be chosen independently of each other. If the assumption of random sampling is not met, the calculations may be invalid. In ophthalmological applications involving treatment comparisons, the assumptions on which the statistical calculations are based are met by randomly assigning patients to different managements using some device equivalent to the toss of a coin. Randomization is important in this context to avoid inadvertent bias and to ensure validity of the statistical calculations.

Randomization began to be seriously applied to medicine and ophthalmology shortly after World War II. Since that time, randomized clinical trials have produced important evidence that would not otherwise have been possible to obtain. For the first time, “evidence-based” medicine developed into an increasingly realistic goal in clinical practice. In the early years of the twenty-first century, the challenge is to integrate the collection of solidly based (i.e. randomized) evidence more widely into the clinical practice. These efforts range from developing online systematic reviews of the effects of health care1,2 (including an Eyes and Vision Group at Brown funded by the National Eye Institute) to consortiums for randomizing new interventions from virtually the first patient.3

Back to Top
DISTRIBUTIONS
Faced with a mass of data, statisticians generally want to organize it into something that they can picture. The distribution may be thought of as a picture or map of the data. Figures 1 and 2 show distributions for common ophthalmologic variables. The way to illustrate a distribution is to place the range of values the variable can take along the x (horizontal) axis and the frequency of occurrence (number or percent of patients having the specified value) on the y (vertical) axis. The form of a distribution can also be expressed in mathematical terms. Often, the person managing the data has theoretical or empirical reasons to expect the data to have a particular distribution. Many measurement-type variables have distributions that approximate a very specific form, the Gaussian distribution, or so-called normal curve (Fig. 3). Because this symmetric bell-shaped curve occurs quite often in nature and because it has some nice mathematical properties, the normal curve plays an important role in statistical theory.

Fig. 1. Reported age at onset of night blindness for patients with type I simplex-multiplex retinitis pigmentosa. (Adapted from Massoff RW, Boughman JA: Genetic analysis of subgroups within simplex and multiplex retinitis pigmentosa. In Cotlier E, Maumenee IH, Berman ER [eds]: New York, Alan R. Liss for the March of Dimes Birth Defects Foundation, BD:OAS 18[6]: 161–166, 1982)

Fig. 2. Length of lower eyelid for women age 50 and older. (Data from Lin D, Strasior OG: Lower eyelid laxity and ocular symptoms. Published with permission from The American Journal of Ophthalmology 95:545–551, 1983. Copyright © by The Ophthalmic Publishing Company.)

Fig. 3. Normal distribution showing mean (μ), standard deviation (σ).

The importance of understanding the distribution of a particular set of data is twofold. Not only is it a way of taking a large collection of disorganized observations and condensing the information into a cohesive and understandable format, but recognizing the underlying distribution of the data is essential to choosing appropriate methods of analysis.

Once the general form of the distribution is decided on, we can proceed either to describe the data in more detail or to make inferences from what we see. In clinical ophthalmology, statistics is primarily used for inference. However, a simple example from descriptive statistics best illustrates the usefulness of parameters of a distribution. Because so many measurements of human beings are take a normal distribution, this distribution is sometimes assumed without specification in statements such as “the normal intraocular pressure is 15.5, with a standard deviation of 2.6.” Statistics provides a more exact mathematical way to say, “most people have IOPs of around 15.” In particular, it gives a precise definition of “around 15,” which can be important, for example, for interpreting an intraocular pressure of 18 (still in the middle part of the distribution) or 35 (in the far right tail of the distribution).

STANDARD DEVIATIONS AND STANDARD ERRORS

The standard deviation is a very simple concept. Figure 3 shows a normal curve with its mean and standard deviation. Notice that the line describing the normal curve is concave downward in the middle and concave upward toward each end. The point of inflection (point at which the curve reverses) is one standard deviation away from the mean (middle) of the curve. The standard deviation, usually denoted with a lower case sigma (σ), is a simple way of describing how “scattered out” the observations are. The standard deviation has other useful characteristics for Normally distributed variables. Approximately two thirds of the values lie within one standard deviation of the mean (in the example above, intraocular pressures between 12.9 and 18.1). Ninety-five percent of the values fall within approximately two standard deviations of the mean (1.96 standard deviations, to be exact). This means that there is a good mathematical reason to categorize as “high” a value that is more than two standard deviations above the mean. Only two and a half percent of individual values in a normal distribution are this far above the mean. Conversely, a value two standard deviations (or more) below the mean of a normal distribution can reasonably be defined as “significantly” low. In Figure 3, the shaded area represents all observations at least 1.96 standard deviations away from the mean in either direction. This is an important point to remember, because it is the basis for many statistical tests. Because the curve is symmetric, 2.5% of observations lie more than 1.96 standard deviations above the mean (“in the right tail”) and 2.5% are at least this distance below the mean, or in the left tail. The standard deviation of a distribution is denoted with a lower case sigma (σ). (Statisticians are also interested in the square of the standard deviation, called the variance of the distribution, but discussion of the latter statistic is beyond the scope of this chapter.)

Back to Top
INFERENCE
In ophthalmology, statistics is most commonly used to infer something about a population on the basis of observations made on a sample taken from that population. (Statisticians use the word “population” quite generally to refer to all the values in a distribution—intraocular pressures, outcomes of a treatment, and so on, not just individual human beings.) The intraocular pressures recorded for one ophthalmologist's patients can be thought of as a sample (unfortunately, not a random sample) of the unknowable population intraocular pressures for all patients. In descriptive statistics, exact values are computed for parameters such as the mean and standard deviation, describing persons actually studied. In statistical inference, it is important to distinguish between the true (and usually unknown) value of a parameter in a population and the numeric estimate of that parameter based on measurements obtained from a sample of the population. The “true” value is generally denoted by a Greek letter, and numeric estimates by the English alphabet. Thus , the sample mean or average, is an estimate of the true mean, μ, for the population and SD or s is used to denote an estimate of σ, the population standard deviation. A common way to represent results is to give the “mean ± 1 SD.” For example, the data in Figure 2 can be summarized by the statement “mean = 32.82 ± 2.54 mm.” It should be noted, however, that some authors use this same format to present the mean and the standard error of the mean. The latter statistic represents something quite different.

Numerically, the standard error of the mean of a sample is calculated as the estimated standard deviation divided by the square root of the number of observations: SE = SD/√n. The standard error is useful when an estimate of the population mean has been made. If a normal distribution can reasonably be assumed, the standard error tells how precise the estimate is: We can be 95% confident that the estimate is within two standard errors of the true value. The standard error is used to infer something about the underlying population mean on the basis of the observations in the sample. In the example given earlier, the standard error of the mean would be calculated as 0.28/√51, which equals 0.04. Standard errors are important in making inferences about population means. They may also be used to infer something about the underlying population from which the sample comes.

We know from statistical theory that if repeated samples of size n (e.g., all possible samples of size 51 in the above example) are taken from the same population and an average value (i.e., FAZ diameter) computed for each sample, that 95% of these average zone diameters will fall within 1.96 standard errors of the true mean of the underlying population. This statement is true because the averages obtained in such repeated sampling would themselves be Normally distributed with mean and standard deviation σ/√n. The standard error is just the standard deviation that pertains to the distribution of sample means. It is called the standard error to distinguish it from the standard deviation that applies to the distribution of individual values. Therefore, in our example, the authors can be 95% confident that the mean of the underlying population lies between 0.92 and 1.08.

The more observations one takes before computing the sample mean, the closer that mean is going to come to the true value for the population. This trend is illustrated by examining the “confidence interval” (CI) or ranges of values within 1.96 standard errors of the sample mean for various sample sizes. Shown below are the results that would be computed for three different sample sizes, all with mean = 1.00 and estimated standard deviation = 0.28:


Sample Size(n)SD()SE(/)95% CI(1.00 ± 1.96 SE)
  510.28  70.040.92 to 1.08
1000.28100.030.94 to 1.06
4000.28200.010.98 to 1.02


Back to Top
THE LOGIC OF HYPOTHESIS TESTING
Just as a formal structure is used for proofs in geometry, the process of statistical reasoning has a formal logical structure that must be understood by anyone who wants more than a superficial understanding of statistics. The logic statisticians use in hypothesis testing is similar to the process by which a differential diagnosis is made. In performing a formal differential diagnosis, the clinician first lists all of the possibilities that could account for the findings and then eliminates them one by one until only the diagnosis of choice remains. The formal process of hypothesis testing can be thought of as a differential diagnosis. To be have confidence in the reality of our findings, we must first eliminate the possibility that the experimental results were due to chance alone.

In the Diabetic Retinopathy Study conducted in the early 1970s, one eye of each patient was treated with panretinal coagulation and the other was left as an untreated control. As the results began to come in, it could be seen that more of the untreated eyes than treated eyes were having poor outcomes. The question, however, was whether this was a chance effect. If the treated eye fared better in two of the first three patients was that enough evidence? Clearly not; all of us know two heads in three tosses of a coin is not unusual. How about six of the first nine? What if twenty of the first thirty pairs favored treatment? This is a statistical question and was answered by formal hypothesis testing. The hypothesis the ophthalmologists were interested in, of course, was that the treated eyes would do better. However, as is done in a differential diagnosis or an indirect proof in geometry, statistics approaches this by testing the “null hypothesis,” that is, by refuting the hypothesis that treatment does not work. This seemingly backward approach, done for mathematical and logical reasons, is the source of much confusion for nonstatisticians. Formally, a null hypothesis and an alternative hypothesis were set up, using :pt to represent the true (not sample) proportion of eyes that have a successful outcome with treatment and pu analogous proportion of without treatment.


Null Hypothesis: pt = pu


Alternative hypothesis: ptpu

The null hypothesis was then tested, asking the question, “What is the probability of seeing as many pairs in favor of treatment as we are seeing if the null hypothesis is true (i.e., if treatment and no treatment carry the same prognosis)?” The answer to this question in the Diabetic Retinopathy Study was “extremely low!” If this study was done right, the probability that the treated eyes would do this well in comparison to the untreated eyes is much less than 0.001 (in statistical terms, P < 0.001). As is discussed later, the statistical results were evaluated, along with clinical considerations such as the side effects of treatment, and the investigators decided to reject the null hypothesis of no effect and publish the results, saying that photocoagulation treatment worked for proliferative diabetic retinopathy.

Back to Top
TYPE I AND TYPE II ERRORS
It has perhaps already become clear to the reader that hypothesis testing never proves a proposition and that there is always the possibility of error. Two wrong conclusions are possible: a true null hypothesis may be rejected (and a random difference wrongly accepted as “real”), or the experimenter may fail to reject a false null hypothesis (and evaluate a real difference as “not significant”). The P value associated with an experiment is defined as the probability that the null hypothesis, if true, will be rejected. Thus, in the example given earlier, the null hypothesis was rejected and the conclusion was made that a “statistically significant difference” had occurred, with P < .001. Rejecting a null hypothesis that in fact is true (in this example, saying that treatment worked if it did not) is called a type I error. Insofar as possible, statistical tests are designed to minimize the chances of a type I error. A type II error occurs when the investigator fails to reject a false null hypothesis. This type of error frequently results from studies of inadequate sample size.

Note that the decision is always couched in terms of rejecting or failing to reject the null hypothesis. “Failure to reject” the null hypothesis is not the same as “accepting” it. Failure to reject the null hypothesis simply means that a chance effect cannot be ruled out, not that there was definitely no difference. Suppose the goal is to show that one treatment is as good as another, then a more sensible approach would be to aim for a statement that the difference between the treatments is unlikely to be larger than a specific magnitude.

Back to Top
THE SAMPLE SIZE AND RELATED PROBLEMS
One of the most common questions asked by clinicians (and one of the hardest to answer sensibly) is, “What does my sample size need to be?” The answer to this grows out of the discussion above on type I and type II errors. Obviously, the investigator would like to design the study so that the risk of committing either type of error is kept small. In the simple case of a clinical trial of two therapies, a reasonable goal is to be able to reach one of two conclusions: Either (1) there is a statistically significant difference between treatments, or (2) there is no clinically important difference between the two treatments. Of course, in the first case, one would also want to report the direction and magnitude of the difference.

Unfortunately, some experiments that fail to show a statistically significant difference also fail to rule out the possibility of a clinically important difference. This result is not very satisfying to the investigator, the statistician, or the reader, but it is a definite possibility when the sample size is too small. Sample size calculations are designed to help the investigator choose a sample size that will provide a reasonable chance that the results will be statistically significant at some specified level if there is a clinically important difference between the two treatments.

To compute a sample size (or use one of the many available tables), the investigator must answer three questions:

  1. What probability level should be defined as “significant?”
  2. What constitutes a “clinically important difference?”
  3. What should be used as the probability of a type II error?

These issues are discussed in the next section.

WHAT PROBABILITY LEVEL SHOULD BE DEFINED AS “SIGNIFICANT?”

The conventional 0.05 level may be chosen, or if multiple tests are going to be made on the data, it may be more appropriate to use a more stringent criterion, such as 0.01. This probability is called the α-level. When the null hypothesis is true, α represents the probability the experimenter will commit a type I error.

WHAT CONSTITUTES A “CLINICALLY IMPORTANT DIFFERENCE?”

This decision is a difficult one and not to be taken lightly. An alternative way of stating it if you are the investigator is to ask yourself what is the smallest difference you would be willing to take a chance on missing. The smaller the difference, the larger the sample size necessary to detect it.

Clinicians (and some statisticians) often make a mistake here and specify the difference they hope exists, not realizing that this policy means that should the difference between treatments be smaller than anticipated (but nonetheless important), there is no assurance that it will be found to be “statistically significant.”

WHAT SHOULD BE USED AS THE PROBABILITY OF A TYPE II ERROR?

How sure does the investigator want to be of picking up a clinically important difference if one exists? Conversely, how large a chance is he or she willing to run of missing a clinically important difference? The chance of a type II error, or missing a specified difference, should it exist, is called the β-value. The complement of β, the chance of detecting the difference, is called the “power” of the experiment. Only an infinite sample size will be 100% powerful. It is common practice to design experiments with 90% power, or a β-value of 0.10. This means that if the difference between treatments is really as large as that specified as “clinically important,” the experiment has a 90% chance of yielding results that are statistically significant at the specified level. At first, 10% may seem like a large risk to take of missing the difference. In actual practice, the risk is not as great as it would appear. Even if the results are not “statistically significant” at the end of the experiment, any important differences are likely to show up as strong trends that suggest that further investigation is warranted.

When the above-mentioned assumptions are in hand, standard formulas and tables are available for computing the required sample size. The exact formula to be used depends on the type of variable to be observed (e.g., Is “effectiveness” to be evaluated by comparing percent successes or average values of a quantitative variable?) and the statistical tests to be employed (Will we use a two-tailed test? Will we adjust for lack of continuity?).

As an example of how sample size calculations are done, consider a clinical trial with two groups of patients to be randomly assigned to treatment A and treatment B, and some immediate effect will be observed to determine “success” or “failure.” Table 1 could be used to find the required sample size as follows: Suppose treatment A is known to have a 50% failure rate. Suppose further that this is a simple short-term experiment with a straightforward one-time analysis so it is reasonable to use 0.05 as the cutoff point for “significant.” Although the investigators have great hopes that treatment B will reduce the failure rate to 10%, cutting failures in half would be important clinical news. Therefore, the experiment might be designed to have a high (90%) probability of detecting a difference in failure rates at least as large as 50% versus 25%. Furthermore, if it should turn out that treatment B is actually worse, that would also be an important finding, so a two-tailed test should be employed. Table 1 shows that the required sample size is 77 patients in each group for a total of 154 for this set of assumptions (α = 0.05, β = 0.10, p1 = 0.5, p2 = 0.25). Formulas appropriate to other situations are available in standard texts.


Table 1. Sample Sizes: Number of Patients Needed in Each of Two Groups*


 P1
P20.050.100.150.200.250.300.350.400.450.50
0.05 581187100654635282219
0.10581 9162661338256423225
0.15187916 121033416196654735
0.201002661210 14623921841087251
0.25651333341462 167243920311777
0.3046821613921672 1840476217124
0.353556961844391840 1966502226
0.402842651082034761966 2050518
0.45223247721172175022050 2092
0.5019253551771242265182092 

* p1, p2 = binomial proportion groups 1, 2; alpha = 0.05, beta = 0.10


DESCRIBING DATA FROM FOLLOW-UP STUDIES

A common problem encountered in ophthalmology is describing the results of a long-term follow-up study in which patients enter at various points in time and are watched for months or years for the occurrence of some event such as retinal detachment or loss of vision. Too often, the results of this type of study are summarized with a statement such as the following: “110 patients with disease x were observed for periods ranging from 1 to 3 years (mean follow-up, 24.0 months). Twenty-five of the 110 patients (22.7%) became blind during the follow-up period.”

Unfortunately, statements like those in the last section are not as informative as they sound and do not use the available data to the fullest. Indeed, the type of summary illustrated above may even be misleading, especially if interpolations (such as approximating the blindness incidence rate as 11% per year) and comparisons are made using the results as stated.

A much better method for summarizing follow-up data is the technique commonly called survival or life-table analysis. In this type of analysis, an “event” such as blindness or death is defined and all patients are followed until the event occurs or until the date of analysis. The length of follow-up is then computed for each patient as the time elapsed from entry into the study to the event or date of analysis, whichever comes first. The cumulative proportion with an event is calculated for each point in follow-up time, as shown in Figure 4 from the Diabetic Retinopathy Study.

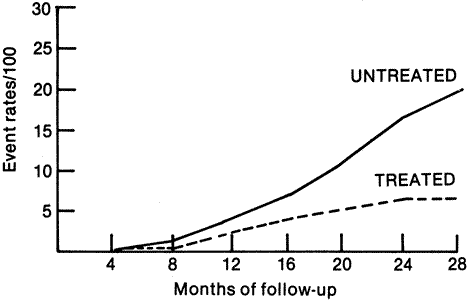
Fig. 4. Cumulative event rates of visual acuity less than 5/200 at two or more visits for all patients. (Redrawn from Diabetic Retinopathy Study Research Group: Preliminary report on effects of photocoagulation therapy. Published with permission from The American Journal of Ophthalmology 81:383–396, 1976. Copyright © The Ophthalmic Publishing Company.)

One easy method of computing the cumulative probability of an event is illustrated in Table 2, which contains real data on the occurrence of severe visual loss in untreated senile macular degeneration. The first step is to compute some probabilities of not having an event. (In life-table terminology, not having an event is called “survival,” an unfortunate choice from the ophthalmological viewpoint.) First, an interval survival is computed for each point in follow-up time as the number of patients (eyes) “surviving” that time point (passing through without an event) divided by the number at risk (those followed up to the interval without an event). It is easy to show that the cumulative survival at any time is the product of all preceding interval survivals. The cumulative survival for time zero (start of the study) is not shown on the table but always equals one.


Table 2. Life-Table Computations: Development of Severe Visual Loss in Eyes With Parafoveal Neovascular Membranes Due to Senile Macular Degeneration


Interval
(i)
Number of Eyes in “No Treatment” Group
B
At Risk
C
With Event
D
Interval Survival
1 – C/B
E
Cumulative Survival
D (E1–1)
F
Cumulative Event Rate
1 – E
684240.710.710.29
1239110.720.510.49
181330.770.390.61

(Adapted from Macular Photocoagulation Study Group: Argon laser photocoagulation for senile macular degeneration. Arch Ophthalmol 100:912–918, 1982. Copyright © 1982, American Medical Association)


Life tables have the advantage of using the full information on patients followed for various lengths of time. Patients who entered the study too late to be observed for the full time of the analysis are called “withdrawals” in life-table terminology because they are withdrawn from the computations for certain time intervals. Clearly, they are not withdrawn from the study, however, and are considered at risk for as long as they were observed. True dropouts (i.e., patients who refuse to or are unable to return) are analyzed the same way as withdrawals, but the investigator needs to remember that one important requirement of life tables is that all withdrawals be subject to the same probability of an event as nonwithdrawals. No method (including life tables) can adjust for the bias inherent in failure to obtain complete follow-up.

Life tables are usually presented in the form of a graph. Either the cumulative proportion with an “event” or the proportion “surviving” without an event may be illustrated.
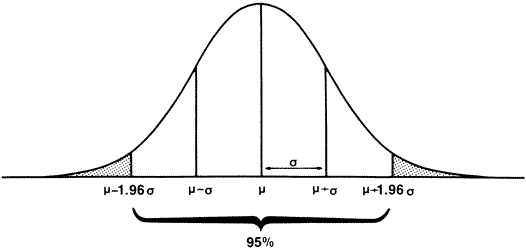
Back to Top
A WORD OF CAUTION AND SUGGESTIONS FOR FURTHER READING
The purpose of this chapter has been to provide basic concepts that will be helpful in reading the scientific literature. The reader who plans his or her own research will undoubtedly want to undertake further study or collaborate with a professional statistician.

Medical research is a particularly tricky area for the amateur statistician. When the experimental unit is a human, it is often necessary to make compromises between the experimental design that would produce the “cleanest” statistics and what is feasible in the real world of clinical medicine. Humans simply cannot be manipulated and standardized like experimental units in other fields. An admirable discussion of common fallacies and difficulties appears in the concluding chapters of Hill's classic work Principles of Medical Statistics.4 Armitage approaches the subject from a more technical standpoint in his excellent text.5 Other sources of statistical assistance that have proved to be particularly useful to physicians include a multiauthored pair of articles on clinical trials in the British Journal of Cancer6,7and several nontechnical but comprehensive textbooks.8–10

Back to Top
REFERENCES

1. Chalmers I: The Cochrane Collaboration: preparing, maintaining, and disseminating systematic reviews of the effects of health care. Ann N Y Acad Sci 703 :156, 1993

2. Dickersin K, Manheimer E: The Cochrane Collaboration: Evaluation of health care and services using systematic reviews of the results of randomized controlled trials. Clin Obstet Gynecol 41:315, 1998

3. Hillis A, Rajab MH, Baisden CE, et al: Three years of experience with prospective randomized effectiveness studies. Control Clin Trials 19:419, 1998

4. Hill B: Principles of Medical Statistics, 9th ed. New York, Oxford University Press, 1971

5. Armitage P, Berry G, Matthews JNS: Statistical Methods in Medical Research. Malden, MA, Blackwell Publishers, 2001

6. Peto R, Pike MC, Armitage P, et al: Design and analysis of randomized clinical trials requiring prolonged observation of each patient. I. Introduction and design. Br J Cancer 34:585, 1980

7. Peto R, Pike MC, Armitage P et al: Design and analysis of randomized clinical trials requiring prolonged observation of each patient. II. Analysis and examples. Br J Cancer 35:1, 1981

8. Daniel W: Biostatistics: A Foundation for Analysis in the Sciences, 7th ed. New York, John Wiley & Sons, 1999.

9. Le CT: Health and Numbers: Problems-Based Introduction to Biostatistics. New York, John Wiley and Sons, 2001

10. Snedecor GW, Cochran WG: Statistical Methods, 8th ed. Ames, IA, Iowa State Press, 1989

Back to Top