BLINDNESS REGISTERS
Registration of blind persons has been a popular approach to identifying and recording the number and characteristics of blind persons. Laws establishing blindness registers have been in place in selected states, including the first in Connecticut in 1893 to the most recent addition occurring in New Hampshire in 1970.3 As of 1986, blindness registers were in place in 27 of the 50 states in the United States.3 Reporting is mandatory in 12 states; however, only in Massachusetts does the law provide sanctions against those who fail to report.3
Properly used and maintained, blindness registers offer a cost-efficient method to collect detailed information on the magnitude and causes of blindness in defined populations. They also permit an analysis of trends over time in new registrations (incidence) and can assist in identifying a population to which services can be directed. However, the usefulness of such registries is directly related to their completeness and the consistency with which the data for each registrant are collected. Unfortunately, all blindness registries in this country and most in other countries as well, significantly underascertain blind persons.2,4 In addition, because of the social service benefits associated with being registered and the differential access to and utilization of eye care services, it is likely that the level of underascertainment varies among different subgroups of the population. Thus, comparisons of prevalence or incidence rates based on registry data are fraught with difficulties. Another problem with registry data relates to the standardization of diagnostic criteria used to define the cause of blindness. Not all registries require cause of blindness information or specify the source of such data. In addition to the variations in diagnostic criteria used by different ophthalmologists, there are no generally accepted rules for cause assignment when there are two or more potential causes either in the same or different eyes of the same person.
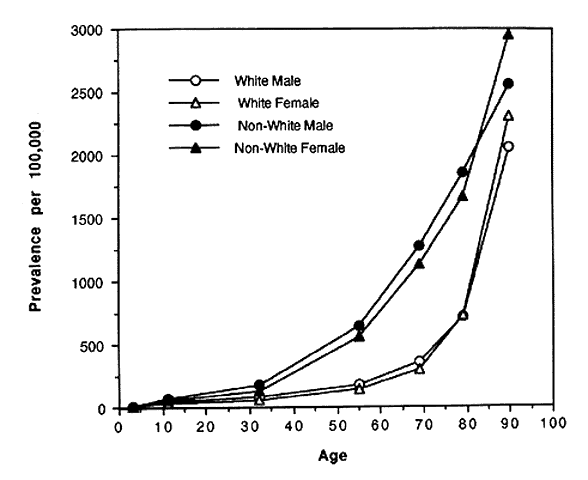
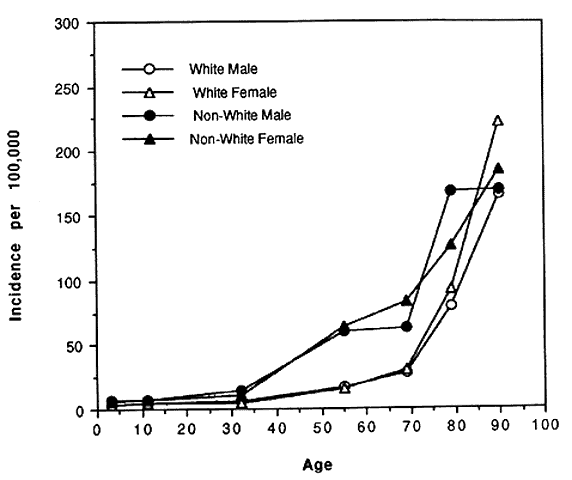
In spite of these problems and until recently, blindness registries have been the best source of national data on rates and causes of blindness in the United States. In the 1960s and 1970s the National Eye Institute and its predecessor, the National Institute of Neurological Diseases and Blindness developed the Model Reporting Area for Blindness Statistics project, a voluntary association of 16 states' registries that agreed to standardized definitions of blindness and uniformity of recording procedures.5,6 The last report of this project was published in 1973 and included data from 14 of the 16 participating state registries. Figures 1 AND 2 AND Table 1 summarize a number of the key findings from that report. Blindness registration prevalence and incidence were strongly associated with age. Rates were 37 to 227 times higher among those in the oldest age group as compared with the youngest (see Figs. 1 AND 2).Both prevalence and incidence of registration were consistently higher among nonwhites as compared to whites with an age-adjusted prevalence ratio of 2.65 and a relative risk of 2.37 (see Table 1). There was an indication that rates were slightly higher among women compared to men; however, it was not consistent across different age groups. Table 1 also demonstrates that, while overall age-adjusted rates were approximately twice as high among nonwhites compared to whites, the rate of glaucomatous blindness registration was eight times higher suggesting that nonwhites either have higher rates of glaucoma, progress to blindness more rapidly, or were even more likely to register as blind than those nonwhites who were blind from other causes.
TABLE 1. Age-Adjusted Prevalence and Incidence of Blindness Registration
per 100,000 Population by Cause, Model Reporting Area Project*
| White | Nonwhite | |||
| Cause | Prevalence | Incidence | Prevalence | Incidence |
| Glaucoma | 8.6 | 0.8 | 72.0 | 6.5 |
| Cataract, total | 16.1 | 1.8 | 40.7 | 4.1 |
| Prenatal | 4.9 | 0.3 | 10.7 | 0.7 |
| Other | 11.3 | 1.5 | 30.0 | 3.4 |
| Retinal disease, total | 34.9 | 4.1 | 48.6 | 5.3 |
| Prenatal | 10.4 | 0.8 | 11.3 | 0.7 |
| Diabetic | 5.9 | 1. 1 | 13.6 | 2.5 |
| Other | 18.5 | 2.2 | 23.7 | 2.1 |
| Retrolental fibroplasia | 4.1 | 0.1 | 1.6 | 0.1 |
| Myopia | 3.8 | 0.3 | 7.9 | 0.6 |
| Corneal/sclera | 4.8 | 0.2 | 21.3 | 1.2 |
| Uveitis | 5.7 | 0.3 | 20.4 | 1.0 |
| Optic nerve disease | 10.1 | 0.8 | 37.5 | 2.0 |
| Multiple causes | 5.4 | 1.2 | 14.0 | 2.8 |
| Other | 13.2 | 1.0 | 32.9 | 2.2 |
| Unknown | 15.0 | 1.6 | 25.3 | 2.9 |
| TOTAL | 121.5 | 12.1 | 322.3 | 28.7 |
* Data from 14 of the 16 participating states.
(Data from Kahn HA, Moorhead HB: Statistics on blindness in the Model Reporting Area. 1969-1970. DHEW Publication No. [NIH] 73–427. Bethesda, MD, National Eye Institute. 1973)
POPULATION-BASED SURVEYS
A variety of population-based data have been collected that permit more accurate estimates of the prevalence of blindness and visual impairment in the population of the United States. The most regularly conducted is the Health Interview Survey from the National Center for Health Statistics.7 Unfortunately, it is based solely on responses to a questionnaire, with severe visual disability defined as a reported inability to see well enough to read a newspaper even using glasses. Data from the 1977 version of the survey showed a prevalence of 0.8 per 1000 population among those less than 45 years of age, 6.6 per 1000 population for those 45 to 64 years, and 47 per 1000 population for those 65 years or older.8 Nonwhites had between 1.7 and 2.7 times higher rates than whites depending on age, with the larger difference among those less than 65 years of age. Lower socioeconomic status as measured by educational level of the head of the household or by family income was also associated with higher rates of severe visual disability. While these data are not based on objective examinations and therefore cannot tell us the level of visual acuity loss or its cause, they do describe in some minimal fashion the functional visual status of the population.
Another source of national data, the National Health and Nutrition Examination Survey (NHANES), was also conducted by the National Center for Health Statistics in the early 1970s.9,10 A nationally representative sample of persons 4 to 74 years of age were included in the first 35 sites for which there was an ophthalmologic component. Unfortunately, the number of blind persons defined as best-corrected visual acuity of 20/200 or worse was very small (21 out of 3081 persons 45 years or older), and the number of ophthalmologists involved in the examinations large, so that detailed data on cause of serious vision loss were not considered reliable. The observed prevalence for those 45 to 64 years of age was 0.1% and for those 65 to 74 years of age, 1.1%.9 Good nationally representative data on less severe vision loss are available from this survey; however, the data on blindness are less certain due to sample size problems.
Since the NHANES project in the early 1970s, no further nationally representative data based on objective assessment of visual function such as visual acuity have been collected by the National Center for Health Statistics. The current round of NHANES data collection does not include an ophthalmological component. As a result of the lack of adequate data on prevalence and causes of blindness as well as increasing interest regarding the epidemiology of selected ophthalmic diseases, a number of population-based studies in smaller, more selected populations have been conducted over the past 15 years. The most well known of these surveys is the Framingham Eye Study, which examined 2631 persons 52 to 85 years of age who were survivors of the original Framingham Heart Study cohort.11 Each subject received visual acuity testing and an ophthalmologic examination. The rate of bilateral blindness defined as visual acuity of 20/200 or worse in the better eye was 0.07% among those 52 to 64 years, 0.82% among those 65 to 74 years, and 2.03% among those 75 years or older. Females had twice the rate of blindness as males, but these figures are based on only 16 blind persons. The diseases associated with blindness in these 16 persons are shown in Table 2. While the specific disease that was primarily responsible for blindness was not determined, it is clear that cataract and age-related macular degeneration form the bulk of the associated ocular pathology. Rates of blindness from this study were the first to confirm that the rates reported from the Model Reporting Area were underestimates. Observed rates from the Framingham Eye Study were at least 2.5 times higher than those reported from the Model Reporting Area data.11 One serious weakness in the Framingham study was its lack of generalizability to populations that were not white and middle to upper class.
TABLE 2. Distribution of Diagnoses Among Bilaterally Blind Persons, Framingham
Eye Study
| Diagnosis | Number of Blind Persons with Diagnosis* |
| Senile cataract | 11 |
| Open-angle glaucoma | 1 |
| Diabetic retinopathy | 3 |
| Age-related macular degeneration | 7 |
| Other | 3 |
* Total bilaterally blind persons = 16
(Data from Leibowitz HM, Kreuger DE, Maunder LR et al: The Framingham Eye Study monograph. Surv Ophthalmol [suppl] 24:335, 1980)
The Mud Creek Study was conducted in order to examine the prevalence and causes of blindness and visual impairment in an ophthalmologically underserved population.12 A total of 1136 white persons 40 years of age or older residing in the Mud Creek area of Appalachian Kentucky were screened for visual acuity and examined by an ophthalmologist if their vision was less than 20/60 in either eye. The prevalence of bilateral blindness (20/200 or worse) was 1.1% and 0.44% using the World Health Organization (WHO) definition of blindness (less than 20/400 in the better eye). Cataract and age-related macular degeneration were responsible for the vast majority of blindness; however, two of the 12 bilaterally blind persons had corneal scarring compatible with the cicatricial sequelae of trachoma, both of whom reported having been to trachoma hospitals during their teenage years.
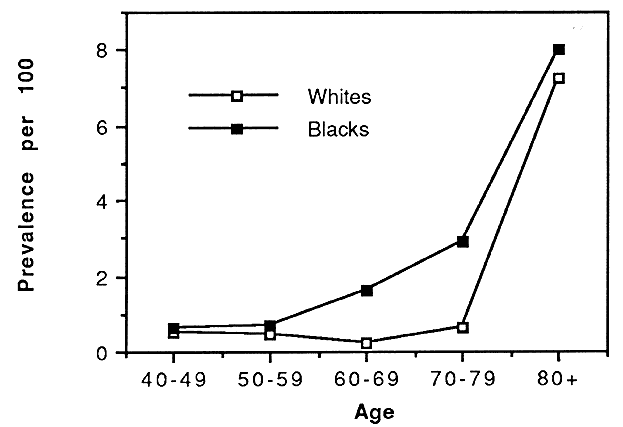
The Baltimore Eye Survey, conducted in the mid to late 1980s, focused on vision problems among a multiracial urban population in east Baltimore.13–15 This study examined 5308 black and white persons 40 years of age or older based on a stratified cluster sampling technique. Subjects received an enrollment interview in their homes and were then invited to a local center in their neighborhood for an ophthalmic screening examination. The screening examination consisted of refraction and measurement of visual acuity, visual fields, intraocular pressure, and stereo fundus photography of the optic disc and macula. In addition, subjects completed a detailed personal interview regarding their medical and ophthalmic histories, family history of glaucoma, use of medications, and other potential risk factors. Persons who tested positively based on a variety of criteria including best-corrected visual acuity of less than 20/30 in either eye were referred to the Wilmer Eye Institute at The Johns Hopkins Hospital for definitive diagnostic evaluation. Results of this study demonstrated that blindness was strongly associated with both age and race, with blacks having higher rates at every age (Fig. 3).13 The age-adjusted relative prevalence of blindness (black/white) was 2.3. However, after adjusting for other variables related to socioeconomic status, that ratio fell to 1.42 indicating a strong relationship between blindness and poor social and economic status.14 Causes of blind eyes among the 64 persons who were bilaterally blind highlighted the potential influence of access to and utilization of eye care services on rates of blindness. The leading cause of blind eyes was senile cataract followed by glaucoma and age-related macular degeneration.15 Cataract and glaucoma were especially important causes among blacks accounting for 30% and 26% of blind eyes, respectively. Among whites, age-related macular degeneration was the leading cause followed by senile cataract; however, neither of these conditions caused blindness among whites until after 80 years of age. In contrast, senile cataract and glaucoma were responsible for blindness among blacks beginning at age 50 or older. Of the 64 persons who were bilaterally blind, 27 (42%) could have had their vision partially or completely restored with appropriate surgical intervention, the most common being cataract surgery.15
The most recent population-based data on blindness and visual impairment come from the Beaver Dam Eye Study conducted in south-central Wisconsin.16 A total of 4926 white persons 43 through 86 years of age received refraction and visual acuity testing as well as a number of other tests and examinations. The prevalence of blindness arose with age for both males and females from a low of 0.1% among both men and women between 43 and 54 years of age to 1.1% of men and 2.6% of women 75 years of age or older. Of particular interest from this study was the extremely high prevalence of blindness among those few participants who were residents of nursing homes at the time of the examination. Of the 45 subjects in whom visual acuity could be reliably tested, 11.1% were legally blind.16 The rate was 4.9 times higher among those 75 years or older who lived in nursing homes compared to their contemporaries living in the community. Other studies of nursing home residents have also shown high rates of blindness and visual impairment among this institutionalized subgroup of the population,17,18 but the Beaver Dam study was the first report based on population-based sampling techniques.


