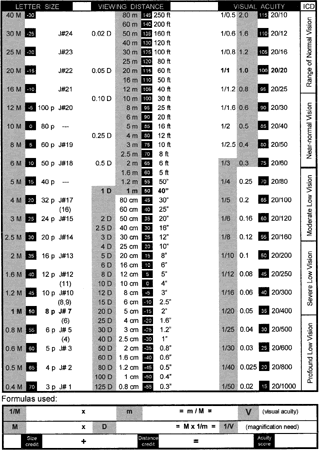
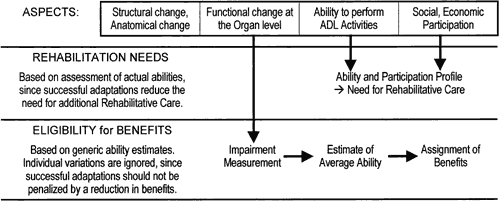
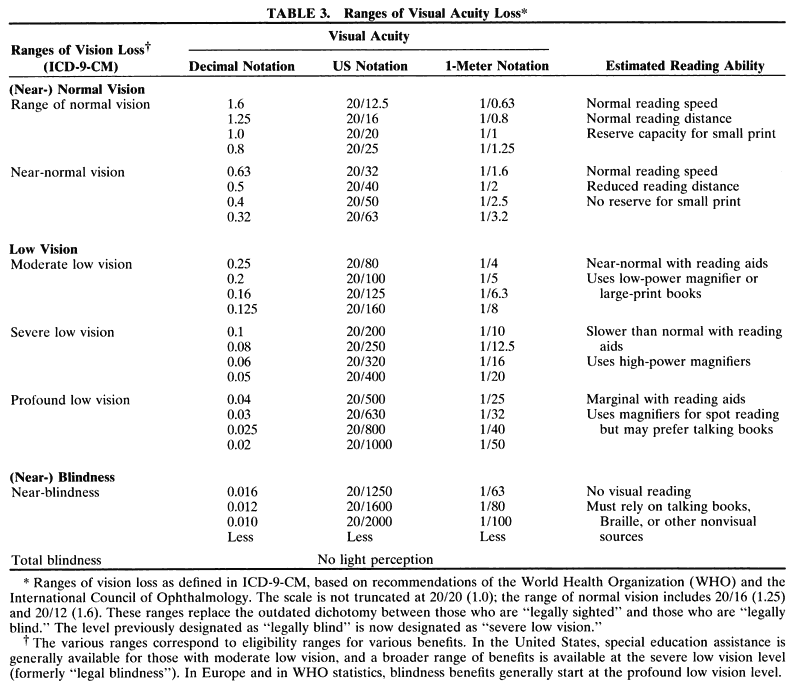
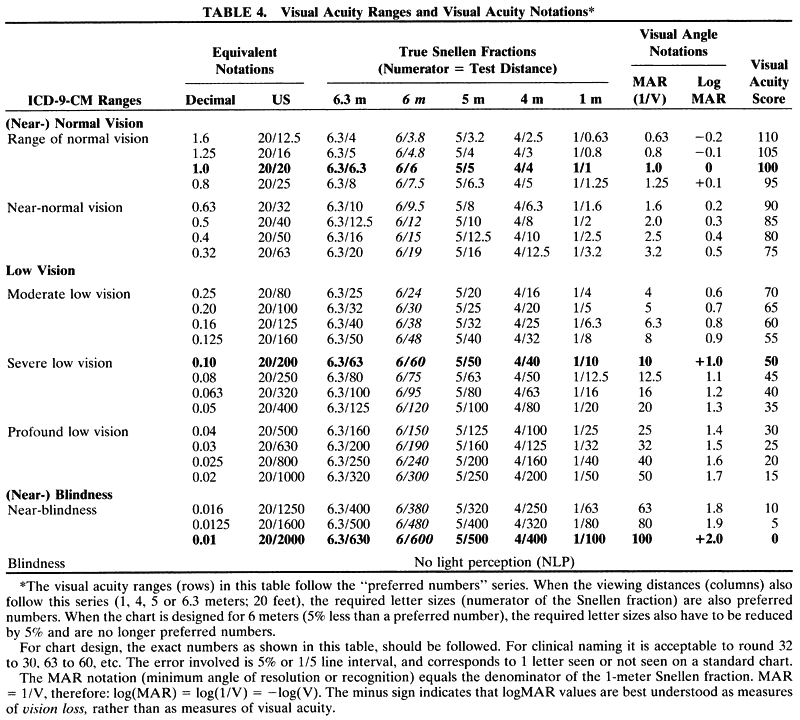
DISTANCE VISION Ranges of Vision Loss Vision loss is not an all or none phenomenon. Since the 1970s, the WHO
has recognized this by replacing the simplistic dichotomy between those
who are considered legally blind and those who are considered legally
sighted with a set of ranges. In ICD-928 and ICD-9-CM,30 the range of low vision took its place between the ranges of normal (or
near-normal) vision and blindness (or near-blindness). The word low indicates that these individuals do not have normal vision; the word vision indicates that they are not blind. The ranges used in ICD-9-CM are listed
in Table 3.
Although these changes were made a quarter century ago, the use of the
term blindness to denote partial vision loss is still prevalent. This is regrettable, since
it fosters misconceptions among patients and practitioners. Patients
tend to accept the statement that they are legally blind as an irreversible
verdict of hopelessness. Telling them that they have severe
low vision (the corresponding ICD-9-CM term) tells them that they have
a problem but that there are ways to cope with it. To call a patient
with a severe vision loss
“legally blind” is as preposterous as calling a patient with
a severe heart ailment
“legally dead.” Measurement Considerations Letter recognition, on which clinical visual acuity measurement is based, is
a rather complex function that involves not only optical factors
but also cognitive and motor abilities. When choosing our test parameters, we
strive to keep the cognitive and motor requirements minimal so
that we measure mainly optical factors. Within the group of optical
factors, we strive to keep factors such as contrast and illumination optimized
so that the main remaining variable is magnification. Visual acuity can be thought of as the reciprocal of the magnification
threshold for letter recognition. Magnification is the factor on which
Snellen's formula is based. If a subject needs letters that are
twice as large or twice as close as those needed by a standard eye, the
visual acuity is said to be 1/2 (20/40, 0.5), if the magnification need
is 5× , the visual acuity is 1/5 (20/100, 0.2), and so forth. It is not always possible to avoid the cognitive factors. This is the case
for infants and preschool children who do not yet know the entire
alphabet. For them, we often use other methods, such as grating detection
or picture recognition. It is important to realize that these are
different tasks, which may have different magnification requirements. Similar
considerations exist for developmentally delayed individuals. Sometimes
it appears that the motor concept of directionality that is
required to respond to tumbling Es is a limiting factor. Testing with
different modalities may help to give an insight into these nonoptical
factors. In elderly stroke patients with macular degeneration, the question
may arise whether inability to read is the result of the macular
degeneration or of the stroke. Failure to respond to larger print may
point to cognitive rather than optical factors. In the following discussions, it
will be assumed that cognitive and motor factors are indeed
trivial. Even so, many choices remain to be made, including test distance, letter
size progression, criterion, contrast and illumination, visual
acuity notation, and test symbols. CHOICE OF TEST DISTANCE FOR NORMAL AND NEAR-NORMAL VISION. Most patients seen in ordinary practice have visual acuity in the range
of normal and near-normal vision (20/60 or better, ICD-9-CM; see Table 3). For these patients, the most commonly used testing distances are 20 feet, 6 meters, and 5 meters. These distances were chosen not because
they are especially appropriate for visual acuity measurement but because
at these distances the optical difference with infinity may be ignored. The
stimulus for the development of the letter chart came from
Donders' work on refraction. Traditional chart designs reflect the emphasis
on screening and on refractive use. In the near-normal range, the
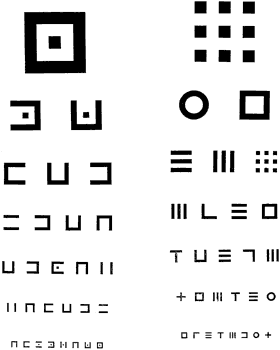
steps between letter sizes are small; for lower acuity they become larger (see Fig. 10); for acuity worse than 20/200 (0.1), vague statements such as
“count fingers” and “hand motions” are used. 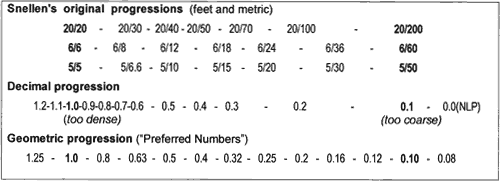 Fig. 10. Various letter size progressions. The spacing in this chart is proportional
to the step sizes. Only a geometric progression maintains the same
step size throughout. Fig. 10. Various letter size progressions. The spacing in this chart is proportional
to the step sizes. Only a geometric progression maintains the same
step size throughout.
|
In 1973 Hofstetter proposed the use of a 4-meter test distance34 for use in smaller rooms. For visual acuity measurement, this distance
is as valid as any other distance, provided that it is properly entered
into the Snellen formula. Sloan liked the 4-meter distance because
it made for easy conversion to a 40-cm reading distance. The ETDRS charts
adopted it because charts with the Bailey-Lovie layout would have
to be substantially wider if designed for 5 or 6 meters. At 4 meters, however, the
accommodative demand becomes 0.25 diopter and can no longer
be ignored. Another option for small rooms is the use of mirrors. For young children, a test distance of 10 feet or 3 meters is often recommended, because
it is easier to hold their attention at the shorter
distance. CHOICE OF TEST DISTANCE FOR LOW VISION. A much smaller group of patients has visual acuity in the low-vision range (less
than 20/60, ICD-9-CM; see Table 3). For this group, the magnification need for visual rehabilitation becomes
an important objective. Kestenbaum35 pointed out that the magnification need can be found by taking the reciprocal
of the visual acuity (e.g., 20/100 requires 100/20 = 5× , 20/200 requires 200/20 = 10× ). Bringing the chart from 20 feet (6 meters) to 10 feet (3 meters) can double the measurement range, but
bringing the chart to 1 meter extends it by a factor 6× . Measuring
at 1 meter has the additional advantage that the Snellen fraction
is as simple as possible (1/ …) and can be converted easily
to an equivalent for any other distance by multiplying numerator and denominator
by the same number (e.g., 1/20 =20/400 = 5/100 = 6/120 = 0.05). The 1-meter
column in Table 3 shows that a 1-meter chart with letters up to 50 M can cover the entire
low-vision range down to 1/50 (20/1000, 0.02). Taking the same chart
to 10 feet would extend the measurement range only to 20/300 (0.06). At short distances, such as at 1 meter, it becomes critically important
to maintain the viewing distance accurately. A movement of only 10 cm (4 inches) would
introduce a 10% error. This can be prevented with a 1-meter
cord attached to the chart (Fig. 9). Such charts can be homemade or purchased commercially.36 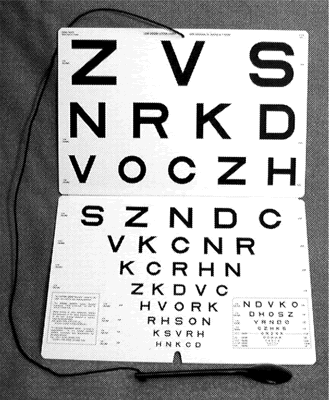 Fig. 9. One-meter chart. This chart is designed for measurement at 1 meter in the
low-vision range. It allows accurate measurement of visual acuity from 1/50 (20/1000, 0.02) to 1/1 (20/20, 1.0). A 1-meter cord is attached
to maintain the viewing distance.36 Fig. 9. One-meter chart. This chart is designed for measurement at 1 meter in the
low-vision range. It allows accurate measurement of visual acuity from 1/50 (20/1000, 0.02) to 1/1 (20/20, 1.0). A 1-meter cord is attached
to maintain the viewing distance.36
|
Optical correction for refractive error is important for this group, but
the question
“better or worse?” looses significance when the patient cannot
see the letters on a chart at 20 feet. Being able to see several lines
on a 1-meter chart can provide major encouragement and better responses
to subjective refraction. Presbyopic patients need a 1 D correction
for the 1-meter distance. This is easier to provide than a 1/3-D
correction for a 10-foot (3-meter) distance.37,37a CHOICE OF LETTER SIZE PROGRESSION. Snellen's original charts had small steps for the normal range and
larger steps for the lower ranges. Introduction of the decimal acuity
notation19 led to charts with visual acuity steps in 0.1 increments. On these charts
the steps at the top of the scale, such as 0.9 → 1.0 → 1.1, are
too small to be practical. If equal increments of the denominator
were used, the steps at the bottom of the scale would be too small
to be useful. The only scale that can span the full range is a logarithmic
scale, based on equal ratios between each pair of successive lines. This
is in accordance with Weber-Fechner's law,38 which states that geometric increments in stimulus give rise to linear
increments in sensation. Westheimer39 has shown that this also holds for visual acuity. Figure 10 compares various progressions. Use of Preferred Numbers. Various geometric progressions are possible. The one that fits best with
the decimal system is one in which 10 steps equal 10× , so that
the same numbers repeat in each
10× interval, with only a shift in decimal place. A very convenient
feature of this series is that 3 steps equal 2× . When this series
includes the values 1 and 10, it is known as the preferred numbers series. It is extensively used in international standards* and, indeed, is the subject of an international standard itself.40 This is the series that Green used in 1868.
Its use in standards goes back to Renard, a French army engineer, who used
it in the 1870s to reduce the number of cables for hot-air balloons
from 400 to 17. In his honor, the series is also known as Renard series.An important characteristic of the preferred numbers series is that the
product or quotient of two preferred numbers is again a preferred number. Thus, if
letter sizes and viewing distances follow the series, so
will the resulting visual acuity numbers. A visual acuity chart based
on this feature was published by M.C. Colenbrander41 in 1937. Sloan and Bailey both used the progression but apparently were unaware
of the preferred numbers standard. For the Sloan and ETDRS charts, this
does not make a difference, since 20 feet and 4 meters are both preferred
numbers. Bailey anchored his series at a 6-meter viewing distance, which
is 5% off the closest preferred number (6.3); therefore, his
letter sizes include values such as 19, 48, and 95 instead of 20, 50, and 100 (Table 4). For clinical use, these 5% differences can be ignored. The tables and
figures in this chapter are based on the use of preferred numbers.
CHOICE OF CONTRAST AND ILLUMINATION. Contrast and illumination both influence visual acuity. Fortunately, in
the range of commonly used values, this influence is minimal. If contrast
is reduced to a level where it affects visual acuity, we speak of
a contrast sensitivity test, which is discussed elsewhere. If illumination
is lowered to threshold values, we may speak of a dark adaptation
test. Visual acuity is usually not affected until contrast drops below 20%. Normal
visual acuity charts have contrasts of 80% or better. For use in
a routine eye examination, projector charts in a dim or darkened room
are generally preferred. In the United States, the average projector
chart has a luminance of about 85 cd/m2; European charts are generally brighter, up to 300 cd/m2. The lower luminance has the advantage that the pupil may be wider, so
that refractive errors may be more obvious; the brighter charts have
the advantage that they suffer less from stray light, which causes contrast
degradation. The ICO Visual Acuity Measurement Standard23 recommends a range that includes both the lower and the higher values. To predict the everyday performance of patients, a lighted printed chart
in a lighted room is preferred. Front lighting is easiest to implement. Back
lighting of a translucent chart on a light box gives the most
even and most reproducible illumination. The usual backlit ETDRS chart
has an illumination level of about 200 cd/m2. For patients with conditions such as albinism or rod dystrophy, it should
be possible to reduce the illumination, which may result in a significant
increase in visual acuity. A presentation method, which undoubtedly will gain more widespread use
in the future, is presentation on a computer screen. This allows presentation
of single letters, as well as presentation in a letter chart format. It
also allows control over parameters such as crowding, contrast, and
brightness. CHOICE OF VISUAL ACUITY NOTATION. The result of the visual acuity measurement can be recorded in a variety
of ways. True Snellen Fractions. The notation promoted by Snellen was that of a true Snellen fraction, in
which the numerator indicates the actual test distance and the denominator
indicates the actual size of the letter seen. The advantage of
this notation is that it indicates the actual test conditions. The disadvantage
is that it becomes awkward to compare visual acuity values measured
under different conditions. This is especially true for projector
charts, where the projector magnification is often adjusted to accommodate
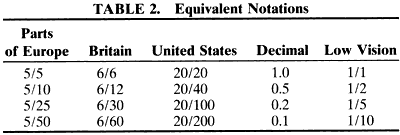
fractional viewing distances. Snellen Equivalents. To overcome this difficulty, Snellen equivalents are used. In Europe, the
decimal equivalent of the Snellen value is used most often. This notation
is clear because there is no numerator or denominator. The notation
becomes confusing when the decimal notation is converted back to
a pseudo-Snellen fraction. For example,5/25 = 0.2 = 2/10; the 2/10 fraction
would suggest that the subject saw a 10 M letter at 2 meters, instead
of a 25 M letter at 5 meters. In the US Notation, a 20-foot fraction is usually used as a Snellen equivalent. For example, in
an examination lane of 18 or 21 feet, the true Snellen fractions
would be 18/18 or 21/21. Instead, the visual acuity is recorded as 20/20 in
both cases. Thus, seeing 20 as the numerator of a visual acuity
fraction rarely implies that the actual measurement was made at 20 feet. In Britain, the 6/6 notation is similarly used as a Snellen equivalent. Visual Angle Notation was used by Louise Sloan. It refers to the visual angle of the stroke
width of 5 × 5 letters. Thus, 1 minute equals 20/20 (1.0), 2 minutes
equals 20/40 (0.5), and so forth. The visual angle is the reciprocal
of the visual acuity value and equals the denominator of the 1-meter
Snellen fraction. Others have used the acronym MAR. In the context
of physiologic optics, this term is usually interpreted as
“minimal angle of resolution” and best describes grating acuity; in
the context of psychophysics and clinical testing it might be
better interpreted as
“minimum angle of recognition,” while in the context of vision
rehabilitation it might be interpreted as
“magnification requirement.” Because higher MAR values indicate
poorer vision, MAR should be considered a measure of vision loss. LogMAR Notation was introduced by Bailey.31 As the name implies, logMAR is the logarithm of the MAR value, thus converting
a geometric sequence of letter sizes to a linear scale. Like
MAR, logMAR is a notation of vision loss, since positive logMAR values
indicate reduced vision, while normal vision (better than 20/20, 1.0) is
indicated by negative logMAR numbers. Standard vision (20/20, 1.0) equals 0. On
a standard chart, each line is equivalent to 0.1 logMAR; thus + 1.0 logMAR
means 10 lines lost or 20/200 (0.1), and + 2.0 logMAR
means 20 lines lost or 20/2000 (0.01). Since Bailey used the logMAR notation with a geometric progression of letter
sizes, the term logMAR chart is often used to imply a geometric progression. This is not necessarily
so; a logarithmic scale could be applied to any progression. The decimal
values and reverse scale do not make the logMAR notation particularly
user-friendly. For everyday clinical practice, Snellen equivalents
are easier, since they relate directly to the measured quantities of
letter size and viewing distance. The logMAR notation has gained widespread use in psychophysical studies, for
statistical calculations, and for graphical presentation of the
results of multicenter clinical studies. It provides a more scientific
equivalent for the traditional clinical statement of
“lines lost” or “lines gained,” which is valid
only when all steps between lines are equal. Visual Acuity Rating (VAR; Bailey42) and Visual Acuity Score (VAS; Colenbrander43) are two names given to a more user-friendly equivalent of the logMAR
scale. On the VAR or VAS, 20/20 (1.0) is rated as 100, 20/200 (0.1) is
rated as 50, and20/2000 (0.01) is rated as 0. On an ETDRS-type chart, each
line thus represents a five-point increment. The score can therefore
be interpreted as a count of the total number of letters read, starting
from 20/2000 (0.01). See Table 4 to relate the VAS/VAR, MAR, and logMAR notations to various visual acuity
levels. The VAR relates only to visual acuity; the VAS is part of
a broader scoring system. The VAS, VAR, and logMAR notations convert the geometric sequence of visual
acuity values to a linear scale. This is important if visual acuity
values are to be averaged or subjected to other statistical calculations. The
difference between averaging on a geometric scale and averaging
on a linear scale is best demonstrated with an example. What is the
average of 20/20 and 20/200? Averaging the denominators yields 20/110, a
value too close to 20/200 (see Table 4). Averaging the decimal equivalents (1.0 and 0.1) yields 0.55, a value
too close to 1.0. On the VAS scale, the average of 100 and 50 is 75, which
can be converted back to 20/63 or 0.32 (rounded to 20/60 or 0.3), exactly
halfway. CHOICE OF CRITERION AND ROUNDING OF VALUES. The recorded visual acuity value can be influenced by the choice of completion
criterion and by rounding. Most clinicians record visual acuity
in line increments and consider a line read if more than half of the
letters are read correctly (e.g., three of five on an ETDRS-type chart). A
suffix such as -1 or + 2 may be added to indicate one letter
missed or two letters read on the next line. These suffixes are most
meaningful if the number of letters on each line is constant. On most
charts, the test-retest confidence limits are about ±2 letter
increments or about 0.5 line increment.44 For routine clinical use, in which the patient generally reads each line
only once, rounding to line values is common practice. It is appropriate, since
the rounding errors are of the same order as the confidence
limits. For a finer gradation on an ETDRS-type chart, letter increments can be
counted. The total number of letters read, starting from 20/2000 (0.01), is
the VAR or VAS discussed above. Letter increments are appropriate
in research settings, where measurements are repeated and then averaged
to detect smaller changes. Another factor that can affect the score is whether subjects are encouraged
to guess. Since different subjects may vary in their willingness
to guess, forcing all to guess will produce more homogeneous results. When a subject cannot read a line on a chart, some clinicians present an
isolated line or an isolated letter. This reduces the crowding effect, makes
fixation easier and can improve the VAS. Pointing to a letter
may also make the task easier. One should be aware that using different
presentation modes at different times reduces the comparability of
the scores. CHOICE OF TEST SYMBOLS. Most visual acuity charts use letters. For the patient, this choice gives
a sense of immediate validity when the primary objective is to read. For
the practitioner, errors are easy to spot, since most practitioners
know their chart by heart. Use of letters, however, is warranted only
if the assumption may be made that familiarity with the alphabet plays
a trivial role. The Sloan letter set is shown in Figure 11. For less literate adults, the use of a number chart may be more appropriate. For illiterate patients and preschool children, pictures may be used. However, it
is difficult to judge the equivalence of letters and pictures, and
a child's performance may depend on whether naming of pictures
is a game that is played at home. LEA symbols (Fig. 12) were devised by Lea Hyvärinen.45 They form a set of four simple symbols (square, circle, house, apple) that
require little naming ability. They are left-right symmetrical, so
that left-right reversals in young children will not influence the results. They
have been designed to blur equally and have been calibrated
against Landolt Cs46 (Fig. 13). They form excellent tests for children and can also be used for adults. The
same symbols are used in a variety of tests—as a letter
chart, as a contrast sensitivity chart, in a reading format, on single
symbol cards, on a domino game for older children, and as a jigsaw puzzle
for the very young. 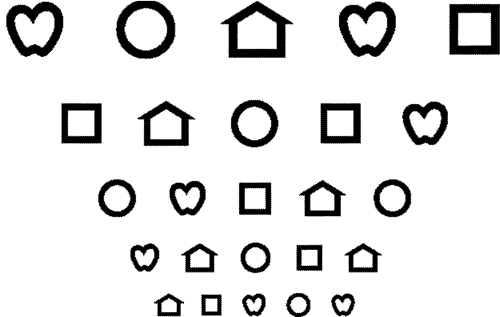 Fig. 12. Segment of a chart with LEA symbols. This chart combines the Bailey-Lovie
layout with LEA symbols for use with children and illiterate subjects. Fig. 12. Segment of a chart with LEA symbols. This chart combines the Bailey-Lovie
layout with LEA symbols for use with children and illiterate subjects.
|
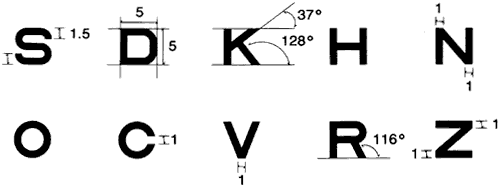
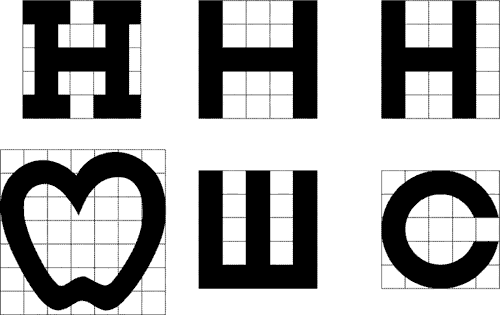 Fig. 13. This chart depicts a selection of commonly used optotypes. Top: Snellen
H (with serifs, 5 × 5), Sloan H (no serifs, 5 × 5), British
H (no serifs, 4 × 5). Bottom: LEA symbol, tumbling E, Landolt
C. The latter groups have only four symbols each so that the guessing
level is higher than with letter charts. Most optotypes approximate the
recognizability of Landolt Cs; they represent 20/20 (1.0) acuity when
their height subtends 5 minutes. Recognition within the LEA symbol
set is more difficult; calibration experiments established that the symbols
needed to be about 35% larger. Fig. 13. This chart depicts a selection of commonly used optotypes. Top: Snellen
H (with serifs, 5 × 5), Sloan H (no serifs, 5 × 5), British
H (no serifs, 4 × 5). Bottom: LEA symbol, tumbling E, Landolt
C. The latter groups have only four symbols each so that the guessing
level is higher than with letter charts. Most optotypes approximate the
recognizability of Landolt Cs; they represent 20/20 (1.0) acuity when
their height subtends 5 minutes. Recognition within the LEA symbol
set is more difficult; calibration experiments established that the symbols
needed to be about 35% larger.
|
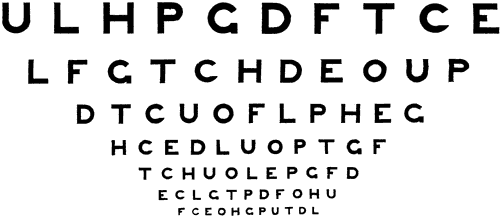
The HOTV test contains four symbols—H, O, T and V—also chosen because they
have no characteristics that require a sense of laterality. To standardize
the effect of contour interaction when the symbols are presented
singly, they may be surrounded by crowding bars. Tumbling Es are probably the symbols most often used for the testing of children. They
do require a sense of laterality, which can be a stumbling block
for young and for developmentally delayed children. They can be presented
in a chart format or as single symbols. When comparing findings, it
should be remembered that presentation as single symbols is an easier
test than presentation in a chart format. Comparison of these different
conditions and of findings on a closer spaced chart may give insight
in the importance of crowding and of lateral contour interaction, which
can be particularly informative in the treatment of amblyopia. Tumbling Es also are the basis for the WHO low-vision training kits, which
are widely used in developing countries and in countries where the
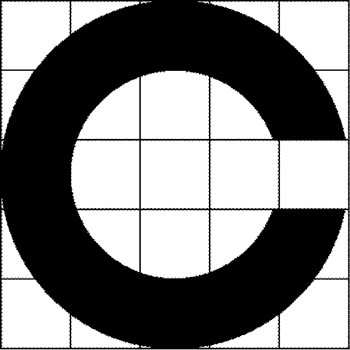
Roman alphabet is not used. Landolt Cs22 have become the symbols of choice for many scientific measurements. They
are much less frequently used in a clinical setting, except in Japan, where
the characters of the Kanji alphabet are too complex. When used
in a chart format, it is harder to detect errors unless the observer
points to the symbol. However, pointing, like single presentation, affects
the difficulty of the test. The Visual Acuity Measurement Standard of the ICO23 requires that letter charts in non-Roman alphabets (e.g., Cyrillic, Arabic, Hindi, Kanji, Hebrew) be calibrated against Landolt Cs for equal
recognizability. Grating acuity is another visual acuity measurement that is used mostly in the laboratory
and mostly in connection with contrast measurements. For infants
it can be used on cards as a preferential looking test. Preferential looking is a detection test and thus not strictly equivalent to a recognition
test. Summary When recording visual acuity for patients in the range of normal vision, the
preferred measurement tool will often be a projector chart at 5 or 6 meters
or 20 feet in a darkened room. The preferred notation will
be a Snellen equivalent. In continental Europe this is most often decimal
notation; in Britain it is the 6/6 equivalent; in the United States
it is the 20/20 equivalent. When recording visual acuity for patients in the low-vision range, the
preferred tool is a lighted chart in a lighted room at a distance of 1 meter. The
preferred notation will be a true Snellen fraction with 1 as
the numerator. It is often useful to add the commonly used Snellen
equivalent in parentheses. Thus, the ability to recognize an 8 M letter
at 1 meter would be recorded as 1/8 (20/160) or 1/8 (0.125). If the
same patient were tested on an ETDRS chart at 4 meters, the notation could
be 4/32 (1/8, 20/160). NEAR VISION MEASUREMENT Although the testing of reading vision predated the development of letter
charts to measure distance vision, the methodology to accurately measure
reading acuity has lagged behind. This is in part due to the fact
that the prescription of a reading correction for normally sighted individuals
is aimed more at achieving reading comfort than at accurate
measurement. It is also due to the lack of accurate measuring tools. Reading
distances are more often estimated than measured, while the
“Jaeger numbers,” which are widely used in the United States, have
no numerical meaning. Under these circumstances, it is not surprising
that many practitioners believe that reading acuity and distance
acuity have little in common. We will show that this is not so. As is the case for distance vision, accurate determination of near vision
acuity requires measurement of two variables—letter size and
viewing distance. For distance vision, the viewing distances are standardized, so
that only the letter sizes vary. For individuals in the normal
visual acuity range, reading distances may be standardized, but the
standards vary. Some use 40 cm (16 inches, 2.5 D reading), or 14 inches (35 cm, 2.75 D), others use 33 cm (13 inches, 3 D) or even 30 cm (12 inches, 3.25) or 25 cm (10 inches, 4 D, the reference point for the
power of magnifiers). Individuals in the low-vision range often need
distances that are even shorter and certainly cannot be handled with
a
“one size fits all” distance. They need a formula in which
both the letter size and the viewing distance can be varied easily. Modified Snellen Formula The standard Snellen formula, V = viewing distance ÷ letter size, becomes
awkward to use when the numerator (viewing distance in meters) is
itself a fraction within a fraction. This can be overcome by using
the reciprocal value of the viewing distance. The reciprocal of a metric
distance is known as the diopter (e.g., 2 D = 1/2 meter, 5 D = 1/2 meter).20 The traditional formula

thus becomes
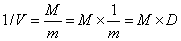
or1/V = M × D = letter size (in M-units) × viewing distance (in
diopters) Use of this modified Snellen formula has several advantages: - Use of reciprocal values turns the usual Snellen fraction into a multiplication, and
the viewing distance changes from a fraction into a whole
number. Both changes make the formula far easier to calculate in one's
head.
- The value 1/V relates directly to the letter chart acuity measured at 1 meter; the
numerator indicates the amount of magnification needed to
bring the subject to standard performance.
- Expressing the reading distance in diopters relates directly to the amount
of accommodation or the reading add that must be used for this distance.
The results of these calculations are listed in Figure 14. This figure is based on the use of preferred numbers, so that the same
values appear for the viewing distances, the letter sizes, and the resulting
visual acuity values. 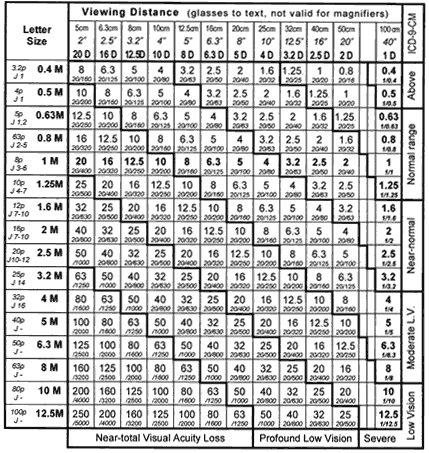 Fig. 14. Modified Snellen formula (1/V = M × D) for near vision. Columns indicate
reading distances. Rows indicate letter sizes. The resulting reading
acuity values are found at the intersections. The large number
in each box represents the M × D value (magnification requirement). The
small number represents the visual acuity value. The visual acuity
values are arranged in diagonal bands. The same visual acuity value
can be represented by many different combinations of viewing distance
and letter size. For each diagonal band, the outer edge of the figure
indicates the ranges of vision loss in ICD-9-CM. The J designations
in the first column refer to values found on current charts. These are
different from Jaeger's original sizes, which are shown in Figure 7. Fig. 14. Modified Snellen formula (1/V = M × D) for near vision. Columns indicate
reading distances. Rows indicate letter sizes. The resulting reading
acuity values are found at the intersections. The large number
in each box represents the M × D value (magnification requirement). The
small number represents the visual acuity value. The visual acuity
values are arranged in diagonal bands. The same visual acuity value
can be represented by many different combinations of viewing distance
and letter size. For each diagonal band, the outer edge of the figure
indicates the ranges of vision loss in ICD-9-CM. The J designations
in the first column refer to values found on current charts. These are
different from Jaeger's original sizes, which are shown in Figure 7.
|
Many reading cards are calibrated for a specific reading distance (i.e., for
a specific column in Fig. 14). This has led to the habit of using visual acuity values to refer to
letter sizes. For instance, a letter size that would represent 20/100 at 40 cm
might be referred to as a 20/100 letter. Figure 14 shows that the same letter at 25 cm would represent an entirely different
acuity value. A 20/100 letter on a 20-foot chart is very different
again. As visual acuity drops (M × D increases), subjects can compensate
in two ways: they may move to a different column, bringing the same print
size closer by increasing the reading add (or the amount of accommodation
in younger people), or they can move to a different row, thereby
enlarging the print size while maintaining the reading distance. Large-print
books enlarge the physical print size; various magnification
devices enlarge the virtual print size. Under most circumstances, letter chart acuity and reading acuity—if
measured appropriately and with the proper refractive correction—are
similar. However, when measuring letter chart acuity, subjects
are often pushed for threshold or marginal performance, whereas reading
tests more often aim at a level of comfortable performance. For this
reason, the magnification requirement for reading acuity may be somewhat
greater than that for letter acuity. The difference, known as the magnification reserve,47 is needed for reading fluency. While 20/20 (1.0) acuity implies the ability to read 1 M print at 1 meter, comfortable
reading of newsprint (1 M) is generally done at 40 cm, indicating
a 2.5× magnification reserve (four line intervals). Traditionally, the
power of magnifiers is referenced to the ability to
read at 25 cm (10 inches). One M at 25 cm denotes 20/80 (0.25). This
is the top value in the low-vision band (see Table 3). To verify the relation between reading acuity and letter chart acuity, the
two values were compared for 150 consecutive patients from my low-vision
service. The results are shown in Figure 15. I found that a close relationship exists between letter chart acuity
and reading acuity and that this relationship holds up at all visual acuity
levels. Usually, the two are within one line from each other (diagonal
gray band in Fig. 15); for some patients the magnification need for reading is larger than
the magnification need for letter recognition (spread to the right of
the diagonal). This difference is the magnification reserve, defined above. Since
the objective of visual acuity measurement in the low-vision
range is to help patients function with their own fixation ability, I
do not push patients for maximum letter chart acuity by pointing to
letters or by isolating letters (see the earlier discussion under choice
of criterion). If I had used these techniques to improve the letter
chart acuity, the magnification reserve for reading fluency would probably
have appeared somewhat greater. 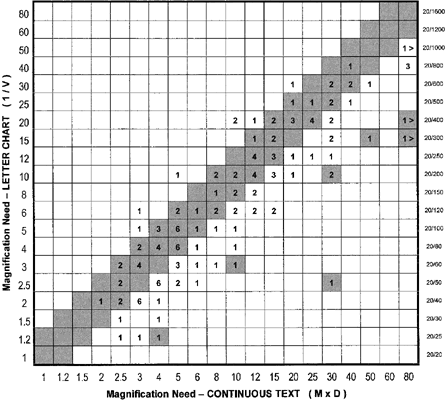 Fig. 15. Magnification need for letter chart acuity and reading acuity. The chart
compares the magnification need found for letter chart testing (1/V) with
the magnification need for continuous text reading (M × D) for 150 consecutive
low-vision patients. The numbers indicate the number
of patients in each cell. For most patients, the two values are the
same or differ by only one line interval (gray diagonal band). For a
number of patients, the magnification need for continuous text is somewhat
greater; this is known as the magnification reserve needed for reading
fluency. For a few patients, the magnification need for continuous
text was significantly greater (isolated gray cells). These patients
represent exceptional cases; for most of them, letter acuity was obtained
in a small island surrounded by scotoma, while reading acuity used
a larger, more eccentric area, requiring more magnification. Fig. 15. Magnification need for letter chart acuity and reading acuity. The chart
compares the magnification need found for letter chart testing (1/V) with
the magnification need for continuous text reading (M × D) for 150 consecutive
low-vision patients. The numbers indicate the number
of patients in each cell. For most patients, the two values are the
same or differ by only one line interval (gray diagonal band). For a
number of patients, the magnification need for continuous text is somewhat
greater; this is known as the magnification reserve needed for reading
fluency. For a few patients, the magnification need for continuous
text was significantly greater (isolated gray cells). These patients
represent exceptional cases; for most of them, letter acuity was obtained
in a small island surrounded by scotoma, while reading acuity used
a larger, more eccentric area, requiring more magnification.
|
Letter Size Notations for Continuous Text For letter charts with metric notation, the unit for letter size measurement
is the M unit, as it was defined by Snellen and named by Sloan. A
corresponding F unit for charts with feet notation was never defined
and would probably only lead to confusion since calculating with nonmetric
measurements is so much harder. The situation for continuous text
letter sizes is more diverse. JAEGER NUMBERS. In the United States, Jaeger numbers are widely used. We have seen that
these numbers have no numeric meaning since they refer to item numbers
in a printing house catalog in Vienna in 1854. They cannot be used for
calculations. Furthermore, since Jaeger did not establish an external
reference, those who wanted to produce similar samples had to approximate
Jaeger's samples with fonts that happened to be available
at their local print shop. The result is great inconsistency in the use
of Jaeger numbers. The first column in Figure 14 indicates the range of Jaeger ratings that were found to represent the
same physical letter size on a number of contemporary Jaeger cards. Other countries have used similar samples, such as de Wecker samples in
Germany and Parinaud samples in France. PRINTER'S POINTS. The need for a numeric designation lead some practitioners to the use of
printer's points. This might have been useful if printer's
points referred to the letter height; instead they refer to the height
of the slug on which letters used to be mounted. On average, lowercase
letters tend to be about 50% of the slug height. Thus, 1 point (slug height) = 1/72 inch
1 point (letter size) = about 1/144 inch
However, this relationship varies with the type font. For example, in the
TrueType (TT) family of computer fonts, an Arial letter of 8 points
has the same size as a Times New Roman letter of 9 points. Another problem
is that the point notation does not apply to the optotypes used
for distance vision, so that comparison of far and near measurements is
impossible. A AND N SERIES. On British type samples the size inprinter's points is designated
by the notation N = .British cards often also carry an A = notation. The
A series is based on the logarithm of the letter size. As such, it
is related to the
“letter size credit” mentioned in Figure 7 (A = 17 - [letter size credit] ÷ 5). M-UNITS. The M-unit is the only letter size unit that applies to distance charts
as well as to reading samples, so it is the only unit that allows comparisons
between the two tests. The M-unit is used in this chapter and
on an increasing number of newer reading cards. It is convenient that 1 M
is the size of average news print. By definition, 1 M-unit subtends 5 minutes of arc at 1 meter and equals 1.454 mm. Useful
equivalents include the following: 7 M = 10 mm (error -2% or 0.1 line
interval) and 1 M = 1/16 inch (error + 10% or 0.4 line
interval). Based on the size of lowercase letters without ascenders
or descenders (x-height), 8 points = 1 M for the TT Arial and TT
Courier computer fonts, but for the TT Times New Roman computer font, 1 M = 9 points. Reading Fluency For reading tests, it is important to record not only the letter size and
the distance at which the subjects can just decipher the text but also
the level at which they can read with reasonable fluency. Most reading
cards have short paragraphs with large letters and longer paragraphs
with smaller letters. On such cards only a subjective comparison of
reading fluency with different levels of magnification is possible. Cards on which all paragraphs have the same length offer the opportunity
to measure the reading speed objectively. This layout was pioneered
by the MN-read cards48 and is now also available in other cards in multiple languages (Fig. 16).36 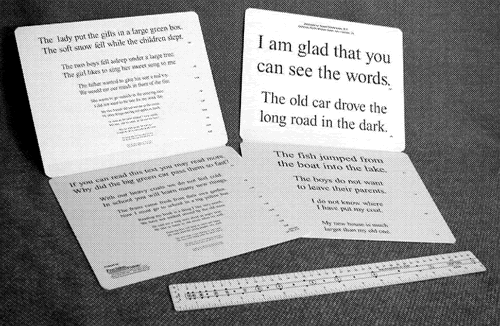 Fig. 16. Reading card with proportional paragraphs. All paragraphs on this chart
have the same length so that reading times and reading fluency can be
compared. The set of smaller paragraphs is duplicated to avoid memorization. A
ruler with a diopter scale is provided to compare the reading
distance to the reading add and to facilitate the use of the modified
Snellen formula (1/V = M × D). Various languages are available. The
same text appears on the back of the chart in Figure 9. Fig. 16. Reading card with proportional paragraphs. All paragraphs on this chart
have the same length so that reading times and reading fluency can be
compared. The set of smaller paragraphs is duplicated to avoid memorization. A
ruler with a diopter scale is provided to compare the reading
distance to the reading add and to facilitate the use of the modified
Snellen formula (1/V = M × D). Various languages are available. The
same text appears on the back of the chart in Figure 9.
|
When the reading time is recorded for each print size, the usual pattern
is that the subject reads at a reasonably stable rate at larger print
sizes. At smaller sizes, reading becomes slower and then impossible (fast—fast—slow). The print size just before the reading speed
starts to drop off is the critical print size. Providing magnification
of ordinary print to the critical print size will give the best
reading performance with the least magnification (largest field of view). Some subjects show a pattern that can be characterized as slow—fast—slow. This
pattern occurs when macular degeneration patients
read in a small island of vision within a pericentral scotoma. For large
text, the island is not large enough to cover a whole word; this slows
reading down. At medium print sizes, more letters are covered and
reading speeds up. At the smallest sizes, reading slows down again. The
same pattern can be seen in patients with extreme tunnel vision in end-stage
glaucoma or retinitis pigmentosa. In these cases, it is important
not to prescribe too much magnification. Using the underlining technique
to facilitate tracking along the line may also be beneficial. Occasionally, the pattern is slow—slow—slow. This pattern, which
can be seen in patients with scattered drusen, indicates that magnification
alone will be of limited benefit. In these patients, other
means, such as underlining to facilitate tracking, together with training
and practice in the most effective use of the available retinal areas
can lead to more improvement than magnification alone. Infant Vision Testing In infants, both the physical basis of visual acuity and the cognitive
skills to use it are still developing. Standard visual acuity testing
is impossible, yet early detection of deficits is extremely important. Not
acting on a suspicion of vision loss may cause developmental delays, since
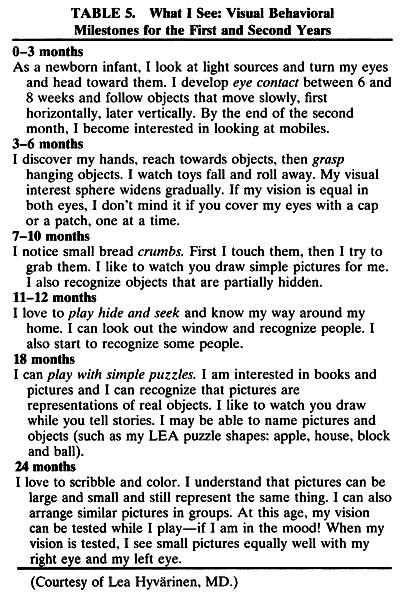
it deprives the infant of its most abundant source of stimulation. Instead of adult vision testing techniques, we must use behavioral observations. The
list in Table 5, supplied by Lea Hyvärinen, provides a transition to the discussion
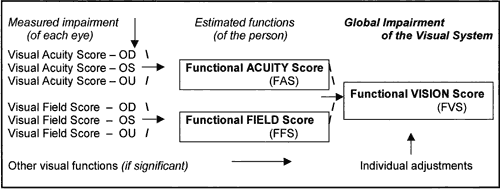
of the next aspect of vision loss: functional vision.
|