Chapter 4
Intravenous Fluorescein Angiography
JOSEPH I. MAGUIRE and JAY L. FEDERMAN
Main Menu   Table Of Contents

Search

FLUORESCEIN DYE
PHOTOGRAPHIC EQUIPMENT
INTERPRETATION
ABNORMAL ANGIOGRAPHIC PATTERNS
IRIS FLUORESCEIN ANGIOGRAPHY
REFERENCES

Fluorescein angiography is a diagnostic technique used in the interpretation of ocular pathologic states. It allows the sequential visualization of blood flow simultaneously through retinal, choroidal, and iris tissues. It gives diagnostic support to clinical impressions based on alterations in fluid dynamics resulting from ocular disease processes. In wide clinical use for just over 35 years,1,2 fluorescein angiography is an invaluable tool in the study, understanding, and treatment of ocular disease.3,4 Its successful use is predicated on several factors: the physical and chemical properties of fluorescein dye, the unique anatomy of the human eye, the expertise of photographers and sophistication of the recording equipment and, most significantly, the ability of the professional to correctly interpret the recorded information.
Back to Top
FLUORESCEIN DYE

HISTORICAL PERSPECTIVE

Fluorescein dye was initially synthesized by Adolf von Baeryer in 1871 and soon found use in the diagnosis of various corneal disorders.5–7 Later work by Paul Ehrlich in 1882 revealed the presence of intraocular fluorescein after parenteral administration in rabbits.8 Study of the fundus by angioscopy after intravenous injection of fluorescein in animals was carried out by multiple investigators until 1955, when MacClean and Maumenee used fluorescein dye in human subjects.9 Novotny and Alvis later developed a photographic system for the sequential documentation of fluorescein flow through the ocular fundus.10,11 Their published reports created a revolution in the understanding and treatment of posterior segment disease.12

CHEMICAL AND PHYSICAL PROPERTIES

Sodium fluorescein (C20H10Na2) is a highly water-soluble complex organic molecule with a molecular weight of 376.27.6,13,14 Its clinical utility results from the physical property of luminescence—the emission of light by means other than incandescence. In the case of fluorescent material, the emission of light is a direct result of excitation by light of a shorter wavelength and higher energy level. Unlike phosphorescent material, the rate of light emission is so rapid as to appear instantaneous. Quantum theory states that the absorption and emission frequencies for a particular material are spectrum specific for that particular molecule (Fig. 1). Light energy is released when an excited fluorescent material spontaneously decays from a higher energy state to a lower level.

Fig. 1. Excitation and emission spectrums of fluorescein in vitro and in vivo. (Adapted from Wessing A, Von Noorden G: Fluorescein Angiography of the Retina: Textbook and Atlas, p 14. St Louis, CV Mosby, 1969.)

Excitation of fluorescein occurs when it is exposed to blue wavelengths between 465 and 490 nm, resulting in emission of yellow-green frequencies (520 to 530 nm).13–17 In the bloodstream, fluorescein is excited by a wavelength of 465 nm and emits a wavelength of 525 nm.17,18 This greater spread between excitation and emission frequencies is clinically helpful in their separation by photographic filters during angiography (Fig. 2; see Fig. 1).17,18

Fig. 2. Intravenous documentation of ocular fluorescence. Light energy necessary for excitation is projected into the globe, using appropriate filters. As excited fluorescein molecules return to their normal state, light energy of a longer wavelength is released. This emitted energy is then documented with the appropriate filters, either visually or photographically.

Sodium fluorescein has several physical and chemical properties that make it an excellent diagnostic tool. It is an inexpensive, water-soluble and relatively inert organic plant resin that exhibits its maximum fluorescence at a near normal blood pH of 7.4.6,13,14,16 Its excitation and emission wavelengths are in the visible spectrum, allowing use of standard photographic equipment and materials. In addition, the molecular size of fluorescein prevents its passage through the tight endothelial junctions of retinal blood vessels and zonula occludens in retinal pigment epithelium while allowing for rapid diffusion in fluid compartments.13,14,16 Conversely, sodium fluorescein's high percentage of binding to albumin and other bloodborne proteins drastically reduces the amount of free fluorescein readily available for excitation.14

ADMINISTRATION

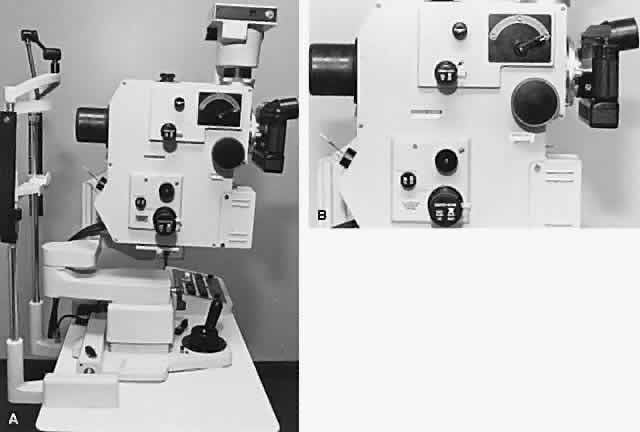
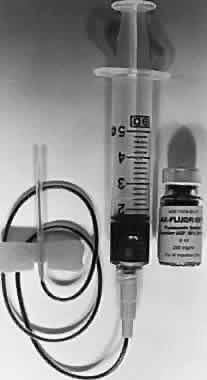
Five milliliters of 10% sodium fluorescein solution is routinely given intravenously at the start of the procedure. A 25% solution is also available and may be better tolerated by the patient. Evaluation of smaller, 2-ml injections of 10% solution by Nasrallah and associates have given equally satisfactory results with fewer side effects.19 A scalp needle attached to a small syringe is ideal for administration (Fig. 3). The angiographic study is initiated with the patient seated comfortably at the fundus camera. The fluorescein dye is injected rapidly into an antecubital vein. Blood should be refluxed into the fluorescein-containing syringe before injection to ensure entry into the vein. Administration is monitored carefully because extravasation of dye results in severe localized pain and even overlying skin necrosis.20,21 Blood precautions should be observed with discarded needles and syringes, and gloves should be worn by those administering dye.

Fig. 3. A 23 gauge scalp needle with 12-inch tubing is ideal for intravenous injection of fluorescein dye.

Within 3 to 5 minutes, the fluorescein is distributed equally throughout the blood. It is rapidly eliminated, predominantly by the kidneys14,16,22; most of it is removed from the bloodstream within 1 hour. Patients should be alerted to expected changes in skin tone and urine color in the post-test period.

Oral administration of fluorescein is also possible in those individuals for whom intravenous injection is difficult or impossible. Oral administration allows assessment of the blood-retinal barrier, but it is inadequate in determining blood flow velocities or anatomic detail.23–25 Ten percent sodium fluorescein is mixed with orange juice to give a 1% to 2% solution; 1 g of dye is given to patients weighing 50 kg or less. More dye, up to a maximum of 2 g, is given to heavier patients.23 Serum concentrations of orally administered fluorescein peak at 30 minutes and remain relatively stable for 1 to 2 hours at levels similar to intravenously administered dye.23 Although the reported incidence of side effects is reduced with this route, allergic reactions still may occur.26

TOXICITY

Although numerous reports of side effects secondary to fluorescein administration are present in the literature, it remains a remarkably safe diagnostic compound. Nausea and emesis are the most commonly reported reactions, occurring with a frequency of 5% or less.27 Syncope, thrombophlebitis, temperature elevation, nerve palsy, and local tissue necrosis are classified as moderate adverse reactions whose incidence is less than 1%.20,26,27 Severe adverse reactions requiring aggressive intervention include laryngeal edema, bronchospasm, anaphylaxis, circulatory shock, and myocardial infarction. A survey by Yannuzzi and associates reported one related death in more than 220,000 angiographic studies of the ocular fundus.27 With patients in whom toxicity is suspected, an intradermal skin test has been recommended.25 An emergency tray and oxygen should be available whenever fluorescein is administered. Prophylaxis for possible adverse reactions is controversial. Although there have been no reports of human fetal complications secondary to fluorescein injection during pregnancy, many physicians avoid administration if possible in pregnant individuals.27,28

ANATOMIC CONSIDERATIONS

Fluorescein angiography of the iris and fundus is possible because of the unique specialization of the eye as an optical instrument. Only in the eye is the vascular system open to close scrutiny through noninvasive means.

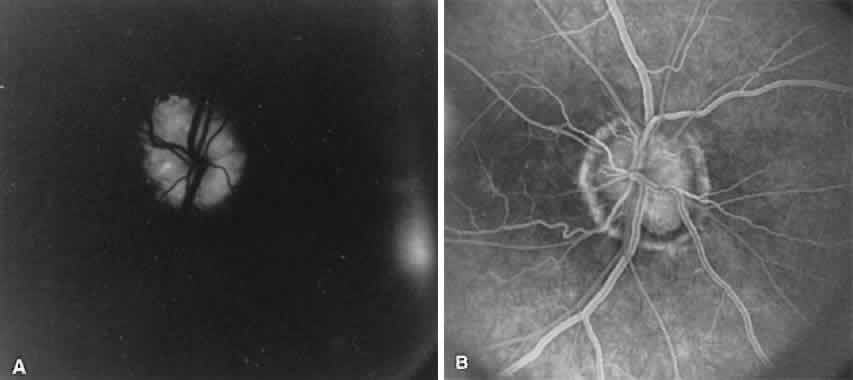
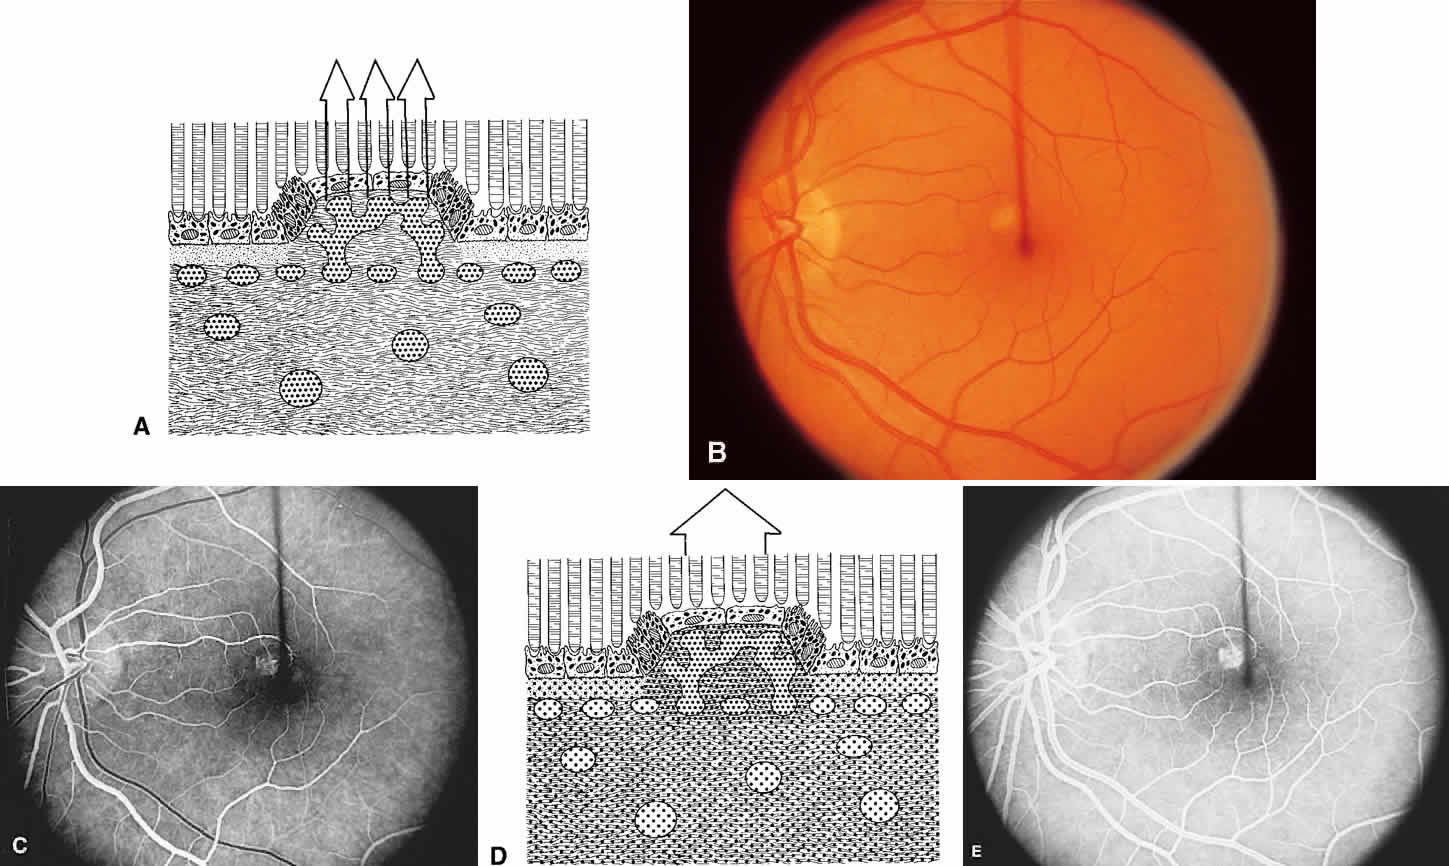
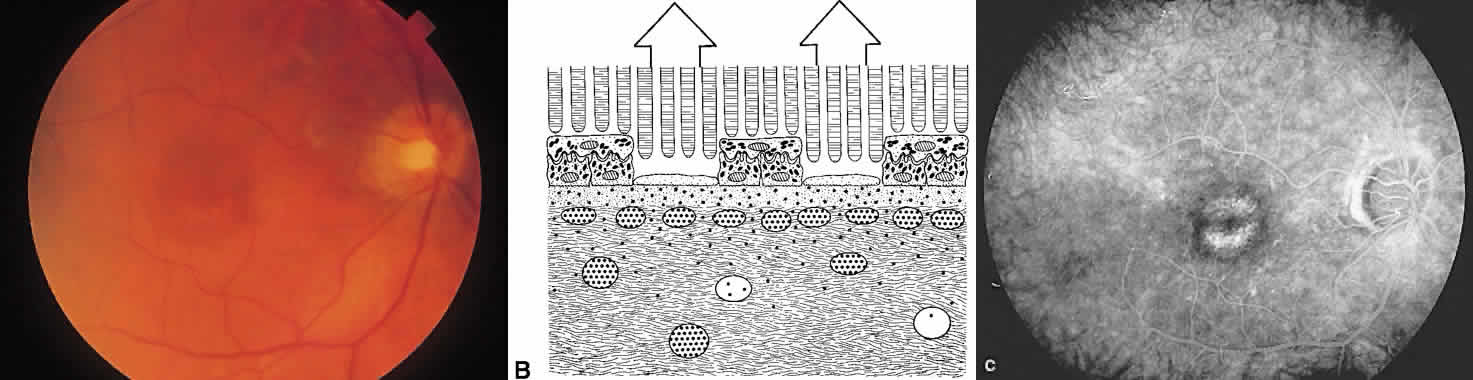
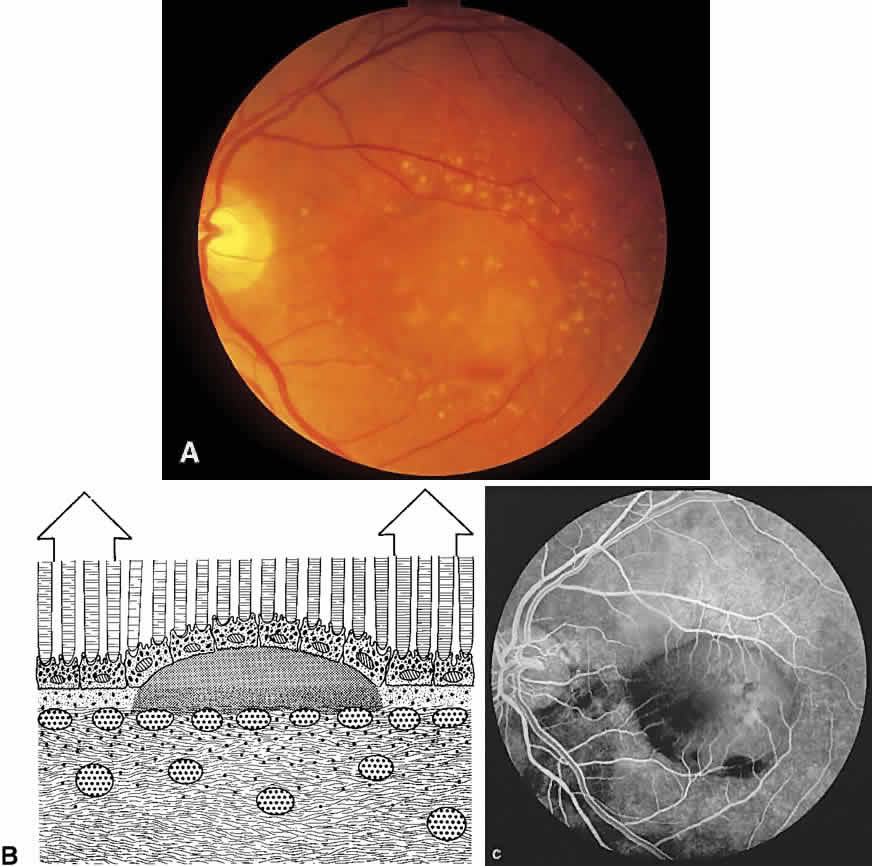
The ocular fundus has two distinctly separate vascular systems—retinal and choroidal—separated by a specialized pigmented monolayer, the retinal pigment epithelium (RPE). Embryologically, the sensory retina and RPE are derived from the inner and outer layers of the optic cup. The choroid and its vasculature lie posterior to the RPE. The fluorescein angiographic patterns of the posterior uvea are, therefore, always partially obscured by the RPE (Fig. 4). The degree of pigmentation and the pathologic changes in this pigmented layer markedly influence the choroidal angiographic appearance. In the interpretation of fundus fluorescein angiograms, the physician must keep in mind and be familiar with the anatomy and interaction of these three layers.

Fig. 4. Anteroposterior relationship of uveal stroma (US) to the pigment epithelium (PE) in anterior portion of the uvea is contrasted to posterior portion of the uvea. Uveal stroma of the iris is anterior to both layers of pigment epithelium, while the situation is reversed posteriorly. In the choroid, the uveal stroma is posterior to the pigment epithelium, and both layers are below the retina (R).

CHOROID

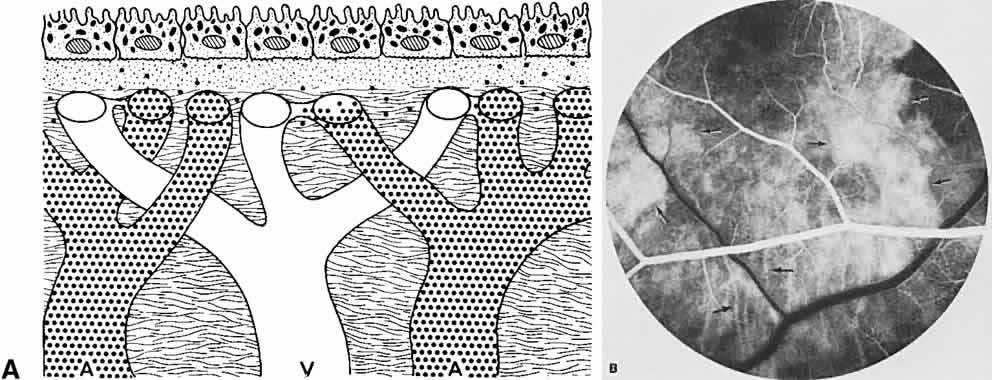
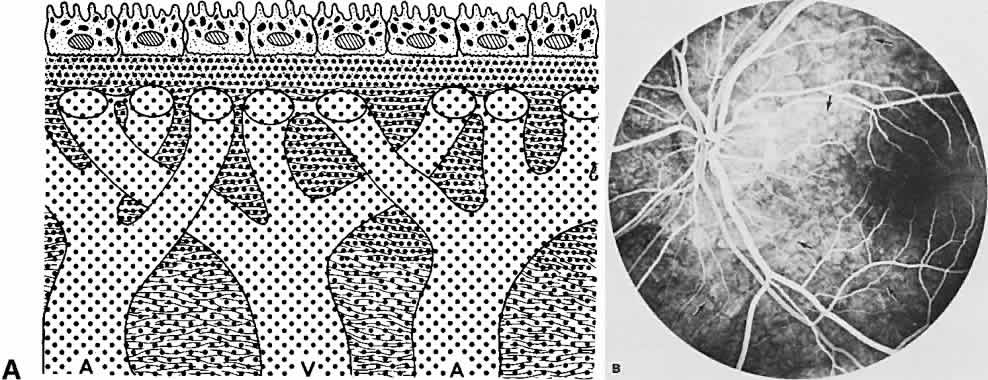
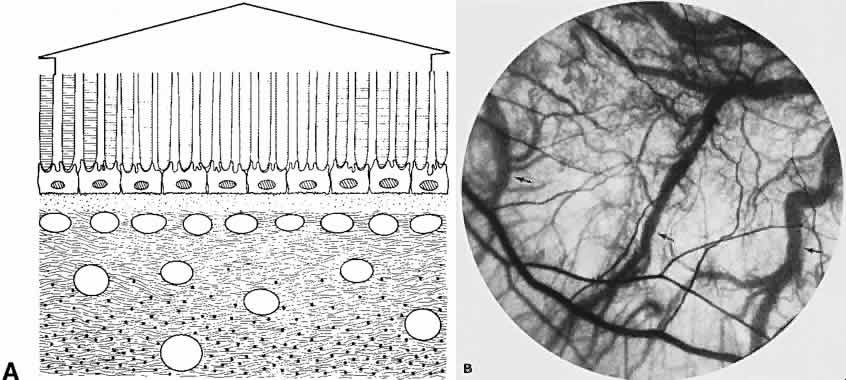
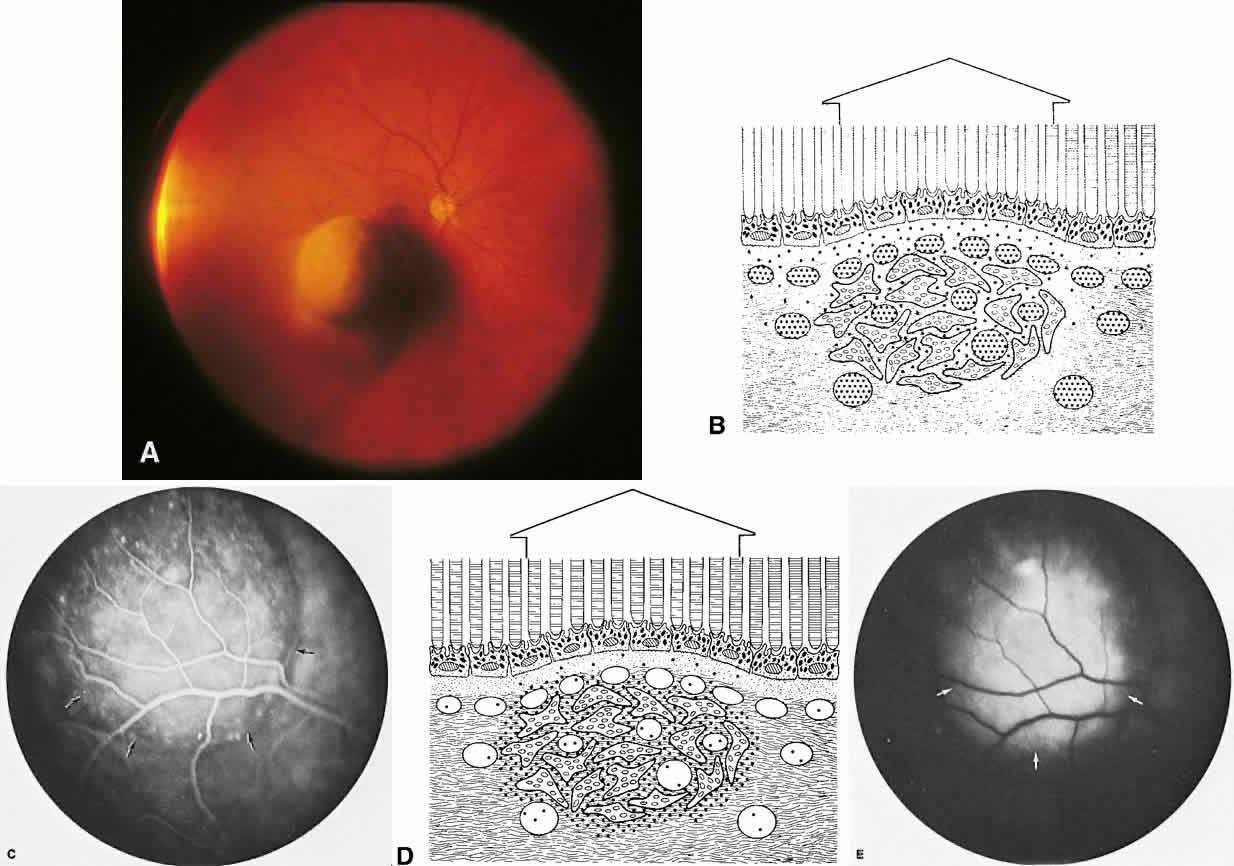
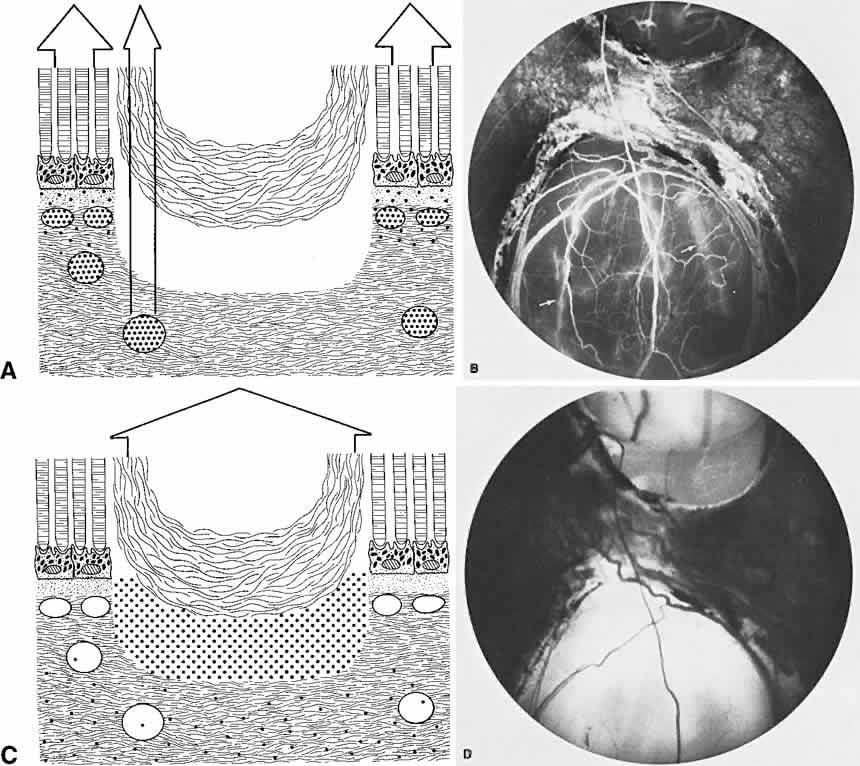
The choroid is a highly vascular connective tissue layer with an average width of 0.25 mm. It is made up of three distinct layers and is perfused by the long posterior, short posterior, and recurrent anterior ciliary arteries. Drainage is primarily through the vortex veins. Its capillary system, the choriocapillaris, is innermost and lies directly beneath Bruch's membrane. The choriocapillaris has a lobular pattern made up of a central arteriole, peripheral draining venules, and an intervening capillary bed. The capillary walls are extremely thin and contain multiple fenestrations, allowing a high degree of fluid transport (Fig. 5). These fenestrations are thought to be actual openings in the endothelial wall through which fluid can undergo passive exchange between the lumen of the vessel and the surrounding extravascular space. As fluorescein enters the choriocapillaris, it quickly passes into the extracellular space. The outer choroidal layers are nonfenestrated and, similar to other typical arteries and veins, do not normally leak fluorescein dye.

Fig. 5. Fine structures of the choriocapillaris (CC), inner choroidal stroma (ICS), Bruch's membrane (BM), and base of the retinal pigment epithelium (RPE). The very thin endothelium of the choriocapillaris has many areas of fenestration (arrows). There is a very thin electrondense line representing the basal lamina closely associated with the outer endothelial side of the capillary (BL). The electrondense material within the capillary lumen is similar to the material within the stroma of the inner choroidal layers and Bruch's membrane (transmission electron microscopy, × 6400).

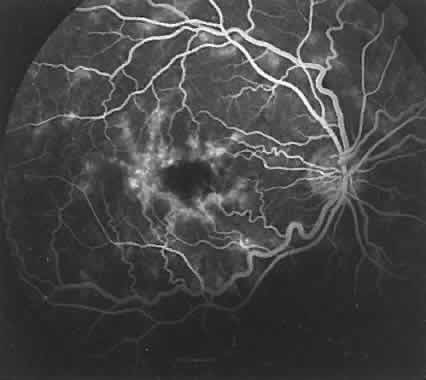
Under normal conditions, the choroid begins to fill with fluorescein a moment prior to the retinal vascular system. This filling is difficult to study by fluorescein angiography because of obscuration by the overlying retina and RPE, its rapid filling, and leakage of fluorescein from the choriocapillaris.6

RETINAL PIGMENT EPITHELIUM

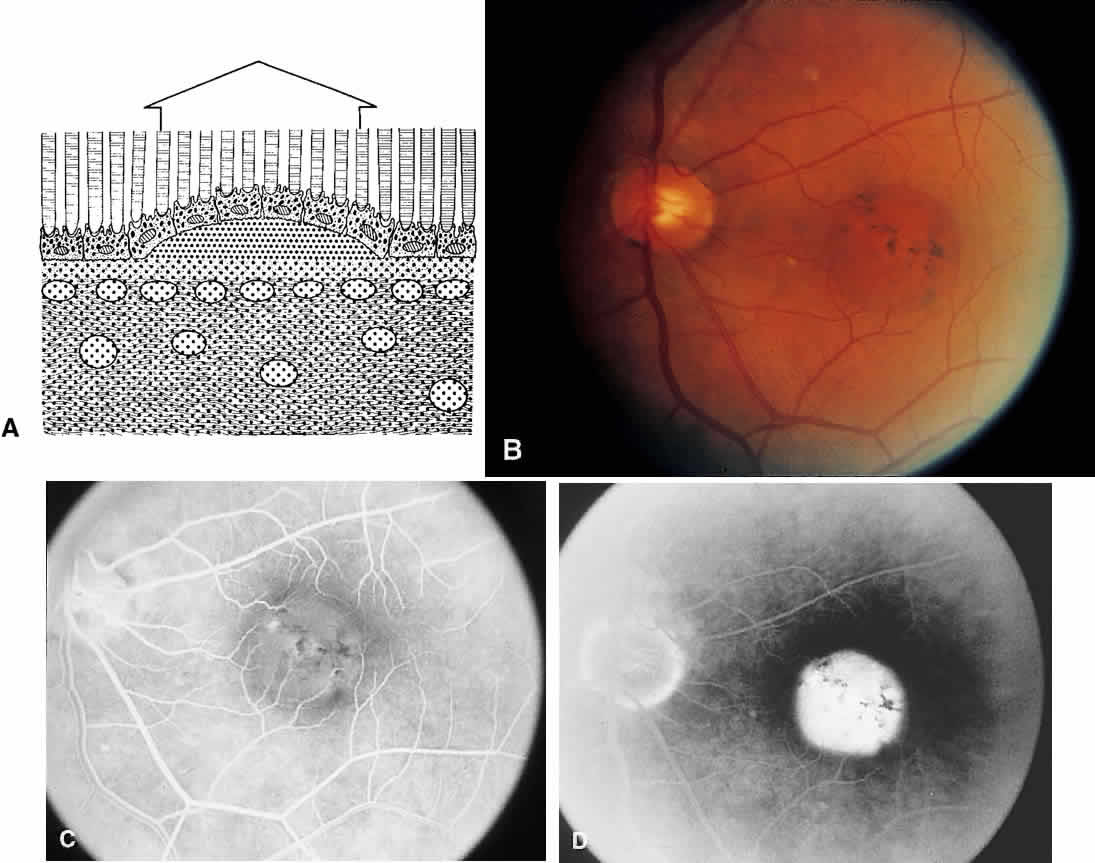
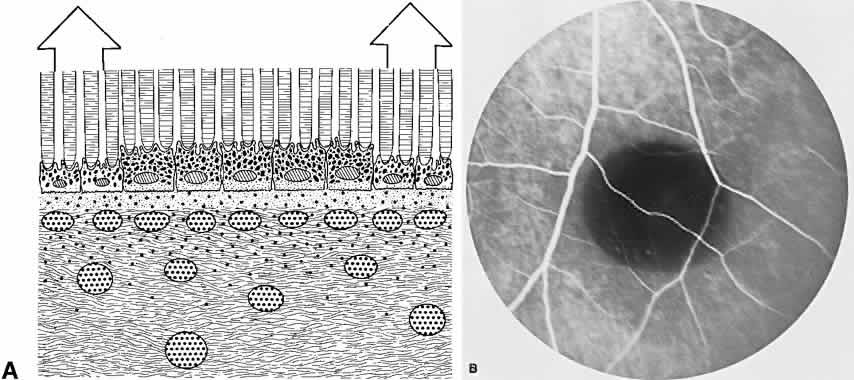
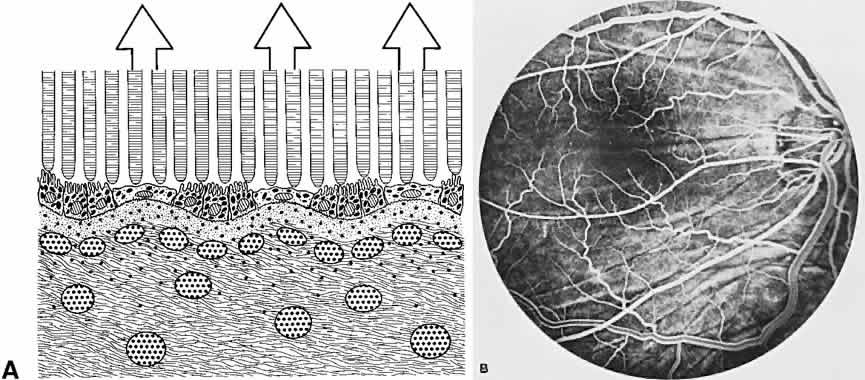
The RPE is a specialized monolayer of pigmented epithelial cells separating the choroid and sensory retina. It functions physiologically as both a metabolic support platform for the overlying photoreceptors and as an effective barrier against passive molecular transport between the choroid and retina.29,30 In its normal state, the RPE prevents leakage or transport of fluorescein into or out of the choroidal space.

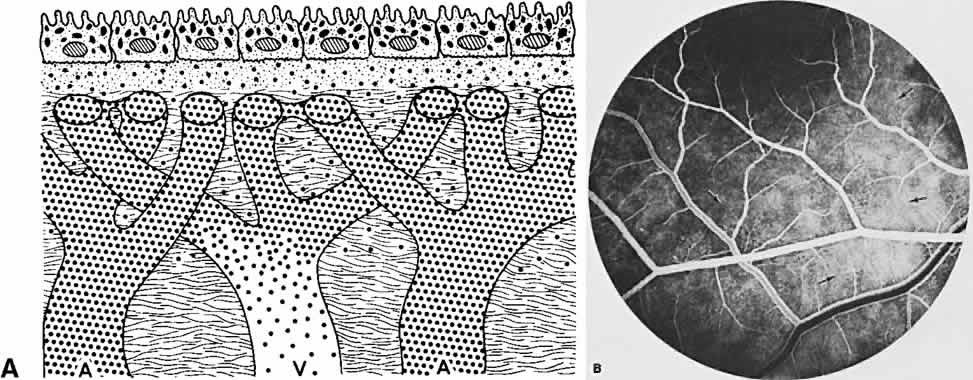
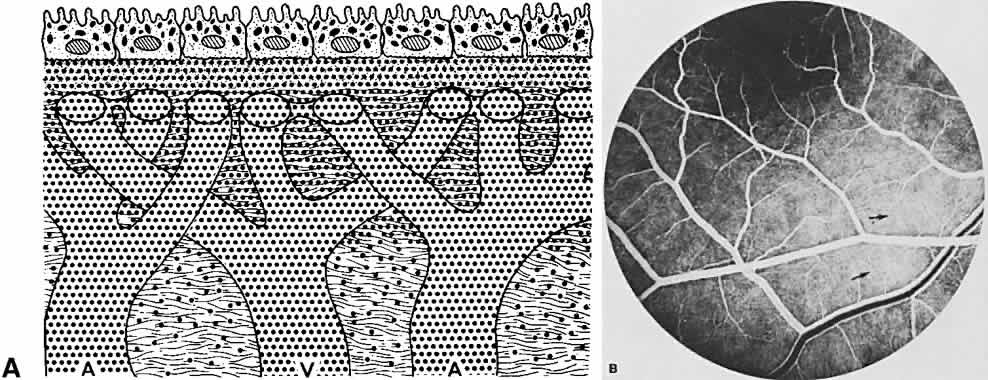
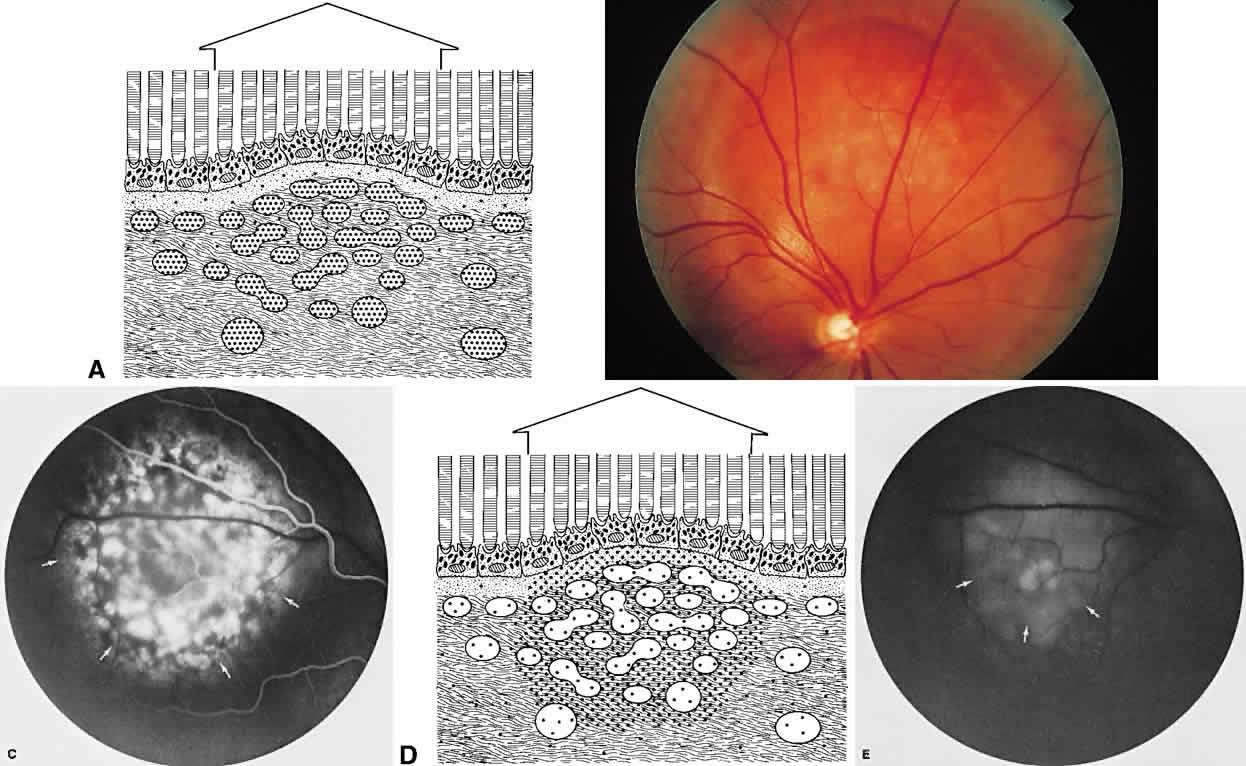
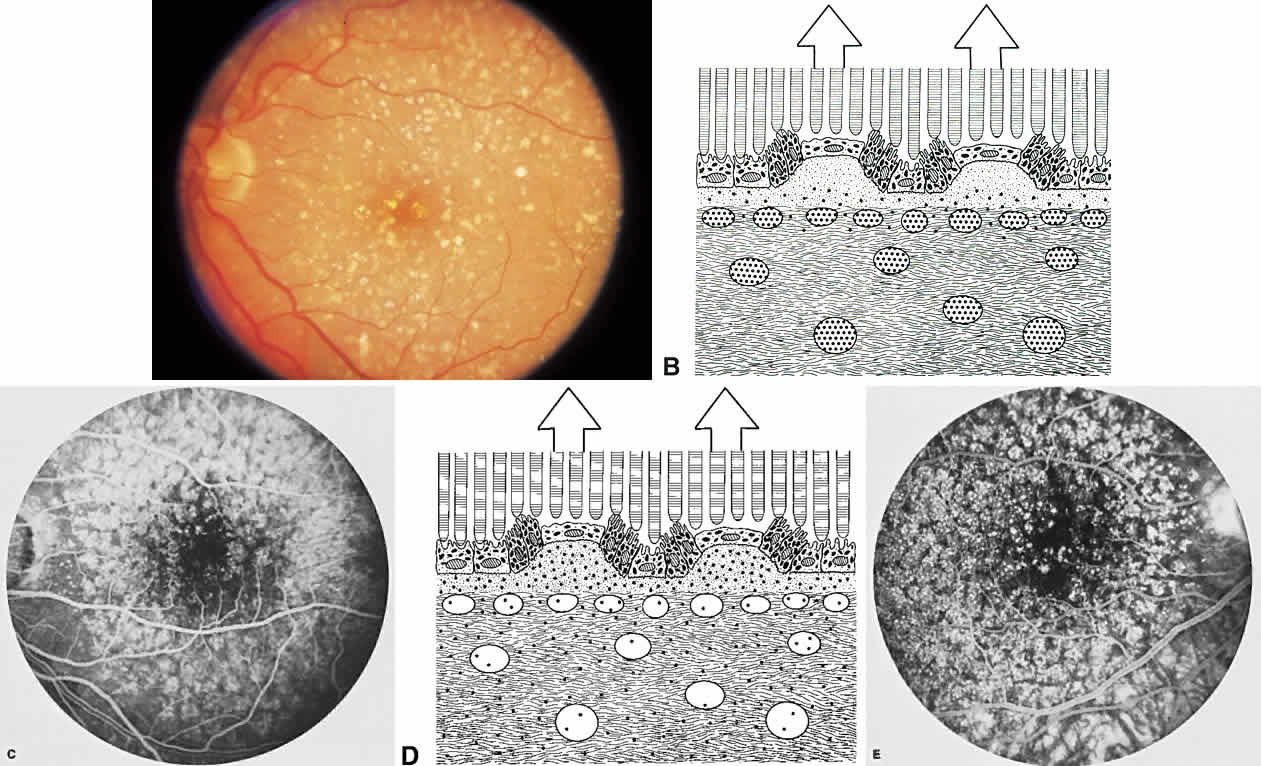
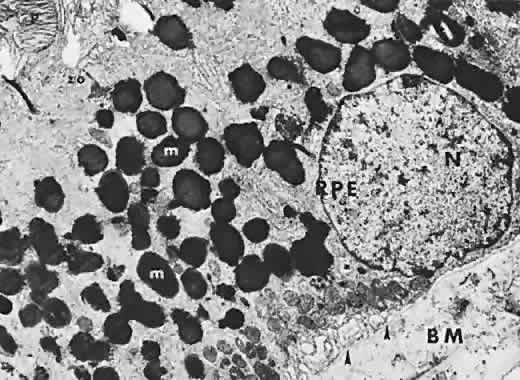
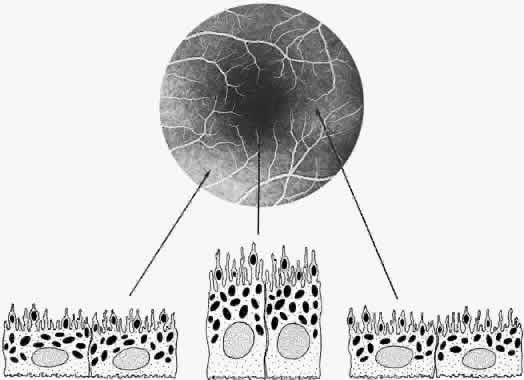
The RPE also functions as an optical barrier because of the presence of pigmented melanosomes (Fig. 6). The density of this pigment varies with retinal location; it is greatest in the foveomacular region and least anterior to the equator. There are more pigmented epithelial cells per unit area in the foveomacular region than in the periphery. Posteriorly, the cells are tall and columnar, with several layers of melanosomes crowded together. Anteriorly, the cells gradually become flatter and more cuboidal, with a corresponding loss of relative pigment concentration (Fig. 7). In any normal eye, regardless of the comparative fundus color, the greater pigmentation in the foveomacular area gives this zone a darker clinical appearance when compared with the remainder of the posterior pole and periphery.

Fig. 6. Fine structure of retinal pigment epithelium (RPE), showing heavy concentration of pigment granules, melanosomes (m), nucleus (N), intricate basal infoldings (arrows), and zonula occludens (zo). Tip of a photoreceptor cell (P) can be seen at apical side of RPE; Bruch's membrane (BM) can be seen on basal side of RPE (transmission electron microscopy, × 11,200).

Fig. 7. Relative difference in morphology of RPE. Assuming that each RPE cell has approximately the same number of melanosomes, then the pigment density is a function of height and width of the cells. The RPE in the foveomacular area are tall and columnar shaped in contrast to the more cuboidal RPE cells in the surrounding posterior pole. The greater density of pigment in the columnar cells helps to explain the foveomacular dark spot seen in this normal fluorescein angiograph.

RETINA

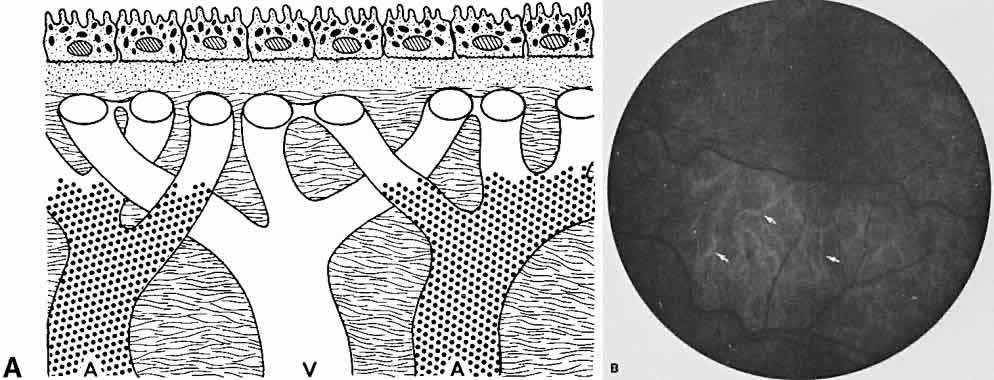
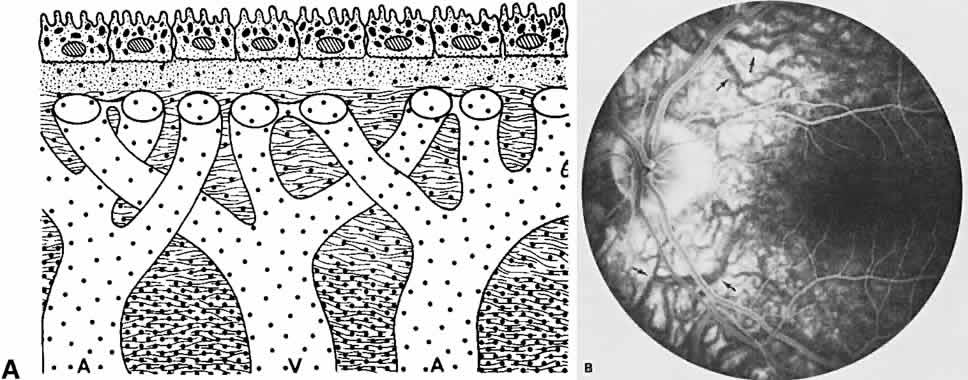
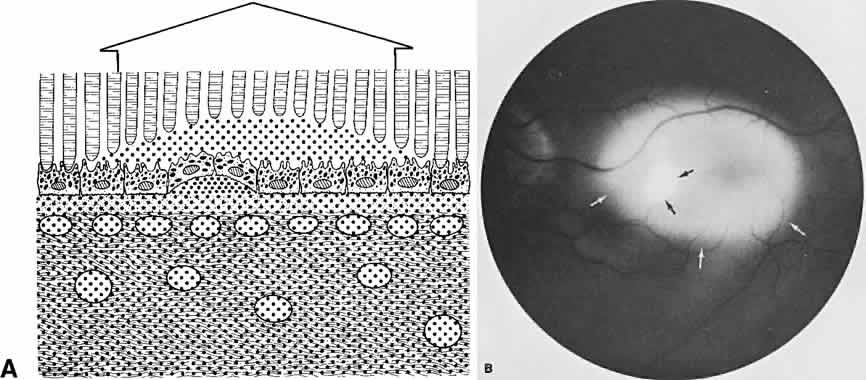
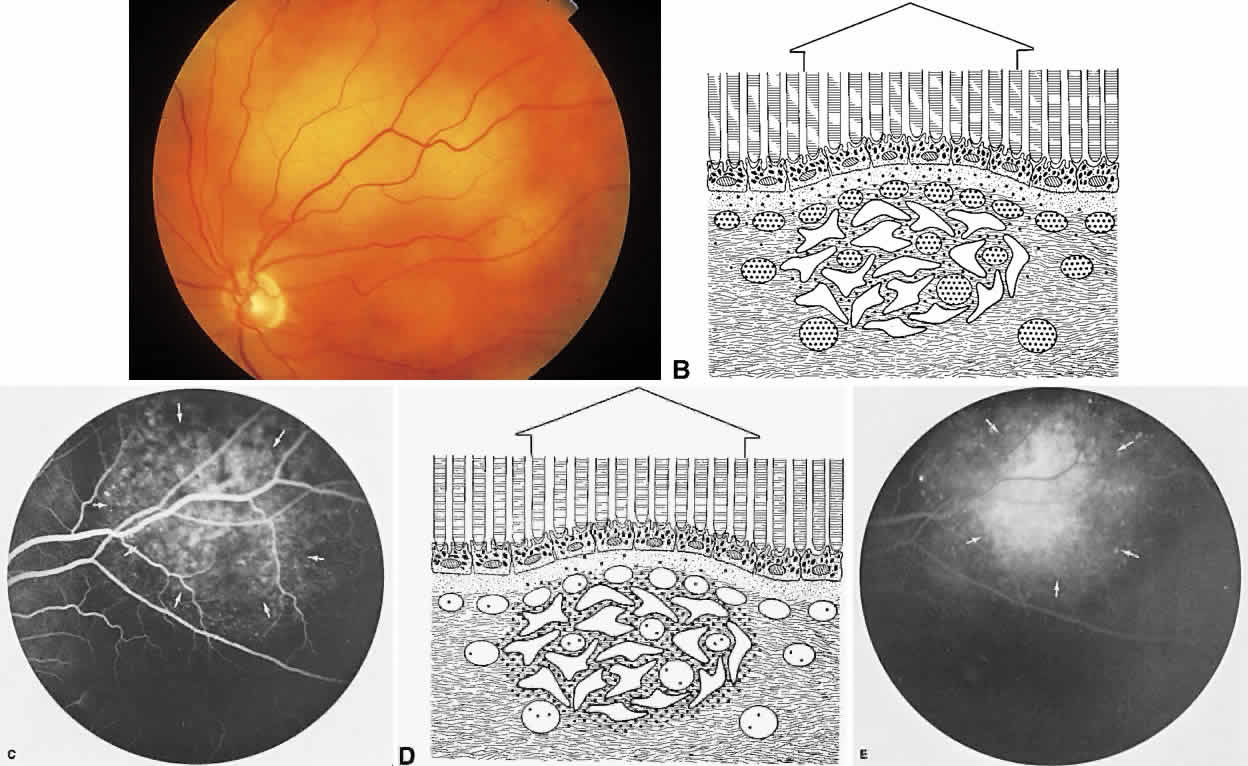
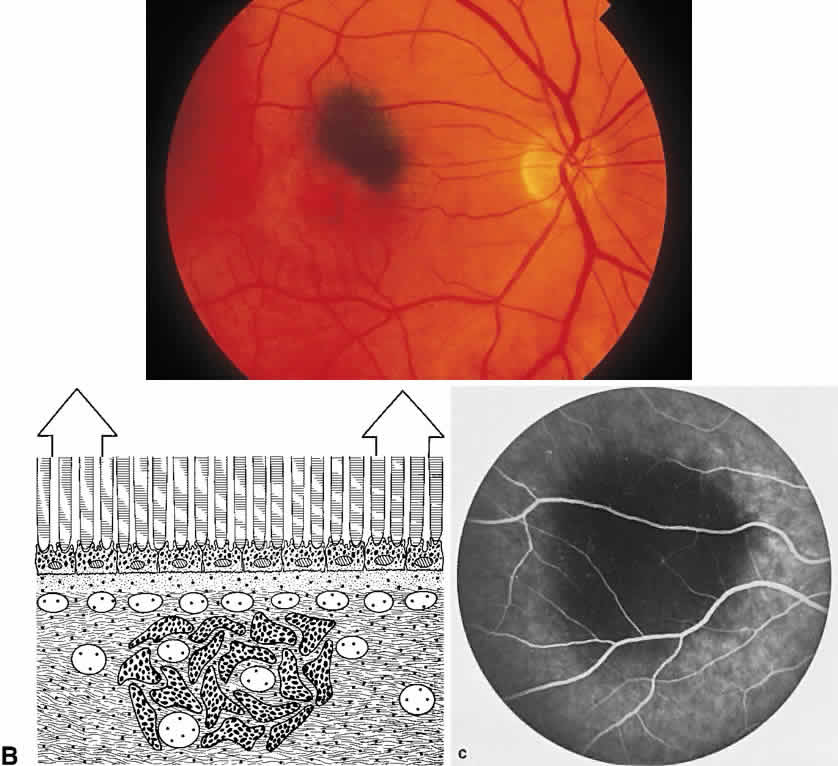
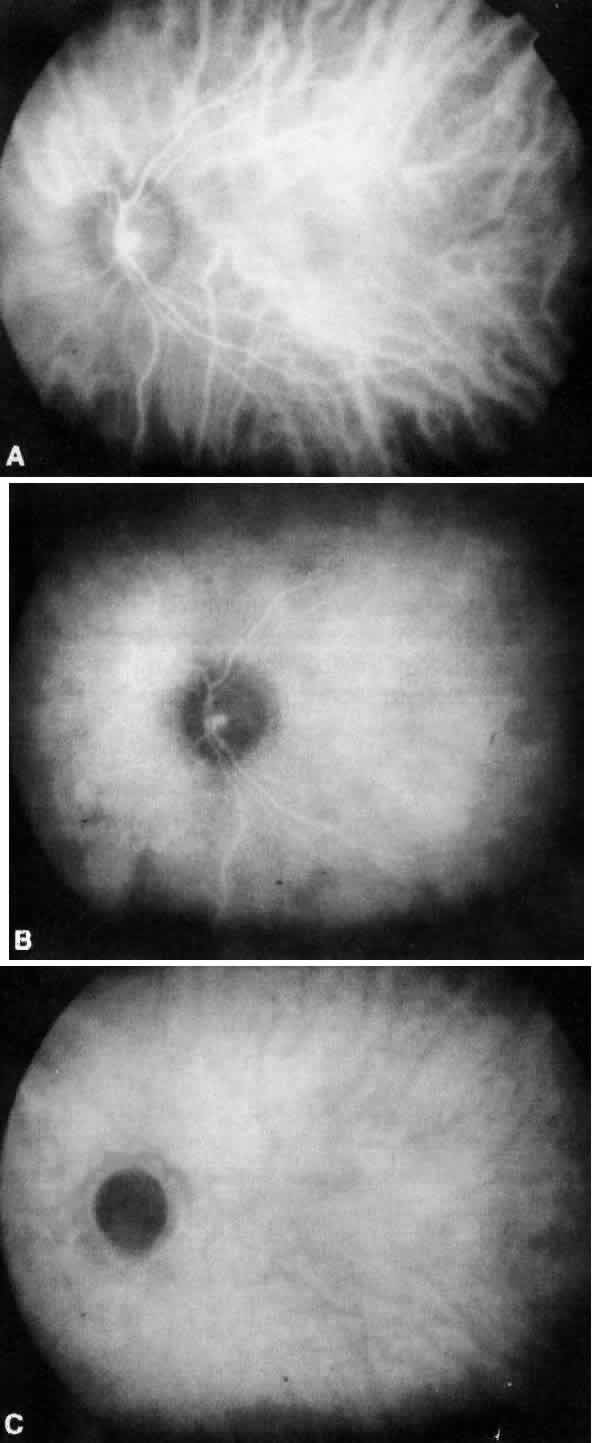
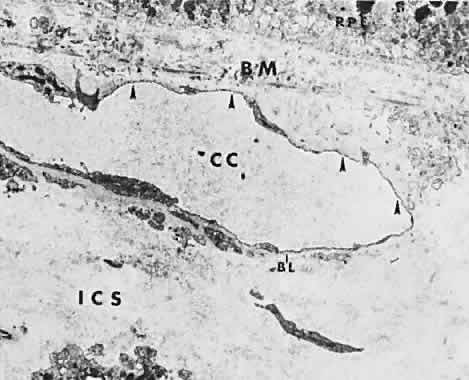
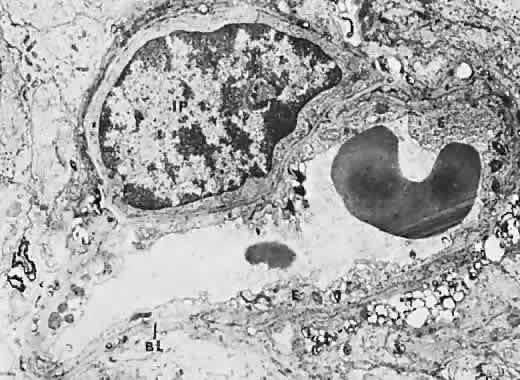
The retina, except for its vasculature, may be regarded as a transparent tissue comprised of tightly packed layers of cells with essentially no extracellular space. The retina is perfused by the central retinal artery and cilioretinal vessels present in 32% of eyes.31 The capillary bed is nonfenestrated and fluorescein does not, therefore, leak from the retinal vessels into the surrounding tissue (Fig. 8). Functionally, the retinal vasculature represents a “closed” system, as opposed to the choroid, in which fluorescein is free to move between the intravascular and extravascular compartments. The retinal circulation normally fills with fluorescein after the choroidal flush; however, a cilioretinal artery fills at the same time as the choroid, preceding the rest of the retinal circulation.

Fig. 8. Fine structure of intraretinal capillary, showing capillary endothelium (E) and intramural pericyte (IP), both encased within a basal lamina (BL). In these capillaries there are no endothelial specializations such as the fenestrations seen in the choriocapillaris (transmission electron microscopy, × 11,200).

The retina also serves as an optical filter because of its high content of xanthophyll pigment, especially in the macular region. This yellow pigment has its highest concentration in the outer nuclear and plexiform layers, and may selectively absorb blue excitation frequencies.16

IRIS

The iris stroma, like the choroid, is composed of vascular connective tissue. Although electron microscopy and tracer studies have demonstrated the absence of fenestrations in both animal and human eyes,32–34 other reports have supported the presence of gaps in the junctions between endothelial cells in some animal iris tissue.34–36

Back to Top
PHOTOGRAPHIC EQUIPMENT
The permanent recording of a fluorescein angiogram is made possible by special video systems and motorized fundus cameras capable of rapid sequential photography with intervals of less than 1 second. An excitation filter functions to create a narrow band of blue wavelengths, which in turn illuminates the target tissue (Fig. 9). The excited fluorescein within the vessels and extracellular spaces then emits yellow-green fluorescent light, which is recorded on the photographic film. Because various normal and abnormal structures within the eye are capable of reflecting incoming light, a barrier or interference filter that transmits only yellow-green fluorescent wavelengths—indicating the true position of fluorescein dye—is required (see Fig. 2). Because the excitation and emission spectra of fluorescein are relatively close in position and may even overlap, causing pseudofluorescence, transmission curves of the filters should be chosen carefully to ensure minimal overlap. Although present day filters are well matched, pseudofluorescence may still occur, leading to erroneous interpretation.

Fig. 9. Fundus camera and filters. A. Motorized fundus cameras allow rapid sequence photography of fluorescein dye passage through the retinal and choroidal circulations. B. Close-up of camera side panel shows position of barrier and exciter filters (arrows).

Similarly, portions of the eye may be capable of fluorescence in the absence of dye when illuminated with blue light. This phenomenon is known as autofluorescence.14,16,37 Optic nerve head drusen, Best's vitelliform lesions, lipofuscin over choroidal melanomas, and flecks associated with fundus flavimaculatus are abnormal conditions that may autofluoresce (Fig. 10).38 Normal autofluorescent ocular structures include sclera, retina, lens, and Descemet's membrane.14 Larsen and associates has used the autofluorescent properties of the lens as an accurate indicator of metabolic control in diabetics.39

Fig. 10. Autofluorescence of optic nerve head drusen. A. Preinjection photograph of the optic nerve in a patient with optic nerve head drusen. Both barrier and exciter filters are in place. B. Same patient after filling of retinal vessels.

Back to Top
INTERPRETATION
Fluorescein angiography should be viewed as an adjunct to diagnosis; it should never supplant but simply aid the clinical examination. A possible exception may be in an individual with dense asteroid hyalosis that obscures the posterior pole. In this condition, white light from an ophthalmic instrument is reflected from the asteroid bodies. During angiography, however, reflected blue light is absorbed by the barrier filter and only yellow-green fluorescent light from dye containing structures is recorded on the film.40 In this situation, the angiographic detail is superior to the clinical examination.

Interpretation of negatives or contact sheets should be undertaken in a sequential manner. Stereo viewing aids in localizing the anatomic depth of disease processes. The normal fluorescein study can be divided into four separate divisions: the prefilling, transit, recirculation, and late phases. The prefilling phase includes those frames taken before fluorescein dye enters the globe. It is useful in determining the presence of autofluorescence or pseudofluorescence, thus preventing incorrect interpretation. The transit phase represents the first complete passage of fluorescein-containing blood through the choroidal and retinal circulations. It occurs normally within the first 30 seconds of the study. It is subdivided into arterial and venous filling phases. The recirculation phase occurs as fluorescein becomes equally distributed throughout the blood and re-enters the eye. This phase is complete approximately 3 minutes after injection. Early leakage or staining with fluorescein usually occurs within the recirculation phase. The late phase, or elimination phase, is the result of removal of fluorescein from the circulation. For clinical purposes, this is observed by 30 minutes after injection; during this time, any late staining and residual hyperfluorescence is seen.

The normal sequential movement of fluorescein through these phases produces the total angiographic pattern. However, at any given moment, the fundus fluorescein pattern depends not only on the phase but also on the additive features and changes of the fluorescein dye as it travels superimposed in three distinct tissue layers (i.e., the retina, choroid, and RPE).

NORMAL ANGIOGRAPHIC PATTERN

Fluorescein enters the choroidal vascular system via the posterior ciliary arteries. In a very lightly pigmented fundus, these larger choroidal vessels can be seen to fill with fluorescein (Fig. 11). The flow is directed toward the choriocapillaris, the filling of which is called the background choroidal flush (Fig. 12A and B). Normally, this stage begins before the arterial phase of the retinal circulation. If a cilioretinal artery is present, it will fill at the same time (see Fig. 12C). The arm-to-retina circulation time varies, averaging 10 to 20 seconds. The filling of the choriocapillaris occurs in irregular patches, best seen in the posterior pole (see Fig. 12B).41,42

Fig. 11. Early filling of large and medium-sized choroidal arterioles. A. Filling of large and medium-sized choroidal arterioles with fluorescein (black dots). Fluorescein has not reached the level of the choriocapillaris at this stage. B. Filling of large and medium-sized choroidal arterioles (arrows) in earliest stage of fluorescein study.

Fig. 12. Early filling of choriocapillaris. A. Fluorescein (black dots) filling of choriocapillaris in a patchy manner from efferent side of the circulation. A few molecules of fluorescein are seen leaking into the extravascular tissue in the area of Bruch's membrane. B. Early, patchy filling of choriocapillaris (black arrows). Medium-sized and smaller arterioles are also seen leading to patches of choriocapillaris filled with fluorescein (white-edged arrows). C. Filling of cilioretinal artery at the same time as the choriocapillaris begins to fill with fluorescein.

Each patch appears to fill evenly and is the result of separate, irregular areas of choriocapillaris supplied by larger choroidal vessels at slightly different times. The background choroidal flush gradually intensifies and spreads anteriorly toward the ora serrata. The entire choroidal sequence is obscured in the foveomacular area because of the denser pigmentation in the overlying RPE, and possibly the increased amount of xanthophyll in the sensory retina (see Fig. 7).16 To observe the larger choroidal vessels fill with fluorescein, attention must be focused deep to the RPE very early in the study, before the choroidal flush quickly masks these feeding vessels (see Figs. 7, 11B, 12B, 13B, and 14B). As the fluorescein enters the intravascular system of the choroid, it immediately leaks into the extravascular space (see Fig. 12A). This leakage is related to the capillary fenestrations seen in the choriocapillaris. Leakage of fluorescein in the choroid is most intense directly below Bruch's membrane and in the inner choroidal layers (see Fig. 13A). Diffusion then occurs throughout the entire extravascular space to eventually involve the inner scleral fibers (see Fig. 14A). The concentration of fluorescein rapidly equilibrates throughout the inner choroidal layers in both the intravascular and extravascular compartments. The concentration in the extravascular stroma of the outer choroid is probably less. This occurs during the filling phases of the study, usually by the venous phase of the retinal circulation (see Fig. 14). As the study progresses, fluorescein continues to leak from the choroidal vessels. Concurrently, (the density of fluorescein within the vessels becomes less because of the extravascular leakage and dilution by equal distribution throughout the entire blood volume. Therefore, the concentration of fluorescein within the choroidal vessels rapidly becomes less than that in the extravascular choroidal tissue. This occurs in the inner choroidal layers first and can be recognized as the medium-sized choroidal vessels begin to appear as silhouettes against the more concentrated extravascular fluorescence (Fig. 15).

Fig. 13. Complete filling of the choriocapillaris. A. More concentrated filling of the choriocapillaris. All the capillaries are filled with fluorescein (black dots), and dye is starting to leak into the extravascular choroidal stroma. Extravascular fluorescein is seen in Bruch's membrane and the inner choroidal layers. B. More diffuse filling of the choriocapillaris (same patient as in Fig. 12B, 1 second later in the study). Earlier patchy distribution has been obscured by the more diffuse filling of the choriocapillaris (arrows). Leakage from the capillaries into the extravascular component of the inner choroid and Bruch's membrane contributes to the more diffuse fluorescence.

Fig. 14. Complete filling of intravascular and extravascular components of inner choroidal layers. A. Dense concentration of fluorescein (black dots) within the vessels of the choroid, with equal concentration of fluorescein in the extravascular space of the inner choroidal layers. Extravascular concentration of fluorescein in the outer choroidal layers is less. Denser concentration evenly distributed throughout the inner choroidal layers in both the intravascular and extravascular space now obscures completely any choroidal detail. B. Complete filling of inner choroidal layers, both the intravascular and the extravascular components (same patient as in Fig. 13B, 1 second later in the study). All choroidal detail is completely obscured by this stage (arrows).

Fig. 15. Visualization of medium-sized choroidal vessels. A. Concentration of fluorescein (black dots) is greater in the extravascular components of the inner choroidal layers than in the intravascular space within this same area. The fluorescein concentration is the same in the outer choroidal extravascular space as it is within the entire choroidal intravascular space. As the fluorescein begins to recirculate through the entire blood volume, the concentration within the extravascular space of the choroid becomes greater than the concentration within the choroidal vessels. Because the concentration of dye is greater in the inner choroidal layers, the medium-sized vessels within the inner and middle choroidal layers can be visualized in the early phases of the study. B. Medium-sized choroidal vessels (arrows) standing out in dark relief against the more concentrated dye within the extravascular space of the inner choroidal layers (approximately 74 seconds after injection).

Fluorescein is removed from the choroid in the reverse manner. As vascular fluorescence becomes less because of recirculation of dye and removal by the kidneys, the extravascular fluorescein passes back into the vessels and is eliminated. Once the choroidal fluorescence has become more concentrated in the extravascular compartment, the relative contrast to vascular fluorescence remains throughout the entire study.

Fluorescein most likely leaves the extravascular tissue in the area of the choriocapillaris first and the outer choroid and inner scleral layers last. This dilution causes the extravascular fluorescein of the inner choroidal layers to become less concentrated than the outer extravascular choroidal fluorescein (Fig. 16). This is seen when the large choroidal vessels stand out in dark relief against the more concentrated extravascular fluorescence of the outer choroidal layers (see Fig. 16B). Even in the late phase, when fluorescein is no longer seen in the vasculature, patterns of choroidal fluorescence arising from extravascular fluorescein can be seen. This very late extravascular fluorescence arises from the outer choroidal and inner scleral layers (Fig. 17).

Fig. 16. Visualization of large choroidal vessels. A. Greater concentration of fluorescein (black dots) in the outer choroidal extravascular space than within the entire intravascular component of the choroid. The concentration within the extravascular inner choroidal layers is the same as the intravascular component of the choroid. As the recirculation phase progresses, the concentration of fluorescein within the inner choroidal layers become equal to the concentration in the outer choroidal layers. In the later phases and elimination phases of the study, the concentration becomes greater in the outer choroidal extravascular space than in the inner choroidal extravascular space; thus, the concentration of dye becomes greater surrounding the larger vessels in the outer choroidal layers. B. Large vessels (arrows) in outer choroidal layers standing out in dark relief against more concentrated extravascular fluorescein (approximately 450 seconds after injection).

Fig. 17. Hyperfluorescence in patient with albinism. A. Dye in late elimination stage in outer choroidal extravascular space. Fluorescein (black dots) from outer choroidal layers is easily transmitted through pigmented epithelial layers because there are no pigment granules (or the granules are abnormal, not fully mature) in the RPE. B. Late elimination phase in patient with albinism, showing the choroidal vasculature not filled with fluorescein standing out in dark relief against extravascular fluorescence (arrows) from outer choroidal layers.

The RPE, with its tight junctions, acts as a barrier to the leakage of fluorescein from the choroid into the overlying outer retinal layers. Within 1 second of the choroidal flush, fluorescein dye is seen within the arterioles. In a healthy patient, with proper administration of fluorescein, this occurs rapidly, filling the arterioles completely. As bloodborne dye crosses the capillary network and enters the venous system, a columnar appearance to the veins initially is observed—the laminar venous phase. It occurs secondary to margination of fluorescein because of more rapid flow of blood in the vein's central lumen.16 As more fluorescein enters the veins, they (fill totally—full venous phase. Arteriovenous transit is dependent on the distance fluorescein dye must flow and is therefore delayed in the fundus periphery and more rapid within the macula.

Back to Top
ABNORMAL ANGIOGRAPHIC PATTERNS
The abnormal fluorescein pattern is secondary to a disruption of the normal anatomic relationships of the ocular layers under study. The terms hyperfluorescence and hypofluorescence, relative to the normal pattern and intensity of the fluorescence, describe any pathologic pattern. Hyperfluorescence may result from (1) the abnormal presence of fluorescein in a location, (2) a greater-than-normal concentration of dye in any location where fluorescein is usually seen, or (3) an increased transmission of fluorescence from an area of normal dye concentration and distribution due to an overlying pathologic condition. Hypofluorescence occurs because of (1) the complete absence of fluorescein in an area where dye is normally found, (2) a relative decrease from the normal concentration of fluorescein in any particular area, or (3) a blockage of transmission of the normal fluorescence secondary to an overlying pathologic condition.

HYPERFLUORESCENCE

Hyperfluorescence due to accumulation of fluorescein in an area where it is not normally seen is well portrayed in a focal detachment of the RPE (Fig. 18), in which the dye accumulates between the RPE and Bruch's membrane (see Fig. 18A). The RPE appears to be firmly attached to Bruch's membrane, and when fluid accumulates in this area, the RPE delineates itself with sharp, abrupt borders (see Fig. 18B-D).

Fig. 18. Serous retinal pigment epithelial detachment (RPED). A. Accumulation of fluorescein (black dots) in localized serous RPED. B. Kodachrome of retinal pigment epithelial detachment with overlying pigmentary changes. C. Early hyperfluorescence within RPED during laminar venous phase. D. Intense hyperfluorescence from pooling of fluorescein dye in late phase.

Central serous chorioretinopathy causes an area of hyperfluorescence because of the presence of the dye between the retinal photoreceptor cells and the RPE (Fig. 19). This may be related to a detachment of the RPE and is associated in some way to a defect in the normal mechanism of fluid exchange across the RPE between the choroid and the sensory retina. The attachment of the photoreceptors to the RPE may not be as strong as the attachment of the RPE to Bruch's membrane. This may be why the borders of fluorescence in the secondary serous retinal detachments found in central serous chorioretinopathy are more diffuse (see Fig. 19B) than those in a detachment of the RPE (see Fig. 18B).

Fig. 19. Hyperfluorescence in patient with central serous chorioretinopathy. A. Accumulation of fluorescein (black dots) between the neurosensory retina and the retinal pigment epithelium (RPE). There is also a small focal detachment of the RPE that is filled with fluorescein. B. Area of hyperfluorescence corresponding to serous detachment of neurosensory retina that has filled with fluorescein (white arrows). Within this area is a smaller, more hyperfluorescent site (black arrows), resulting from small focal detachment of the RPE.

Ocular histoplasmosis may also show choroidal hyperfluorescence because of the abnormal presence of a choroidal neovascular membrane forming a nodular elevation of the RPE (Fig. 20A and B). In the early stage of this disorder, when a neovascular tuft is clearly seen, the very early phases of the fluorescein study clearly show the new vessels filling with fluorescein. In the later phases, dye leaks from the vessels to fill the surrounding tissue and may even cause staining of the RPE (see Fig. 20C-E). Hyperfluorescence is also caused by an increased concentration of fluorescein in an area of the uveal tract, where it is normally seen in the intravascular and extravascular components of the choroidal stroma. A choroidal hemangioma shows hyperfluorescence very early in the study (Fig. 21A and C). This vascular tumor and the choroidal vasculature fill with dye at the same time. For this reason, these lesions often reach a peak of hyperfluorescence in the early phases of the fluorescein study. Even though there is leakage and staining of the extravascular components, because these are highly vascular tumors, the peak of the hyperfluorescence may diminish before the late phases of the study (see Fig. 21D and E).

Fig. 20. Choroidal neovascular membrane formation in a patient with ocular histoplasmosis. A. Early filling of neovascular tuft with fluorescein (black dots) within nodular elevation of the retinal pigment epithelium (RPE). B. Kodachrome of “histo-spot” with secondary choroidal neovascularization. C. Early filling of neovascular tuft with fluorescein within the nodular elevation of the RPE. D. Later phase of the study with leakage of fluorescein (black dots) from the intravascular component of the nodular elevation of the RPE into the extravascular component of the nodule. Fluorescein is now heavily concentrated, filling the entire nodule. E. Nodular elevation of the RPE completely filled with fluorescein.

Fig. 21. Hyperfluorescence in a choroidal cavernous hemangioma. A. Fluorescein (black dots) filling the intravascular component of a choroidal hemangioma directly from the choroidal vasculature in early stages of the angiogram. There is a greater concentration of fluorescein within the area of the choroidal lesion. B. Kodachrome of choroidal hemangioma. Note the prominent orange color. C. Very early hyperfluorescence (arrows) of cavernous hemangioma of the choroid before fluorescein completely fills the retinal vasculature. At this early stage, hyperfluorescence is caused by fluorescein concentrating in mainly the intravascular components of the tumor. Later stage of the study with a greater concentration of fluorescein (black dots) within the extravascular components of the hemangioma than within the vessels themselves. D. Late stage of the fluorescein study, reveals hyperfluorescence (arrows) from the fluorescein accumulating in the extravascular components of this tumor. (Courtesy of William Tasman, MD, Wills Eye Hospital, Philadelphia, PA.)

Hyperfluorescence from a solid tumor (e.g., a choroidal melanoma or metastatic lesion; Figs. 22 and 23) also is caused by an increased accumulation of fluorescein in the uveal stroma at the tumor site. These masses are usually associated with increased vascularity and therefore increased fluorescence. Fluorescein leaks rapidly into the extravascular space to fill the stroma of these tumors (see Figs. 22A and 23A). Because these are solid tumors of densely packed cells, it probably takes time for the fluorescein to completely penetrate the extravascular space of the tumor. Lesions of this nature may show a delay in the hyperfluorescent peaks as compared with choroidal hemangiomas, and for the same reason may fluoresce longer.

Fig. 22. Hyperfluorescence in patient with choroidal melanoma. A. Equator plus kodachrome of choroidal melanoma. B. Mass of tumor cells with a greater amount of vessels within the tumor area than in the surrounding area of the choroid. In this early stage, fluorescein molecules (black dots) accumulate within the vessels of the tumor, with some leakage into the extravascular space. However, the concentration of fluorescein at this early stage is not much greater than it is in the surrounding choroidal intravascular and extravascular space, except within the intravascular components of the tumor. Fluorescence from the tumor mass is also seen because of transmission secondary to the abnormal melanosomes (clear circles within tumor cells) and most probably secondary degenerative retinal pigment epithelium (RPE) changes (not shown). C. Early filling of choroidal melanoma. In early phases of study, fluorescence (arrows) that comes from the melanoma is caused by filling of intravascular component of this tumor. As the study progresses, hyperfluorescence from the tumor will continue to increase because more fluorescein is accumulating in the extravascular space. There is transmission of dye because of the abnormal pigment granules and RPE changes. D. Greater concentration of fluorescein (black dots) in extravascular stroma between the tumor cells than in the surrounding choroidal tissue. It is not known whether the fluorescein is actually taken up by the melanoma cells or it just surrounds the cells. This is very late in the elimination phase, when most of the fluorescein has been removed from both intravascular and extravascular spaces. E. Late phases of fluorescein study showing hyperfluorescence from the melanoma caused by the presence of fluorescein in the extravascular stroma of the tumor. Hyperfluorescence is probably the result of greater concentration of fluorescein and transmission of this fluorescence through the abnormal pigment granules within the tumor cells and RPE changes overlying the tumor. (Courtesy of L.K. Sarin, MD, Wills Eye Hospital, Philadelphia, PA.)

Fig. 23. Hyperfluorescence in metastatic tumor of the choroid. A. Kodachrome of creamy yellow metastatic choroidal lesion. B. Metastatic tumor cells in localized area within choroid surround the associated vasculature. In early phases of the angiogram, therefore, metastatic lesions are often relatively hypofluorescent. C. Early fluorescence (arrows) arising mostly from the intravascular component of the tumor. D. Metastatic choroidal tumor cells with increased vascular supply. Concentration of fluorescein (black dots) in extravascular stroma of the tumor is greater than within the intravascular space. Because there are no pigment granules within these tumors, and because secondary RPE changes (not shown) may occur, fluorescence is also transmitted. E. Hyperfluorescence (arrows) from tumor in the later phases of the study. Hyperfluorescence is caused by fluorescein remaining in the extravascular component of the tumor after most of the fluorescein has been removed from the rest of the choroid. (Courtesy of P.R. McDonald, MD, Wills Eye Hospital, Philadelphia, PA.)

Hyperfluorescence, as seen with the previously mentioned tumors, also results from transmission through pigment epithelial defects and from the presence of fluorescein in cystic spaces within the retina.

Hyperfluorescence may also be caused by the transmission of normal background choroidal fluorescence through defects of the RPE secondary to various pathologic conditions. In albinism, a defect in production of melanosomes leads to increased transmission of choroidal fluorescence through the nonpigmented RPE (see Fig. 17). With degenerative disease affecting the RPE, focal areas lacking pigment are seen with adjacent areas of hyperpigmentation. In the early phases of a fluorescein study, the choroidal fluorescence is transmitted through these defects in the RPE,43 whereas in the late phases, there is actual staining with fluorescein in these areas (Fig. 24). The adjacent focal areas of hyperpigmentation cause blockage of the background choroidal fluorescence. Drusen may act in the same manner because the RPE may be thinned over these lesions.44 Transmission of the choroidal fluorescence occurs early, whereas actual staining with the dye is seen late (Fig. 25).

Fig. 24. Hyperfluorescence and hypofluorescence in cone dystrophy. A. Kodachrome of bull's eye maculopathy in patient with cone dystrophy. B. The retinal pigment epithelium (RPE) is attenuated with adjacent areas of hyperpigmentation because of uptake of pigment granules by macrophages or hyperplastic pigmented epithelial cells. Early stage of study shows fluorescein (black dots) within the choroidal vasculature and leaking into extravascular space of inner choroidal layers. Fluorescence is transmitted through areas of defective RPE. C. Transmission of underlying choroidal fluorescence through defects in the RPE gives a ring pattern of hyperfluorescence. Blockage of underlying background choroidal fluorescence by adjacent focal areas of hyper-pig-men-tation is also seen.

Fig. 25. Hyperfluorescence in patient with multiple drusen. A. Kodachrome of diffuse nonconfluent drusen in an eye with age-related maculopathy. B. Drusen develop in the inner layers of Bruch's membrane elevating and thinning overlying RPE with a greater accumulation of pigment along edges of the drusen. In early phases of the angiogram, fluorescein (black dots) accumulates in the inner choroidal layers and is transmitted through thinned RPE overlying the drusen's apex. Borders of drusen, with increased overlying concentrations of pigment, show a relative hypofluorescence. C. Transmission of normal background choroidal fluorescence through thinned RPE overlying the drusen throughout the posterior pole. D. Later phases with fluorescein (black dots) actually accumulating within the drusen. Hyperfluorescence occurs secondary to transmission through the thinned RPE and a greater concentration of the fluorescein within the drusen. E. Hyperfluorescence of drusen in late phases due to transmission of background choroidal fluorescence and increased concentration of fluorescein within the drusen.

HYPOFLUORESCENCE

Hypofluorescence from absence of fluorescein in an area where it would normally be seen may be secondary to a lack of perfusion or to absence of the tissue. The hypofluorescence seen in the early frames of an individual with a coloboma results from the absence of the choriocapillaris; even though the RPE is absent, there is only transmission of the large choroidal fluorescein-filled vessels (Fig. 26A and B). In the very late stages of the study, the coloboma hyperfluoresces secondary to scleral staining in the area devoid of RPE (see Fig. 26C and D). Hypofluorescence can also be secondary to a relative decrease in the fluorescein concentration. This may partially explain why a choroidal nevus does not fluoresce (Fig. 27). In addition to the nevus cells occupying space where the dye would normally accumulate, hypofluorescence is also caused by obscuration of fluorescence by the heavy concentration of pigment (Fig. 28).

Fig. 26. Hypofluorescence in a patient with a coloboma involving RPE and inner choroidal layers. A. Coloboma involving the RPE, Bruch's membrane, choriocapillaris, and inner choroidal layers. In the early filling phase, fluorescein (black dots) accumulates in the choriocapillaris on either side of the coloboma, but little fluorescein is seen within the area of the coloboma itself, except in large outer choroidal vessels. B. During early phases, the coloboma is hypofluorescent because of the absence of fluorescein within this area. Deep choroidal vessels filled with dye transmit fluorescence (arrows). Surrounding relative hyperfluorescence is the result of accumulation of fluorescein within the adjacent normal inner choroidal layers. C. In the late phase, fluorescein (black dots) is still present in the extravascular space of the outer choroidal layers. In contrast to early phases, there is relative hyperfluorescence in the area corresponding to the coloboma because of transmission through an area devoid of RPE and inner choroid. D. In late phases, the coloboma shows a relative hyperfluorescence because of transmission of dye from the sclera and outer choroidal layers through the absent RPE and inner choroidal layers.

Fig. 27. Hypofluorescence in a patient with choroidal nevus. A. Kodachrome of densely pigmented choroidal nevus. B. Nevus cells in localized area within the choroid. Accumulation of fluorescein (black dots) within intravascular and extravascular spaces of the choroid is seen. Fluorescein accumulates between the cells of the nevus; however, it may be less concentrated in the area of the nevus because of the crowding of these cells. A relative area of hypofluorescence will be seen corresponding to the nevus because of less fluorescein in the area, and also because of obscuration or absorption, or both, of fluorescence by pigment granules within the nevus. C. Hypofluorescence of choroidal nevus in early phase of angiogram. Hypofluorescence is exaggerated by surrounding normal background choroidal fluorescence.

Fig. 28. Hypofluorescence in a patient with focal hypertrophy of the RPE. A. Increased concentration of pigment within area of RPE hypertrophy. Fluorescein (black dots) in the inner choroidal layers is obscured because of greater density of pigment granules within the hypertrophic RPE. B. Hypofluorescent area corresponding to hypertrophy of the RPE. This is the result of a blockage or obscuration of the underlying choroidal fluorescence by the greater density of pigment seen in the hypertrophic RPE. (Courtesy of W. Annesley, MD, Wills Eye Hospital, Philadelphia, PA.)

(Obscuration or blockage of choroidal fluorescence as a mechanism of hypofluorescence may be seen in several other conditions. A hemorrhage under the RPE causes a corresponding area of hypofluorescence due to a blockage of the underlying fluorescence (Fig. 29). For the same reason, an area of hypertrophy of the RPE will appear hypofluorescent (see Fig. 28). In addition, patients with Stargardt's disease often exhibit a silent choroid secondary to blockage of background choroidal fluorescence by lipofuscin accumulation in the RPE (Fig. 30).

Fig. 29. Hypofluorescence in patient with a hemorrhage under the RPE. A. Kodachrome of PED with inferior dependent hemorrhage B. Hemorrhagic detachment of RPE. Fluorescein (black dots) fills intravascular and extravascular spaces of the choroid but is obscured by the overlying hemorrhagic detachment of the RPE. C. Inferior hypofluorescence within the PED is caused by obscuration of choroidal fluorescence by the dependent hemorrhage.

Fig. 30. Absence of the normal background choroidal fluorescence in a patient with fundus flavimaculatus (Stargardt's disease).

In patients with choroidal folds, there are alternating areas of hypofluorescence and hyperfluorescence (Fig. 31).45 The hypofluorescent lines correspond to the areas between the peaks of the folds where the RPE pigment concentration is greatest, causing a relative blockage of the underlying fluorescence. The alternating hyperfluorescent lines represent the peaks of the folds where the pigment concentration is less, allowing a greater transmission of the choroidal fluorescence.

Fig. 31. Hypofluorescence in patient with choroidal folds. A. Folding of the inner choroidal layers involving RPE. The pigment cells overlying the peaks of these folds are thinner compared with RPE cells along edges, which are crowded together at the base of the folds. Concentration of pigment over the peaks of folds is less than pigment density between the folds. The intravascular and extravascular accumulation of fluorescein (black dots) in the inner choroidal layers is seen. B. Linear areas of hyperfluorescence alternating with areas of hypofluorescence. (Courtesy of W. Annesley, MD, Wills Eye Hospital, Philadelphia, PA.)

Back to Top
IRIS FLUORESCEIN ANGIOGRAPHY
Although the major application of fluorescein angiography has been in diseases of the ocular fundus, similar study of the iris has become an effective method for evaluating the iris vasculature in both normal and abnormal ocular conditions. Jensen and Lundbaek were the first to report the use of iris angiography in the study of diabetic eyes in 1968.46 Initially, the study was limited to individuals with light iris color because dense stromal pigment obscured the iris vasculature in brown-eyed patients.34 Implementation of microscope lens adapters mounted on standard fundus cameras by D'Anna and associates has permitted routine iris angiography in the heavily pigmented iris.47 Use of new dyes with different protein bindings and spectral characteristics may also improve this technique further.47

The filling of iris vessels takes place approximately 10 to 15 seconds after injection of fluorescein. Iris transit is more sluggish than either the retinal or choroidal circulations.34,47,48 Fluorescein fills the major arterial circle of the iris from the long posterior and anterior ciliary arteries.49 Filling of stromal arterioles progress from the iris root and is variable and frequently segmental.34,48 Van Nerom and associates found that 90% of their healthy subjects showed filling of the temporal quadrant last, whereas in 80%, the inferior quadrant filled first.48 After arteriolar filling, the arteriovenous loops at the collarette fill, followed by the capillary network at the pupillary margin. Venous filling develops 2 to 4 seconds later.

Under normal conditions, leakage from the iris vasculature is rare but can occur at the pupillary margin in individuals older than 40 years of age. Leakage of dye occurs much more frequently in pathologic states, however, and therefore makes this technique valuable in the study of diabetes, uveitis, iris tumors, central retinal artery and vein occlusions, and hypertension.48,50

Back to Top
REFERENCES

1. Blacharski PA: Twenty-five years of fuorescein angiography. Arch Ophthalmol 103:1301, 1985

2. Alvis DL: Twenty-fifth anniversary of fluorescein angiography. Arch Ophthalmol 103:1269, 1985

3. PatzA, Finkelstein D, Fine SL et al: The role of fluorescein angiography in national collaborative studies. Ophthalmology 93:1466, 1986

4. Singerman LJ: Fluorescein angiography: Practical role in the office management of macular diseases. Ophthalmology 93:1209, 1986

5. Von Baeryer A: Uber ein neue Klasse van farbstoffen. Ber Deutschen Chem Ges 4:555, 1871

6. Nielsen NV: The normal fundus fluorescein angiogram and the normal fundus photograph. Acta Ophthalmol Scand Suppl (Copenh) 180:1, 1986

7. Passmore JW, King JH: Vital staining of conjunctive and cornea. Arch Ophthalmol 55:568, 1955

8. Ehrlich P: Uber provicirte fluorescenzerscheinungen am Auge. Dtsch Med Wochenschr 8:21, 1882

9. MacClean AL, Maumenee AK: Hemangioma of the choroid. Am J Ophthalmol 57:171, 1959

10. Novotny HR, Alvis DL: A Method of Photographing Fluorescence in Circulating Blood of the Human Eye. Brooks Air Force Base, TX: US Air Force School of Aviation Medicine, Aerospace Medical Center, Technical Report 60–82, 1960

11. Novotny HR, Alvis DL: A method of photographing fluorescein in the human retina. Circulation 24:72, 1961

12. Tredici TJ: History of fluorescein angiography corrected. Arch Ophthalmol 104:21, 1986

13. Wolfe DR: Fluorescein angiography basic science and engineering. Ophthalmology 93:1617, 1986

14. Romanchuk KG: Fluorescein. Physiochemical factors affecting its fluorescence. Surv Ophthalmol 26:269, 1982

15. Christy RW, Pytte A: The Structure of Matter: An Introduction to Modern Physics, pp 291–306. New York: WA Benjamin, 1965

16. Berkow JW, Kelly JS, Orth DH: Fluorescein Angiography: A Guide to the Interpretation of Fluorescein Angiograms, p 16. Chicago: AAO, 1984

17. Delori FC, BenSira I: Excitation and emission spectra of fluorescein dye in the human ocular fundus. Invest Ophthalmol 14:487, 1975

18. Wessing A: Fluorescein Angiography of the Retina: Textbook and Atlas, p 14. Van Noorden GK (trans). St Louis: CV Mosby, 1969

19. Nasrallah FP, Jalkh AK, Trempe CL et al: Low-dose fluorescein angiography. Am J Ophthalmol 105:690, 1988

20. Kratz RP, Mazzocco TR, Davidson B: A case report of skin necrosis following infiltration with I.V. fluorescein. Ann Ophthalmol 12:654, 1980

21. Schatz H: Sloughing of skin following fluorescein extravasation. Ann Ophthalmol 10:625, 1978

22. Webb JM, Fonda M, Brower EA: Metabolism and excretion patterns of fluorescein and certain halogenated fluorescein dyes in rats. J Pharmacol Exp Ther 137:141, 1962

23. Kelley JS, Kincaid M, Hoover RE et al: Retinal fluorograms using oral fluorescein. Ophthalmology 87:805, 1980

24. Ghose S. Nayak BK: Role of oral fluorescein in the diagnosis of early papilloedema in children. Br J Ophthalmol 71: 910, 1987

25. Nayak BK, Ghose S: A method for fundus evaluation in children with oral fluorescein. Br J Ophthalmol 71:907, 1987

26. Kinsella KP, Mooney DJ: Anaphylaxis following oral fluorescein angiography. Am J Ophthalmol 106:745, 1988

27. Yannuzzi LA, Rohrer KT, Tindd LJ et al: Fluorescein angiography complication survey. Ophthalmology 93:611, 1986

28. Stein MR, Parker CW: Reactions following intravenous fluorescein. Am J Ophthalmol 72:861, 1971

29. Grayson MC, Laties AM: Ocular localization of sodium fluorescein: Effects of administration in rabbit and monkey. Arch Ophthalmol 85:600, 1971

30. Ota M, Tsukahara I: Fluorescein microscopic studies on fundus fluorescein angiography. Acta Soc Ophthalmol Jpn 75:172, 1971

31. Justice J. Lehmann RP: Cilioretinal arteries. Arch Ophthalmol 94:1355, 1976

32. Smith RS: Ultrastructural studies of the blood aqueous barrier. I. Transport of an electrondense tracer in the iris and ciliary body of the mouse. Am J Ophthalmol 71:1066, 1971

33. Vegge T. Ringvold A: Ultrastructure of the wall of human iris vessels. Z Zellforsch 94:19, 1969

34. Hayreh SS, Scott WE: Fluorescein iris angiography. I. Normal pattern. Arch Ophthalmol 96:1383, 1978

35. Shakib M, CunhaVaz JG: Studies on the permeability of the blood retinal barrier. Exp Eye Res 5:229, 1966

36. Saari M: Studies on the vasculature and myelinated nerves of the pig iris. Acta Ophthalmol (Suppl) 118:3, 1972

37. Schatz H. Burton TC, Yannuzzi LA, Rabb MF: Interpretation of Fundus Fluorescein Angiography, p 8. St Louis: CV Mosby, 1978

38. Miller SA: Fluorescence in Best's vitelliform dystrophy, lipofuscin, and fundus flavimaculatus. Br J Ophthalmol 62:256, 1978

39. Larsen M, Kjer B, Bendtson I et al: Lens fluorescence in relation to metabolic control of insulin-dependent diabetes mellitus. Arch Ophthalmol 107:59, 1989

40. Schatz H, Burton TC, Yannuzzi LA, Rabb MF: Interpretation of Fundus Fluorescein Angiography, p 84. St Louis: CV Mosby, 1978

41. Archer D, Krill AK, Newell FW: Fluorescein studies of normal choroidal circulation. Am J Ophthalmol 69:543, 1970

42. Hyvarinen L, Maumenee AK: Interpretation of choroidal fluorescence. In: Proceedings of the International Symposium on Fluorescein Angiography, pp 183–188. Albi, 1969

43. Krill AK, Newell FW, Chishti MI: Fluorescein studies in diseases affecting the pigment epithelium. Trans Am Ophthalmol Soc 66:269, 1968

44. Gass JDM: Drusen and disciform macular detachment and degeneration. Arch Ophthalmol 90:206, 1973

45. Newell FW: Choroidal folds: The seventh Harry Searls Gradle memorial lecture. Am J Ophthalmol 75:930, 1973

46. Jensen VA, Lundbaek K: Fluorescein angiography of the iris in recent and longterm diabetes. Diabetologia 4:161, 1968

47. D'Anna SA, Hochheimer BF, Joondeph HC et al: Fluorescein angiography of the heavily pigmented iris and new dyes for iris angiography. Arch Ophthalmol 101:289, 1983

48. Van Nerom PR, Rosenthal RA, Jacobsen DR et al: Iris angiography and aqueous photofluorometry in normal subjects. Arch Ophthalmol 99:489, 1981

49. Braun-Jensen J: Fluorescein angiography of the anterior segment. Am J Ophthalmol 67:842, 1969

50. Sanborn GE, Symes DJ, Magargal LE: Fundusiris fluorescein angiography: Evaluation of its use in the diagnosis of rubeosis irides. Ann Ophthalmol 18:52, 1986

Back to Top