Chapter 3
Evaluation of the Posterior Chamber, Vitreous, and Retina with Ultrasound
D. JACKSON COLEMAN, RONALD H. SILVERMAN, MARK J. RONDEAU, SUZANNE W. DALY and HARRIET O. LLOYD
Main Menu   Table Of Contents

Search

IRIS, CILIARY BODY, ANTERIOR VITREOUS, AND LENS
VITREOUS HEMORRHAGE AND PRIMARY VITREOUS DETACHMENT
ENDOPHTHALMITIS AND SCLERITIS
RETINAL DETACHMENT
CHOROIDAL DETACHMENT
FOREIGN BODIES
OCULAR TUMORS AND SIMULATING LESIONS
SPECIALIZED TECHNIQUES FOR IMAGING AND DIAGNOSIS IN OPHTHALMIC ULTRASONOGRAPHY
REFERENCES

Ultrasonography has become as essential as indirect ophthalmoscopy or slit lamp in evaluation of the posterior segment of the eye. It is the only means of evaluating occult retroiridal and ciliary body lesions as well as any situation in which the media have become optically compromised. When the vitreous is opaque or occult due to anterior segment opacifications, ultrasound is necessary to identify and characterize vitreous hemorrhage or inflammation, retinal or choroidal detachment, tumors, foreign bodies, and choroidoscleral wall shape and thickness. Many of these acoustically detectable changes represent treatable disorders that can be managed properly only after accurate diagnosis.

Advances in instrumentation, higher frequencies, and greater sensitivity and resolution have resulted in a continuous improvement in image quality.1 As with any imaging technique, familiarity with the principles and physics of the methodology is necessary to properly recognize the advantages as well as limitations of the technique in a given clinical setting and to minimize difficulties in interpretation of the image. The primary tool for ultrasound evaluation is the use of gray-scale B-scan to delineate tissue boundaries. Ophthalmic ultrasonography remains one of the few areas of medical ultrasonography in which A-scan continues to be used to further differentiate tissue characteristics, such as membrane, retina, tumor, and cyst. Improved B-scan gray scale has reduced some of the advantages of A-scan, but A-scan is still necessary for quantifying echo amplitudes, particularly when distinguishing vitreous membranes from retina or identifying tumor types.2,3

In general, ophthalmic diagnostic ultrasound systems continue to use single-element 10 MHz mechanical sector scan probes to provide the best quality two-dimensional B-scan image.2 The cost of high-end array technology available with “mainframe” ultrasound units is typically prohibitive in ophthalmic practice. In addition, the array and dynamic focusing characteristics of typical small-parts probes are not currently optimized for ophthalmic geometries. Very high frequency ultrasound uses frequencies in the range of 35 to 100 MHz to show greater detail of the anterior segment.4 Penetration is limited for these higher frequencies to only a few millimeters; thus, only the anterior vitreous behind the ciliary body and lens can be imaged. Frequencies of up to 20 MHz can be used for posterior pole evaluation of the retina and choroid.

Back to Top
IRIS, CILIARY BODY, ANTERIOR VITREOUS, AND LENS
Iris swelling or pigmentation, trauma, foreign body, complications of cataract surgery, intraocular lens dislocation or suspected ciliary body tumors are all indicators for high-frequency ultrasound evaluation. The ultrasound biomicroscope was the first commercially available high-frequency scanner to demonstrate the potential of frequencies in the 50 MHz range for examining this region.5–7

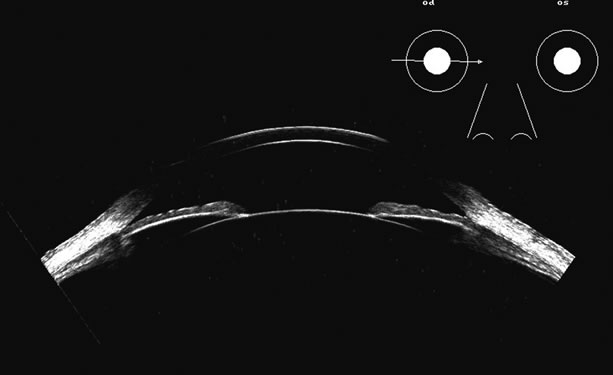
Lens position, presence, and integrity can be shown most easily with immersion ultrasound, since the proximity of these structures to the transducer in contact techniques makes them difficult to display. Immersion or a water standoff makes it possible to visualize the anterior segment by moving the “noise” of the main bang of the transducer forward, away from the structures of interest and the focal zone onto this area.8 The lens is a “specular” reflector which, like the cornea, is a smooth, highly reflective surface. Whereas specular reflectors, such as the lens, may deflect most acoustic energy away from the transducer when insonified at an oblique angle, “diffuse” reflectors, such as blood-covered membranes, are more easily discerned on B-scan. Blood enhances lens boundaries; that is, it converts the specular reflective surface to a diffuse reflective surface, making the entire outline of the surface more easily seen, even at regions angled so they would otherwise deflect the returning echoes away from the transducer and not be identifiable. The posterior capsule is concave and thus perpendicular to the beam over much of the arc of sector B-scanning, thus making it always easy to identify. The lens outline should be smooth and unbroken (Fig. 1); a damaged lens often is cataractous and has internal echoes as well as interrupted surface echoes.9 Kinetic scanning, that is, real-time scanning while the patient moves his or her eye, can be used to check for mobility of the lens in dislocated or partially dislocated lenses.

Fig. 1. Very high frequency ultrasound scan of the anterior segment of the eye. The posterior chamber is easily outlined at this nominal 50 MHz scan as the region posterior to the iris plane. The ciliary body is well defined as is the region at the equatorial margin of the lens. Pathology in this area is of interest to the posterior segment surgeon as it contains several treatable entities, such as foreign bodies, ciliary body tumors, cysts, and separation, as in hypotony.

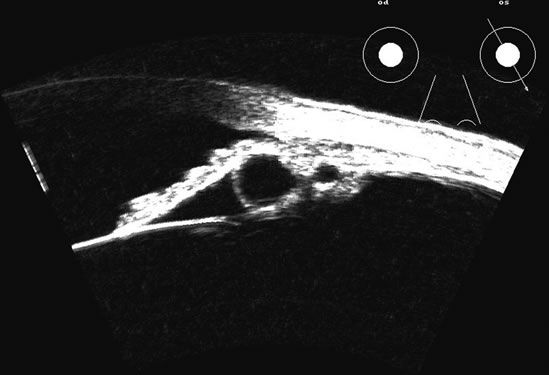
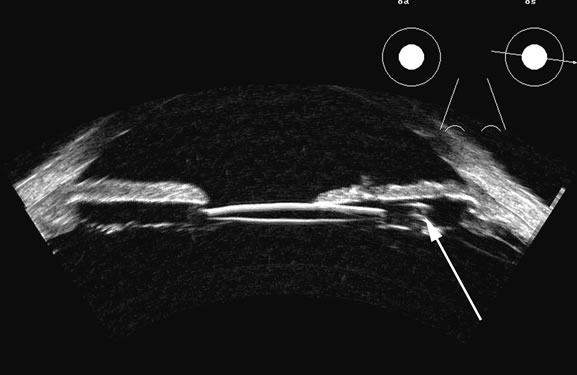
The four main areas of interest in the posterior chamber to the ocular surgeon are (1) iris and ciliary body tumors, (2) intraocular foreign bodies and trauma that may involve the lens, (3) intraocular lens placement and position that may cause irritation or decreased vision, and (4) hypotony with separation of the ciliary body from the sclera.10 Examples of a retroiridal cyst and a tumor are shown in Figures 2 and 3. Intraocular lens displacement, particularly erosion of haptics that may produce bleeding, is a commonly seen problem. An intraocular lens with a folded haptic is seen in Figure 4 and a retro displaced haptic is shown in Figure 5.

Fig. 2. Ciliary body retroiridal cyst can be demonstrated in this occult area as clear, usually rounded, single or multiple cystic spaces. They are nearly always clear acoustically and may at times contact the lens and occasionally cause cataract formation.

Fig. 3. Solid tumor of the ciliary body, often appearing relatively round, but occasionally irregularly shaped to match the area of the ciliary body itself. It can be presented in 3D for measurement of growth, but usually these highly lethal tumors are treated soon after presentation.

Fig. 4. A clinically well-placed posterior chamber intraocular lens nevertheless had patient complaints of photophobia and irritation due to a folded haptic (arrow).

Fig. 5. An anterior chamber intraocular lens has had the support haptics dislocate posterior to the iris plane and can be seen as typical foreign body echogenic reflections (arrows).

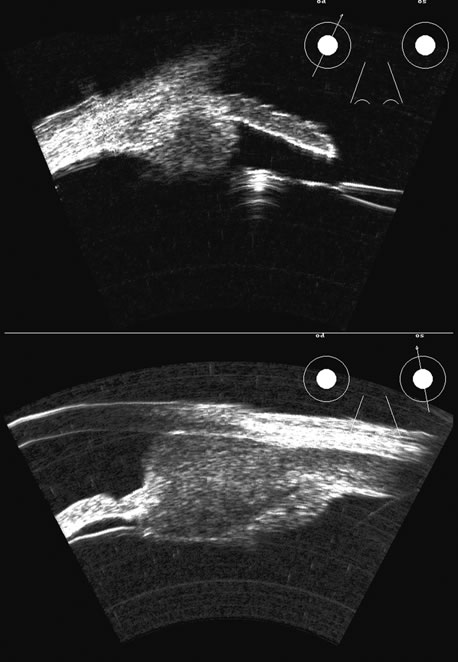
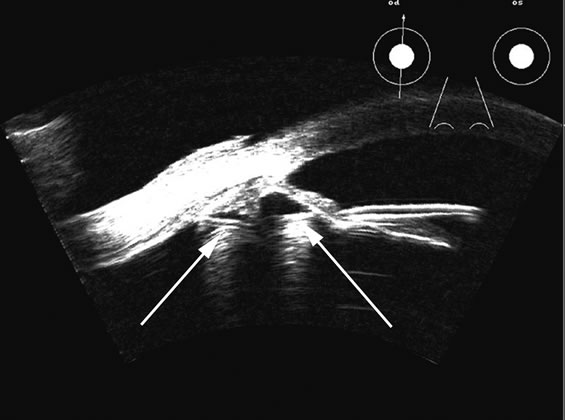
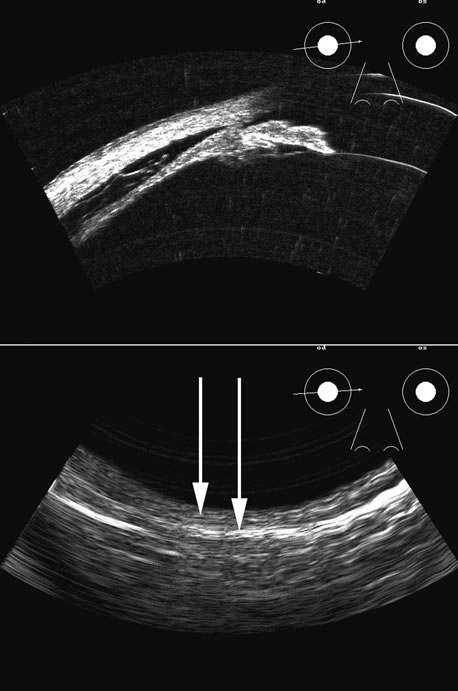
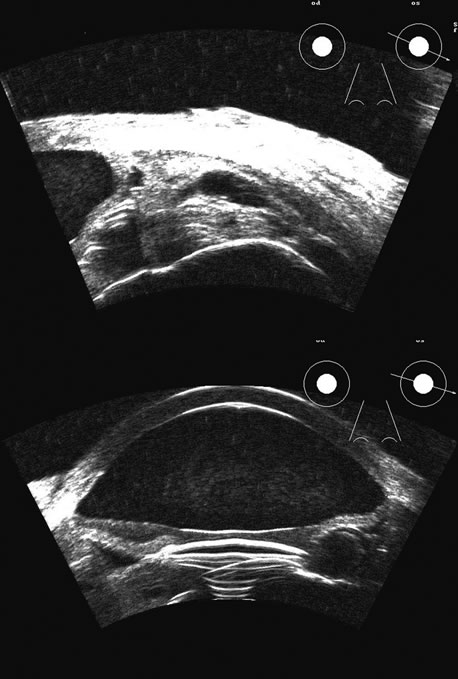
Hypotony is easily diagnosed by direct measurement of intraocular pressure, but the underlying cause is difficult to evaluate.11 High-frequency ultrasound scans can easily reveal separation of the ciliary body and the sclera. This allows different forms of hypotony to be determined—for example: tractional with membrane attached; primary as idiopathic, often inflammatory or hemorrhagic; and dehiscence secondary to iridodialysis or scleral perforation (Fig. 6).

Fig. 6. Hypotony of the eye generally is easily diagnosed by a separation of the ciliary body from the sclera. We have noted several types of such separation, such as tractional, primary (idiopathic), and dehiscence secondary to iridodialysis or scleral perforation, as in filtration procedures. In our series, greater than two clock hours of separation is typical of hypotony. The lower figure shows a concomitant thickening of the retina-choroid complex, also seen in hypotony (arrows). Long-standing hypotony typically has a shortened globe and possible retinal or choroidal separation.

Back to Top
VITREOUS HEMORRHAGE AND PRIMARY VITREOUS DETACHMENT
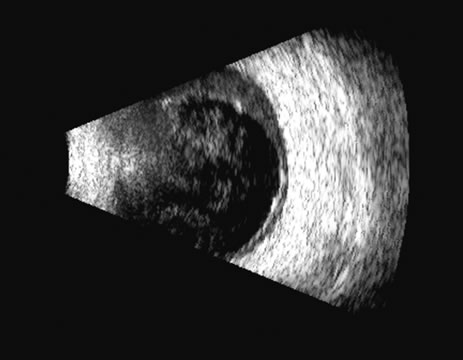
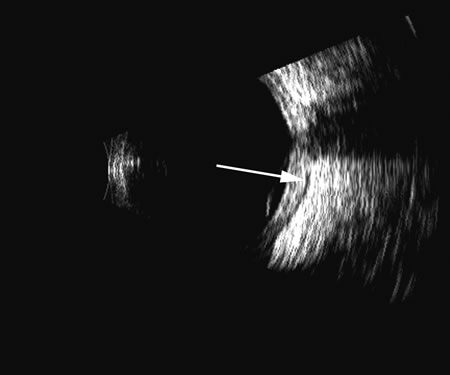
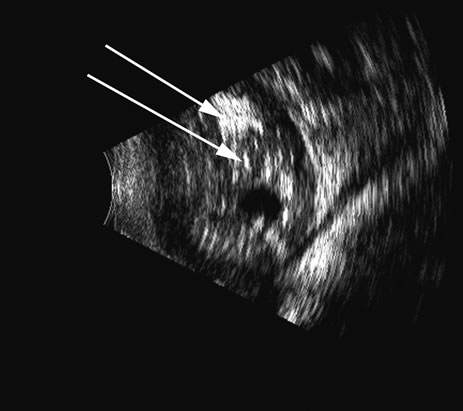
Fresh blood in the vitreous may be acoustically clear since the red cells may not have congealed sufficiently to form a good echo-producing surface.8 A retracted “hyaloid” or posterior limiting membrane (PLM) of the vitreous can be shown with most B-scan instruments, but paradoxically a retracted vitreous may not be seen as well with higher-resolution, more highly focused transducers because they display less area of the reflective surface. Blood collected on the surface of the PLM enhances this surface and may, in some cases, make the PLM resemble a detached retina, since its anatomic dimensions can be similar to the retina. Three differences may help distinguish the two structures. First, kinetic scanning reveals a lack of attachment at the optic nerve for a PLM. Second, the PLM is irregular in reflection and thickness (usually thicker than the retina) between the ora and the disc, and usually the surface cannot be traced forward to the ora on the B-scan display. Third, the amplitude of the echoes from the PLM is lower than from the retina, except when directly perpendicular to the beam, where they may be similar in amplitude. Many of these features of a PLM are demonstrated in Figure 7, whereas Figure 8 shows a typical detached retina.

Fig. 7. This B-scan ultrasonogram demonstrates retinitis proliferans with typical vitreous membrane attaching to the proliferative membrane (arrows) that can resemble a traction detachment. Scanning at right angles helps distinguish proliferative membranes from retinal traction membranes, as they have less reflectivity than retina.

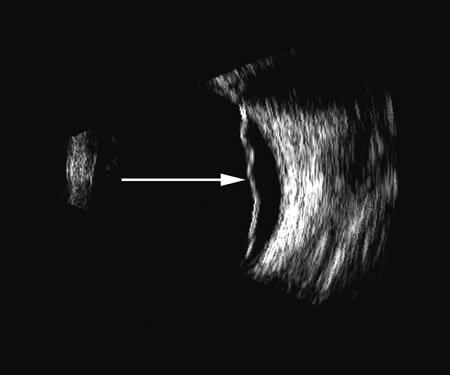
Fig. 8. A retinal detachment (arrow) is very easily detected as a high-amplitude, usually relatively rigid or gently wafting structure connecting always to the optic nerve head in a complete detachment, and usually traceable anterior to the ora serrata. Variations of this pattern can be seen, depending on the plane of the cut and the extent of the detachment, but the height of the echo on A-scan should always be maximal in order to differentiate retina from other, similar membrane formations.

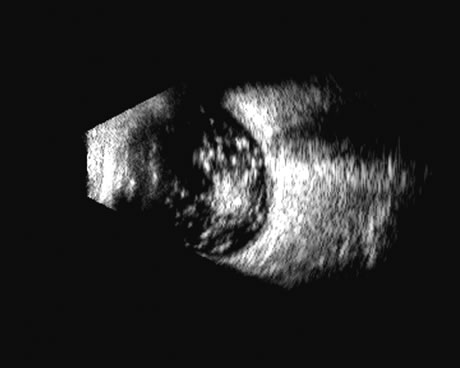
Hemorrhage shows good echogenic properties and presents a typical highly reflective vitreous body (Figs. 9 and 10). Asteroid hyalosis may resemble a vitreous hemorrhage except that the individual calcium deposits are even more reflective than hemorrhage and usually there is a clear anechoic zone between the retina and the retracted primary vitreous (Fig. 11). Synchysis scintillans is another condition with highly reflective regions in the vitreous due to cholesterol crystals. It is identifiable by the kinetic scan pattern of floating “snowflakes” that settle when the eye stops moving, just like the snowflakes in a child's snow globe. Since the “normal” vitreous is usually dissolved in this condition, the echoes come to rest on the retinal surface when the eye stops moving.

Fig. 9. B-scan ultrasonogram at 10 MHz demonstrating vitreous hemorrhage with blood accentuating the separation of the posterior hyaloid from the retina. Blood echoes vary with the length of time since the bleeding episode. Fresh blood may be relatively anechoic. Blood can produce relatively solid echoic debris or, with time, areas of fluid loculation. Blood is not easily differentiated from other debris as in uveitis.

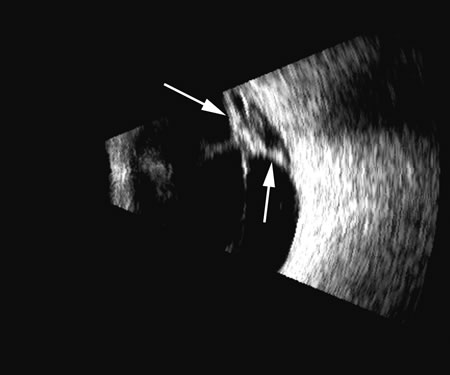
Fig. 10. Vitreous hemorrhage with subretinal blood. A retracted vitreous with blood is seen to the left in front of a clear subretinal space (arrow). Posteriorly, the retina is elevated with blood under the retina and even demonstrates layering of blood in the lower part of the picture (small arrow).

Fig. 11. A contact B-scan of an eye with asteroid hyalosis. These deposits are exceptionally reflective and fill the entire solid vitreous, which is usually retracted, leaving a clear zone between vitreous and retina.

An area or region of attachment of presumed vitreous to the ocular wall can be seen with kinetic scans and may indicate an area of stress or possible retinal tear. In diabetic retinopathy with proliferative membranes, the vitreous is often attached to a membrane, producing a typical cross-shaped elevation on a scan through the long axis of the proliferans. Right-angle or three-dimensional scans show the folded nature of the retinitis proliferans membrane (see Fig. 13).

Fig. 13. A long-standing retinal detachment exhibits a characteristic truncated cone pattern, with the apex of the cone attached at the optic nerve. Folds of the retina can be seen as cyst-like protrusions on the retina surface (arrows).

Back to Top
ENDOPHTHALMITIS AND SCLERITIS
Inflammation of the vitreous can produce cellular and fibrotic conglomerates that produce echoes similar to those of hemorrhage. Differentiation is usually made on clinical grounds but may be suggested by the presence of inflammation-induced swelling of the choroid and sclera, and by the presence of a fluid layer between Tenon's capsule and the orbital fat, which is commonly seen in scleritis (Fig. 12).12 Other conditions, such as hypotony, produce identifiable thickening of the choroid and sclera. Hypotony in its later stages also produces the characteristics of the “pre-phthisic” eye, namely, shortened axial length and cyclitic membrane formation.13

Fig. 12. Scleritis of the posterior pole produces an accentuation of the Tenon's surface posterior to the sclera and is commonly traceable to the meninges as they pass posteriorly along the optic nerve. This accentuated reflective “space” is often called a T-sign (arrow).

Back to Top
RETINAL DETACHMENT
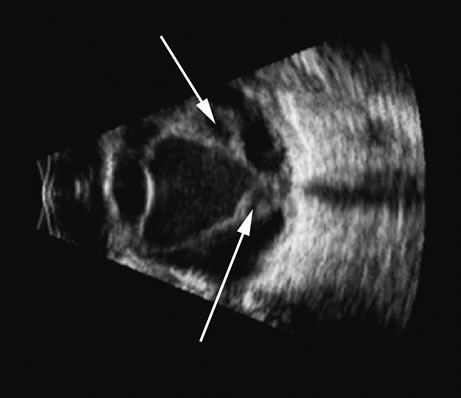
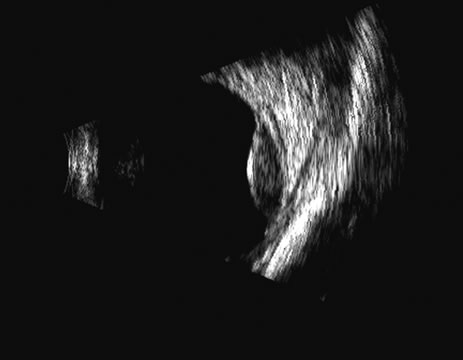
The retina is a highly reflective surface (specular reflector) and can be seen to always maintain its connection to the optic nerve, even when drawn into an organized detachment. It may not be attached at the ora serrata in giant tears, but otherwise it generally maintains the two “landmark” attachments of optic nerve and ora serrata (Fig. 13), which can aid in differentiating the retina from the PLM of the retracted vitreous and from the choroid, in which the detachment may extend anterior to the ora and rarely extend back behind the vortex veins to the nerve (Fig. 14).14

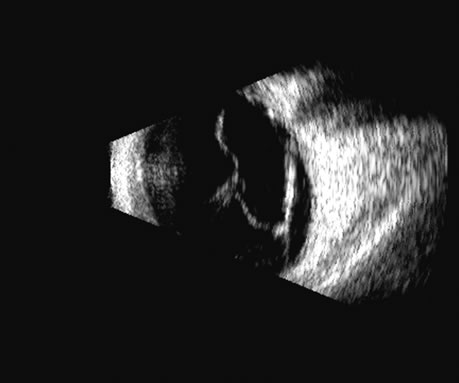
Fig. 14. A B-scan of an eye with “kissing” choroidal detachments. The smooth convex outline from the ciliary body back to the near periphery of the posterior pole can be seen. The choroidal space, though filled with blood, may often appear anechoic due to the recent, “fresh” nature of the hemorrhage.

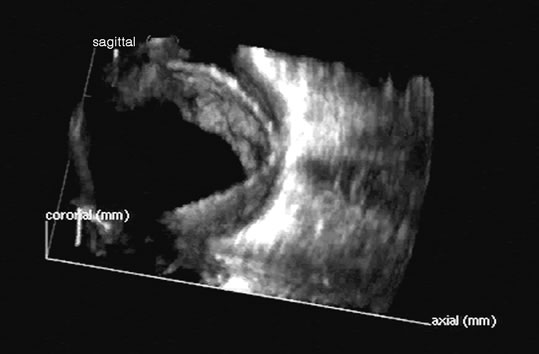
Two-dimensional scans through complex three-dimensional structures, such as preretinal membranes and proliferative membranes, can be confusing unless mapped with three-dimensional conceptualization techniques. Bronson and colleagues15 have emphasized three-dimensional thinking. Although new digital three-dimensional ultrasound systems allow direct volume visualization, it remains useful to understand the technique of conceptualizing three-dimensional structures from individual sections.16 Preretinal membranes (Fig. 15), which may resemble traction detachments in thickness and reflectivity, can often be identified by turning the scan plane of the B-scanner at right angles: the disciform retinal elevation is still seen while the linear nature of a traction sheet is revealed.17 A three-dimensional rendering of a retinal detachment can directly show the conformation of three-dimensional structures (Fig. 16), and images of individual planes can be perceived.

Fig. 15. A preretinal membrane is attached to the retina, producing a traction retinal detachment. A single-scan plane is often confusing: serial scans and movement of the patient's eye (kinetic scan) are required to conceptualize the vitreoretinal anatomic relationships. Computer reconstruction provides a significant advance in this area for ease of interpretation.

Fig. 16. 3D depiction of a retinal detachment can be helpful in situations in which there is ambiguity among retina, choroid, and schisis. The 3D rotatable display can be perceived from different perspectives, often aiding in the certainty of diagnosis.

Schisis can be difficult to differentiate from a peripheral detachment based on echo amplitude, but may be suspected based on location and other clinical factors, such as age and symptomatology. Schisis is usually convex and may have lower amplitude than a retinal echo.

Back to Top
CHOROIDAL DETACHMENT
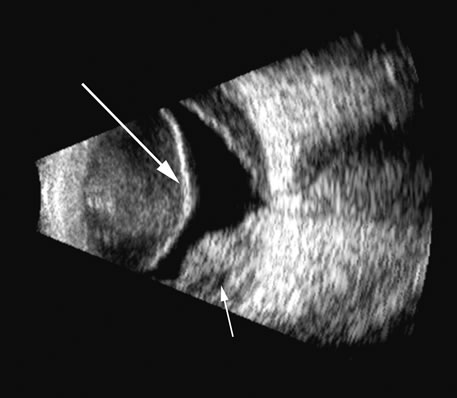
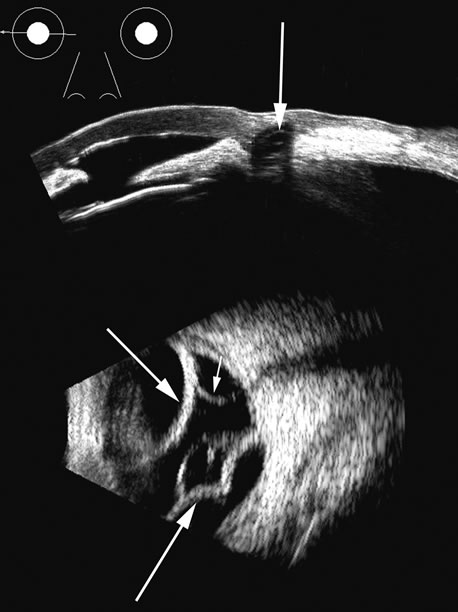
The choroid, like the retina, is highly reflective and may resemble the retina when detached. Its thickness, which includes the retina, Bruch's membrane, and the choriocapillaris (tunica ruyschiana) is not usually differentiable when measured with routine ultrasound;12 however, it may be measured with digital techniques.18 Anatomically, the choroidal elevation is usually a smoothly round, convex surface, limited posteriorly by the vortex veins and anteriorly at any point up to the base of the iris (Fig. 17). The choroidal space should be examined for echoes (blood) or a clear zone, as seen with effusion or the serous part of a hemorrhage. In evaluating membranes from retina or choroid, it is always helpful to repeat the examinations at a later time.

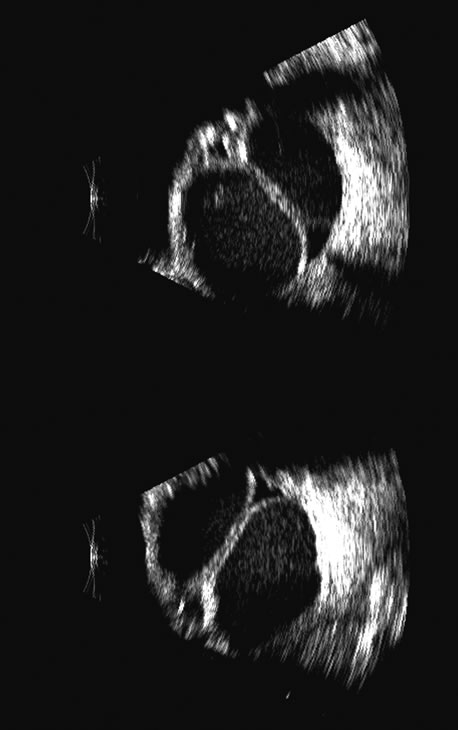
Fig. 17. This patient with a Molteno tube was treated for glaucoma. The top 50 MHz B-scan clearly shows the Molteno Tube (arrow). The bottom 10 MHz B-scan of the same patient demonstrates a choroidal detachment (large arrow) with associated posterior retinal detachment (small arrow). Choroidal elevations are typically convex, highly reflective surfaces with posterior limitation at the vortex vessels. Retina will always attach at the optic nerve. Choroidal elevations are often noted in several quadrants, as seen here.

Back to Top
FOREIGN BODIES
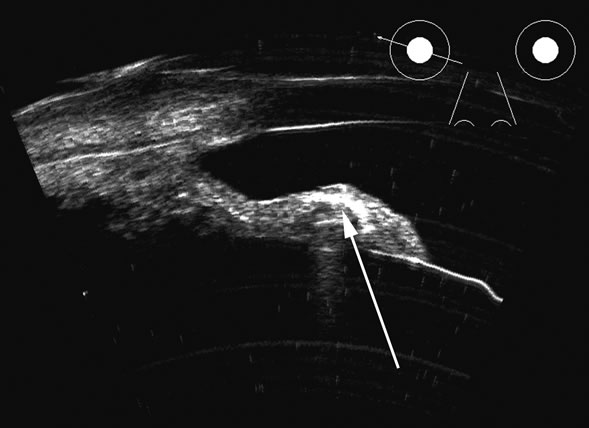
Vitreous foreign bodies are typically metal or glass objects, or intraocular lens implants. The ultrasound examination, with its better spatial resolution, is best performed following radiographic or computed tomography examinations in order to identify the location and number of foreign bodies. Ultrasonography is used to relate the position of a foreign body to the retina and lens and identify coexisting structural changes, such as retinal detachment. Metal and glass “absorb” or, more correctly, deflect sound, so that an anechoic area appears posterior to the foreign body. This area can act as an acoustic “pointer” to the foreign body (Fig. 18). A-scan or gray scale on B-scan shows a highly reflective surface of the foreign body. BBs and shotgun pellets often create a “ringing” artifact that can also act as a pointer leading to the foreign body.19 The foreign body can be easily demonstrated by lowering the gain; the foreign body remains, whereas other, less reflective tissue planes fade away due to a lower difference in acoustic impedance between tissues than metallic or glass foreign bodies. Most foreign materials have a higher density than the vitreous, and sound that passes through the foreign body may appear to move the succeeding surface forward because of the faster sound transit.

Fig. 18. A foreign body localized in the iris is easily imaged with high frequency. Characteristic trailing multiple echoes always point to the location of the body itself (arrow).

Wood may be seen with ultrasound but is far less well differentiated than metal. Air bubbles are highly reflective and may resemble a metallic foreign body. An air tamponade of the vitreous compartment prevents acoustic viewing of the structures behind the bubble. A silicone-filled vitreous produces marked distortion of the globe behind the silicone, as well as marked attenuation (Fig. 19), since sound travels slower in silicone than saline; thus, the sound is deflected away, much as with a minus lens.20 Typical sound velocities in ocular tissues are shown in Table 1, in which velocities from several sources are compiled.21–24 Some disagreement on experimental data and methodology exists,25–27 but these values are generally accepted.


Table 1. Ultrasound Velocities in Ocular Tissues


TissueSpeed (m/sec)
Lens 
   Normal1641
   Cataractous1590–1670
Aqueous1532
Vitreous1532
Cornea1660
Sclera1650
Retina1550
Choroid1550
Melanoma1640


Fig. 19. Ruptured globe with displacement of the iris lens diaphragm posteriorly and silicone placed in the vitreous compartment. The intraocular lens, as well as its support structure, can be easily seen. The clear zone posterior to the lens is the anterior silicone face. In the upper figure, blood can be seen in the posterior chamber anterior to the silicone.

Back to Top
OCULAR TUMORS AND SIMULATING LESIONS
There are several tumors that invade the vitreous or the vitreous space. In children, retinoblastoma can seed the vitreous; in adults, reticulum cell sarcoma can cause vitreous clouding but is nondiscernible from other forms of debris. A very high percentage of retinoblastomas contain calcium, which is very reflective (Fig. 20). Malignant melanoma, hemangioma, metastatic carcinoma, and subretinal hemorrhage can all present with elevated convex lesions that protrude or extend into the vitreous space and are the four most commonly seen posterior segment tumors. Anteriorly, medulloepithelioma (diktyoma) and melanocytoma or ciliary body cysts can also protrude into the vitreous. The differentiation of these tumors has been well described with conventional combined B- and A-scan ultrasound techniques2 and standardized A-scan echography,28 as well as more modern spectral analysis techniques. These all provide excellent means of differentiating solid from cystic lesions, but differentiation between diktyoma (medulloepithelioma), melanocytoma, and melanoma is not possible with A-scan or B-scan.

Fig. 20. An eye filled with a retinoblastoma, which has considerable calcium deposits that produce a very reflective, high-amplitude echogenic structure (arrows).

Malignant melanoma varies in its ultrasound presentation from a relatively homogeneous to heterogenous lesion on B-scan. The typical uveal melanoma absorbs sound so that the posterior section is relatively less echoic than the anterior aspect, producing a gradually decreasing amplitude, often to baseline on the A-scan (Fig. 21).

Fig. 21. An ocular tumor at the posterior pole showing the smooth convex border and solid internal reflectants typical of a melanoma.

Melanomas also have varying amounts of melanin, a highly acoustically reflective pigment. As noted, melanomas characteristically show high reflectivity anteriorly, with decreasing reflectance as the sound traverses the tissue. This produces the decreasing amplitude posteriorly in the tumor seen on A-scan and gray-scale B-scan. This effect often enhances the anterior scleral boundary. The posterior tumor border is thus measured as the first “rising” echo from the tumor decline, and it is most easily seen and accurately identified on B-scan.27

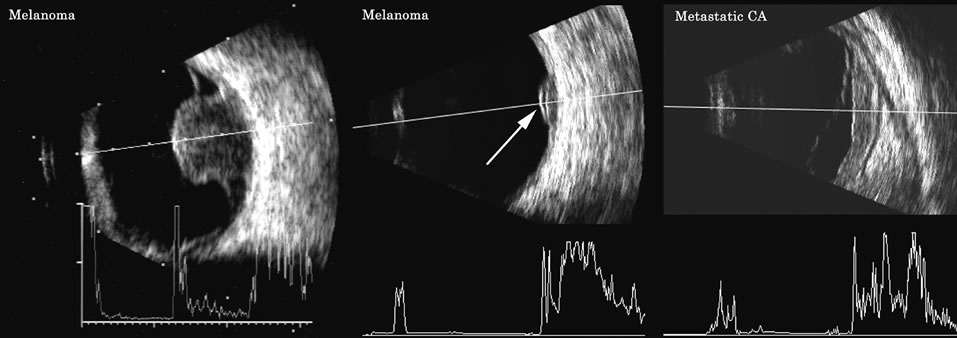
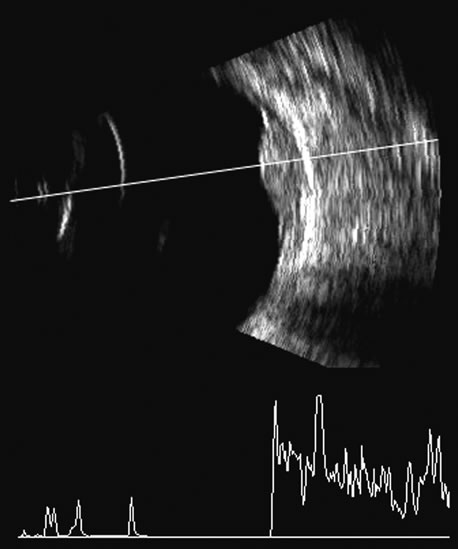
Metastatic carcinoma is more heterogeneous, producing a more uniform A-scan amplitude of roughly 50% to 80% of the “scleral” echo amplitude (see below) behind the tumor (Fig. 22). Hemangioma is a very highly reflective tumor with high amplitude all the way through the tumor of 80% to 100% of scleral echo amplitude (Fig. 23).

Fig. 22. Some hemangiomas and metastatic carcinomas may simulate a melanoma. They are differentiated on the basis of a very high amplitude internal echo complex for the hemangioma, a moderately low but sustained echo pattern for the metastasis, and an A-scan with decreasing reflectance as the tumor thickness is traversed. In the center scan of a melanoma, note the double anterior layer caused by edema fluid underlying the crest of the melanoma (arrow).

Fig. 23. A hemangioma of the posterior pole is usually very echoic, appearing solid on B-scan with little or no reduction in amplitude on A-scan between the retinal surface and the posterior tumor wall.

The differentiation of tumor tissues is made possible by differences in cellular organization and concentration.29 Acoustically, these are termed as differences in backscattering properties.30–32 A homogeneous solid tissue, such as the lens or the optic nerve, may present few or no echogenic discontinuities and thus appear anechoic and cyst-like. (An echogenic discontinuity is technically an acoustic impedance mismatch in which the acoustic impedance is the product of the density and the speed of sound in each tissue.) A fluid–smooth tissue boundary has a high mismatch or discontinuity and thus produces a high-amplitude echo. A hemangioma with alternating blood- and tissue-lined sacs thus produces a solid-appearing tissue with high-amplitude echoes seen at all depths of the tissue. A metastatic tumor is nearly always a very heterogeneous tissue with randomly organized clumps of similar cells bounded by strands of vessels, necrotic areas, and connective tissue, thus producing a pattern of moderately high-amplitude sustained echoes.

To provide a meaningful, reproducible standard of comparison, we use the scleral echo—that is, an echo behind the tumor—for comparison. We believe that the scleral echo generally is highest at the posterior sclera–Tenon's boundary; whereas Ossoinig has stated that the high amplitude echo is at the anterior scleral boundary.28,33 This school (standardized echography) also recommends a tissue velocity for melanoma of 1550 m/sec34,35 compared with the value of 1660 m/sec that we recommend. These differences can produce significant variations in measurement of tumor height, depending on the interpretive methodology used. The velocity of 1550 m/sec gives a smaller tumor height than that of 1660 m/sec, wheras the inclusion of scleral thickness may add 1 to 2 mm to the tumor height when standard echography is used. While this does not affect comparisons of tumor growth, it has a significant bearing on comparisons of data from various investigators.27

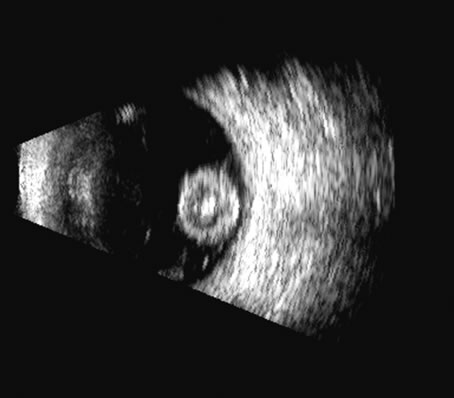
On B-scan, the invasion or replacement of the choroid by tumor is of diagnostic importance. Subretinal hemorrhage rests on a smooth curve of the posterior poles; whereas melanoma may replace the choroid, producing an “excavated” pattern.36 A completely dislocated lens can also emulate a tumor but can be differentiated by clinical findings and by having the patient move his or her eye during the examination, which causes lens displacement (Fig. 24).

Fig. 24. In this traumatized eye, the crystalline lens was completely dislocated and can be seen as a rounded mass in the posterior chamber, in a suitable plane.

Back to Top
SPECIALIZED TECHNIQUES FOR IMAGING AND DIAGNOSIS IN OPHTHALMIC ULTRASONOGRAPHY
The use of three-dimensional data acquisition along with surface and volume rendering of three-dimensional ultrasound data is becoming more commonplace in medical ultrasonography,37 particularly in obstetrics and gynecologic applications.38–40 In ophthalmology, instrumentation that digitizes radial B-scans is commercially available.41,42 In addition, tissue volume measurements made from delineation of tissue boundaries in serial scans have been shown to have an accuracy of ±2% in vitro.43 Such measurements must be corrected for the anamorphism inherent in B-scan images, where anterior-to-posterior scale is related to the speed of sound and lateral scaling is related to transducer angle or displacement. Comparison of in vivo volume determinations of ocular tumors made with this method and volumes computed from ultrasonically determined tumor linear dimensions using an ellipsoidal solid formula44 showed the latter to be of variable accuracy, sometimes producing errors of up to 50%.

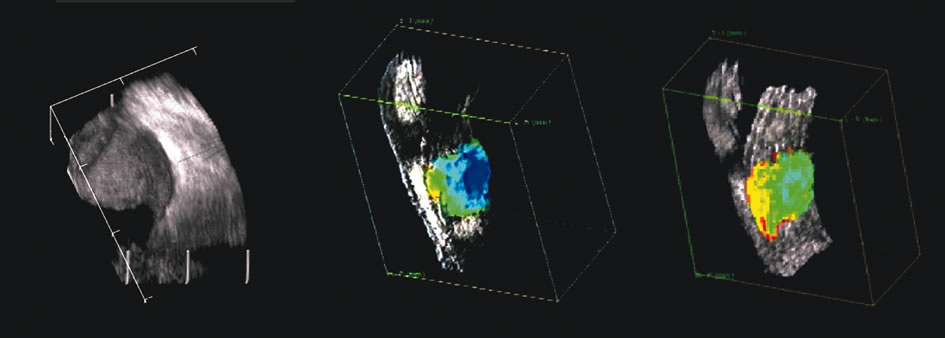
The representation of volume and three-dimensional perspectives of the diseased vitreous, retinal detachment, choroidal detachment, and tumors can add to presurgical conceptualization and is critical to characterization of tumors in relation to prediction of lethality.45 In addition, volume measurement of the choroid permits studies of both surgical and physiologic rates of clearance of hemorrhage, whereas vitreous volume studies can make the estimation of gas or other vitreous substitutes for replacement more accurate (Fig. 25).

Fig. 25. A 3D reconstruction of serial scans of a posterior pole melanoma taken with a 10 MHz transducer (left) shows the extent and relative asymmetry of the tumor within the vitreous cavity. 3D biometry can be useful for treatment planning for radiotherapy and brachytherapy. 3D reconstructions of 50 MHz serial ultrasound scans and parameter images of a melanoma involving the ciliary body and anterior uvea (center, right) before and after treatment with combined ultrasound hyperthermia and brachytherapy. Changes in the concentration of ultrasound scattering elements related to tissue necrosis are seen as color scale in the pre- and postimage region of the tumor shifts, from blue, indicating relatively low acoustic concentration, to yellow and green, indicating higher concentrations of scatterers.

Spectral parameter imaging, a digital signal processing technique that examines the frequency content of backscattered ultrasound signals, has been shown to be predictive of increased lethality in certain patients and also to be useful in the in-vivo identification of high-risk melanomas for treatment staging.46–48 The shape, density, orientation, and number of scattering elements in a region influence not only the relative amplitude or brightness of a pixel on B-scan but the frequency content of the signal returned to the transducer.19 The concept of differentiating tissue backscatter in a quantitative manner rather than in simple qualitative descriptions of hypo-, iso-, and hyperechoic variations in gray scale allows for maximum use of information available in the digital ultrasonograms. These techniques can be extended to examining the functional anatomy of the eye as well as disease states other than solid tumors (Fig. 26).

Fig. 26. A gray-scale B-scan of a large collar-button melanoma (top) showing a relatively isoechoic button and base with some differences in internal speckle noted. The companion serial plane spectral parameter image (bottom) shows local differences in the size of ultrasound scatterers within the tumor, with size range increasing from blue to red.

Improved transducer fabrication technology can now produce clinically useful broadband 20 MHz transducers. This allows for biometry of the posterior coats with an accuracy and precision previously unachievable. In addition to resolving retinal layers and choroid typically seen with optical coherence tomograpy, ultrasound at 20 MHz still provides depth of penetration through pigmented lesions and beyond the posterior scleral boundary. Differentiation of underlying retinal disease can thus be improved, even in the presence of media degradation that causes light scattering or even in the case of frank opacities.

Back to Top
REFERENCES

1. Coleman DJ, Silverman RH, Daly SM, Rondeau MJ: Advances in ophthalmic ultrasound. Radiol Clin North Am 36:1073, 1998

2. Coleman DJ, Lizzi FL, Jack RL: Ultrasonography of the eye and orbit. Philadelphia, Lea & Febiger, 1977

3. Coleman DJ, Dallow RL, Smith ME: Immersion ultrasonography: Simultaneous A-scan and B-scan. Int Ophthalmol Clin 19:67, 1979

4. Pavlin CJ, Harasiewicz K, Sherar MD, et al: Clinical use of ultrasound biomicroscopy. Ophthalmology 98:287, 1991

5. Pavlin CJ: Practical application of ultrasound biomicroscopy. Can J Ophthalmol 30:225, 1995

6. Pavlin CJ, Foster FS: Ultrasound biomicroscopy. High-frequency ultrasound imaging of the eye at microscopic resolution. Radiol Clin North Am 36:1047, 1998

7. Foster FS, Pavlin CJ, Harasiewicz KA, et al: Advances in ultrasound biomicroscopy. Ultrasound Med Biol 26:1, 2000

8. Coleman DJ, Franzen LA: Vitreous surgery: Preoperative evaluation and prognostic value of ultrasonic display of vitreous hemorrhage. Arch Ophthalmol 92:375, 1974

9. Kim DY, Reinstein DZ, Silverman RH, et al: Very high frequency ultrasound analysis of a new phakic posterior chamber intraocular lens in situ. Am J Ophthalmol 125:725, 1998

10. Liu W, Wu Q, Huang S, et al: [Application of ultrasound biomicroscopy in diagnosis of anterior segment vitreoretinal disorders]. Yen Ko Hsueh Pao [Eye Science] 13:192, 1997

11. Coleman DJ: Evaluation of ciliary body detachment in hypotony. Retina 15:312, 1995

12. Coleman DJ, Wilcox LM: The choroid: Its function, evaluation, and surgical management. In: Symposium on Medical and Surgical Diseases of the Retina and Vitreous. Transactions of the New Orleans Academy of Ophthalmology, pp 1–24. St. Louis, CV Mosby, 1983

13. Coleman DJ, Smith ME: Ultrasonic criteria for surgically salvageable pre-phthisical eyes. In White D, Lyons EA (eds): Ultrasound in Medicine, pp 297–298. Vol 4. Proceedings of the 22nd Annual Meeting of the American Institute of Ultrasound in Medicine. New York, Plenum Press. 1978

14. Coleman DJ, Jack RL: B-scan ultrasonography in diagnosis and management of retinal detachments. Arch Ophthalmol 90:29, 1973

15. Bronson NR, Fisher YL, Pickering NC: Ophthalmic Contact B-Scan Ultrasonography for the Clinician. Westport, CT, International Publication, 1976

16. Downey DB, Nicolle DA, Levin MF, Fenster A: Three-dimensional ultrasound imaging of the eye. Eye 10:75, 1996

17. Coleman DJ, Daly SW, Atencio A, et al: Ultrasonic evaluation of the vitreous and retina. Semin Ophthalmol 13:210, 1998.

18. Wu G, Silverman RH, Coleman DJ, et al: In vivo thickness of human detached retina by ultrasonic signal processing. Graefes Arch Clin Exp Ophthalmol 227:21, 1989

19. Coleman DJ, Rondeau MJ: Diagnostic imaging of ocular and orbital trauma. In Shingleton BJ, Hersh PS, Kenyon KR (eds): Eye Trauma, pp 25–40. St. Louis, Mosby-Year Book, 1991

20. Clemens S, Kroll P, Rochels R: Ultrasonic findings after treatment of retinal detachment by intravitreal silicone instillation. Am J Ophthalmol 98:369, 1984

21. Jannson F, Sundmark E: Determination of the velocity of ultrasound in ocular tissues at different temperatures. Acta Ophthalmol (Copenh) 39:899, 1961

22. Jannson F, Koch E: Determination of the velocity of ultrasound in human lens and vitreous. Acta Ophthalmol (Copenh) 40:420, 1962

23. Coleman DJ, Lizzi FL, Franzen LA, Abramson DH: Determination of the velocity of ultrasound in cataractous lenses: Ultrasonography in ophthalmology. Bibl Ophthalmol 83:246, 1975

24. Thijssen JM, Mol HJM, Timmer MR: Acoustic parameters of ocular tissues. Ultrasound Med Biol 11:157, 1985

25. Coleman DJ: Echographic and histologic tumor height measurements in uveal melanoma [Letter]. Am J Ophthalmol 101:124, 1986

26. Nicholson DH, Frazier-Byrne S, Chiu MT: [Reply to letter]. Am J Ophthalmol 101:125, 1986

27. Coleman DJ, Rondeau MJ, Silverman RH, et al: Computerized ultrasonic biometry and imaging of intraocular tumors for the monitoring of therapy. Trans Am Ophthalmol Soc 85:49, 1987

28. Ossoinig KC: Standardized echography: Basic principles, clinical applications, and results. Int Ophthalmol Clin 19:127, 1979

29. Ursea R, Coleman DJ, Silverman RH, et al: Correlation of high-frequency ultrasound backscatter with tumor microstructure in iris melanoma. Ophthalmol 105:906, 1998

30. Feleppa EJ, Lizzi FL, Coleman DJ, et al: Diagnostic spectrum analysis in ophthalmology: A physical perspective. Ultrasound Med Biol 12:623, 1986

31. Coleman DJ, Lizzi FL: Computer-processed acoustic spectral analysis of ophthalmic tissues. Trans Am Acad Ophthalmol Otolaryngol 83: 725, 1977

32. Coleman DJ, Lizzi FL: Computerized ultrasonic tissue characterization of ocular tissues. Am J Ophthalmol 96:165, 1983

33. Green RL, Byrne SF: Diagnostic ophthalmic ultrasound. In Ryan SJ (ed): Retina, pp 191–273. Vol 1. St. Louis, CV Mosby, 1989

34. Shammas HJ: Atlas of Ophthalmic Ultrasonography and Biometry, p 68. St. Louis, CV Mosby, 1984

35. Nicholson DH, Frazier-Byrne S, Chiu MT: Echographic and histologic tumor height measurements in uveal melanoma. Am J Ophthalmol 100:454, 1985

36. Coleman DJ, Abramson DH, Jack RL, et al: Ultrasonic diagnosis of tumors of the choroid. Arch Ophthalmol 91:344, 1974

37. Cusumano A, Coleman DJ, Silverman RH, et al: Three-dimensional ultrasound imaging. Clinical applications. Ophthalmology 105:300, 1998

38. Lee W, Kirk J, Comstock C, Romero R: Vasa previa: Prenatal detection by three-dimensional ultrasonography. Ultrasound Obstet Gynecol 16:384, 2000

39. Lee W, Kirk J, Shaheen K, et al: Fetal cleft lip and palate detection by three-dimensional ultrasonography. Ultrasound Obstet Gynecol 16:314, 2000

40. Lee W, McNie B, Chaiworapongsa T, et al: Three-dimensional ultrasonographic presentation of micrognathia. J Ultrasound Med 21:775, 2002

41. Fisher Y, Hanutsaha P, Tong S, et al: Three-dimensional ophthalmic contact B-scan ultrasonography of the posterior segment. Retina 18:251, 1998

42. Atta HR: New applications in ultrasound technology. Br J Ophthalmol 83:1246, 1999

43. Basset O, Gimenez G, Mestas JL, et al: Volume measurement by ultrasonic traverse or sagittal cross-sectional scanning. Ultrasound Med Biol 17:291, 1991

44. Kidd MN, Lyness RW, Patterson CC, et al: Prognostic factors in malignant melanoma of the choroid: A retrospective survey of cases in Northern Ireland between 1965 and 1980. Trans Ophthalmol Soc UK 105:114, 1986

45. Silverman RH, Coleman DJ, Lizzi FL, et al: In-vivo volume determination by ultrasound. Invest Ophthalmol (Suppl) 32:1194, 1991

46. Coleman DJ, Lizzi FL, Silverman RH, et al: A model for acoustic characterization of intraocular tumors. Invest Ophthalmol Vis Sci 26:545, 1985

47. Coleman DJ, Silverman RH, Rondeau MJ, et al: Correlations of acoustic tissue typing of malignant melanoma and histopathologic features as a predictor of death. Am J Ophthalmol 110:380, 1990

48. Silverman RH, Folberg R, Boldt HC, et al: Correlation of ultrasound parameter imaging with microcirculatory patterns in uveal melanomas. Ultrasound Med Biol 23:573, 1997

Back to Top