|
|
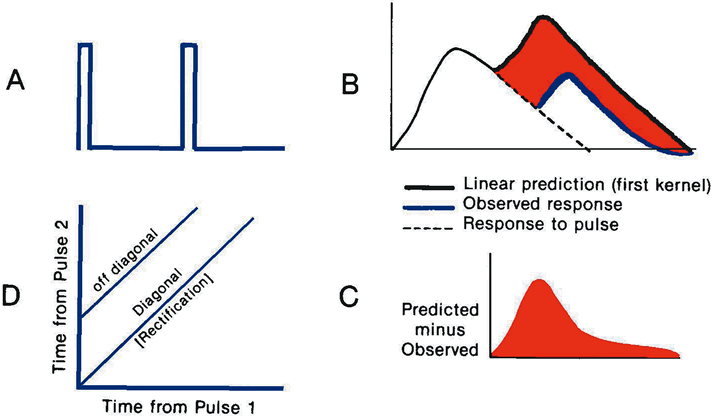
| Fig. 25. First- and second-order kernels. A. Stimulus consisting of two impulses with a fixed separation. Within the context of the multifocal electroretinogram, this might be thought of as two frames of light at a particular location. B. Response to a single pulse, linear prediction of the response to two pulses with the delay illustrated in A (the response of two single flashes added together with the appropriate delay), and the obtained response. C. Nonlinear behavior of the retina, that is, the difference between the linear prediction and the obtained response. D. Second-order kernel. The second-order kernel has three dimensions. Time from pulse 1 is on the abscissa, and time from pulse 2 is on the ordinate. The difference between linear predictions and obtained results (as in C) could be plotted either on the z axis (not displayed) or as contour lines on the xy coordinates. Most multifocal systems present the z axis representation. Off diagonals represent the differences between predicted and obtained responses for a specific difference in time between the two pulses. In C, The first diagonal slice reflects the interaction of two consecutive stimuli separated by the minimum time between stimuli. C presents this slice for the delay illustrated in A and B viewed as a z-axis plot. Rectifiers are physical systems with second-order amplitude–dependent nonlinearities. (Adapted from Odom.136) |