Chapter 66
Laser Devices in Measuring Visual Acuity
DANIEL G. GREEN
Main Menu   Table Of Contents

Search

PRINCIPLE
MEASURING ACUITY
RESULTS
VALIDATING THE TEST
AVAILABILITY OF EQUIPMENT
REFERENCES

Visual acuity, the ability to distinguish fineness of detail, is ordinarily tested by presenting a patient with a series of objects which vary in size or viewing distance. To resolve the test object, the patient's eye must first form an image of the object on the photoreceptors. It is this retinal image which the eye senses. The various optical defects of the ocular media tend to degrade the retinal image. Optical aberrations cause a point source to fail to be brought to focus at a unique point. Scattering causes light to spread diffusely over large areas of the retina.

Fortunately, placing an object to be viewed before the patient is not the only means one has for producing a regular pattern on the retina. A much less commonly used procedure bypasses the effects of the eye's optics. A pattern can be formed using the light from a laser. These patterns are produced on the retina by the interaction of the waves from this highly monochromatic source of light. Regular striped patterns (interference fringes) are formed by the superposition of waves directly on the surface of the retina. Since these are not images in the usual sense, they are not affected by ordinary optical defects. Defects of focus or imperfections in the refracting system of the eye do not blur them. Whether an observer sees these fringes depends only on the ability of his retina to conduct signals from the photoreceptors into the nervous system. Therefore, by using interference fringes it is possible to separate the retinal and neurologic factors from the optical factors limiting visual resolution.

This ability to measure visual acuity independent of the ocular refractive media has been put to good use in the study of the normal visual apparatus(1–3). However, one of the most exciting applications has been in evaluating potential macular function in the presence of opacities of the ocular media (4–9). For example, in the patient who has a cataractous lens and concomitant decrease in vision, the ophthalmologist is faced with the problem of deciding whether the loss in vision can be explained completely by lens changes. The problem may be compounded by past or present evidence of degenerative retinal disease or by the fact that the physician is unable to obtain a satisfactory view of the fundus. The various tests used, eg, discrimination between two lights, projection, and color perception, are, at best, indicators only of gross retinal function and may be of limited value in evaluating potential macular function. In many instances, by using the phenomena of constructive and destructive interference of coherent light, it is possible to produce graded patterns on the retinas of these patients. The fineness of the interference bands that can be seen by the patient provides the physician with a better idea of how much improvement in visual acuity may be offered his patient by cataract surgery.

Back to Top
PRINCIPLE
An essential characteristic of light is that it is a periodic disturbance which propagates through space. The wave motion travels in space with velocity c and wavelength λ. The periodic nature of this wave motion cannot be directly appreciated by the eye, as the number of vibrations per second is approximately 5 × 10¹⁴; however, this is not to say that the wave properties of light cannot be made visible. In 1807, Young performed an experiment which conclusively showed the existence of light waves. The essential idea was to make the wave motion apparent by interacting the wave motions from two sources of light. Fig 1 shows an analogous effect. Two regularly striped patterns of slightly different frequencies are overlapped. When viewed at a distance of several feet, the periodic nature of the separate patterns is no longer visible and they appear uniformly gray. This, however, is not the case where they overlap. Here, regular patterns called Moiré fringes, which are produced by the combination, are apparent even though the regularity of the individual patterns is not. Inspection of the fringes at closer range reveals that what appears as a light band is in fact a position where dark and light portions of the individual patterns are in close register; they are said to be “in-phase.” A dark band results from dark stripes in one pattern overlaying light stripes in the other; the patterns are “out-of-phase” with each other.

Fig 1. Overlapping patterns ( Moiré fringes) which differ slightly in the number of dark bars per unit of distance. If one views these from far enough away, the individual bars will not be resolved and patterns may still be seen in the region of overlap.

The principle of generating low-frequency patterns by having two periodic waves go in-phase and out-of-phase with one another is precisely the means used to produce interference fringes with a laser light source. In this instance, however, the waves occupy different positions in space rather than differing in frequency (Fig 2). Divergent spherical wavefronts are produced by two separate point sources of light. The wavefronts move through space with a velocity c. The circular lines represent the crests of the waves. The separation between two adjacent crests is; λ, the wavelength. It may be helpful to think of the crests as ripples produced on the surface of water. For example, imagine a stone repeatedly dropped into water and a cork floating on water some distance away. The ripples cause the cork to bob. When two stones are simultaneously dropped into the water, each setting up wave motion, what happens depends on the relative phases of the two sets of waves at each point in space. At the intersection lines in Figure 2 the crests overlap. At these points the wave motions from the two sources are in-phase and the effect of superposition is to produce resultant motion of larger amplitude. Bright bands in the interference fringe pattern are produced through the addition of in-phase waves. As one moves along the screen, the relative distance from the two sources changes so that at other points the crests of one wave occupy exactly the same positions as the troughs of the other alone. The result of superposition is then complete extinction of wave motion, causing dark bands (Fig 3). The angle between fringes varies inversely with the separation between the interfering sources. The inverse relationship is not difficult to understand, if one considers the two extreme cases where the sources are either very far apart or very close together. If the sources are far apart, the interfering wavefronts will arrive at the midpoint on the screen from nearly opposite directions. If the waves are in phase, one only has to move a distance of λ/2 they will be out-of-phase.* In other words, the fringe frequency will be exceedingly high. On the other hand, if the two sources are nearly coincident, the waves will be in-phase over great distances on the screen and the fringe frequency will be very low.

Fig 2. Spherical wavefronts from two coherent sources interact to produce interference fringes.

Fig 3. Interference pattern resulting from the interactions of two coherent sources such as those illustrated in Figure 2.


* A wave traveling in the positive x direction can be written


Likewise a wave in the negative x direction is given by


The sum is


Introducing the expression for the cosine of the sum and difference of two angles,


A cosine curve results in which amplitude varies in time. The distance between adjacent points where the fluctuations are maximum is λ/2

ADVANTAGES

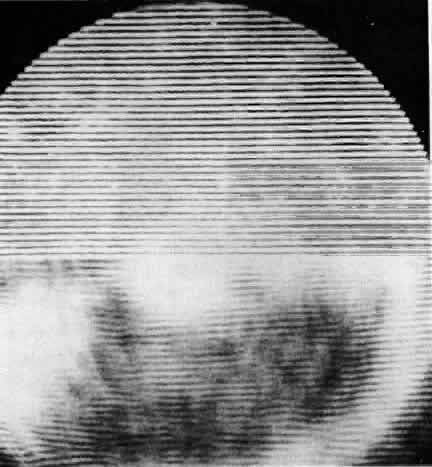
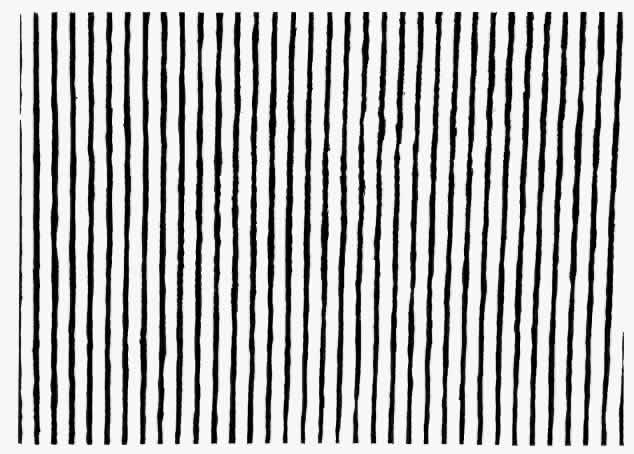
To understand how it is possible to produce fringes directly in a patient's eye, one should substitute the retina for the screen and imagine two sources of monochromatic light imaged directly into the eye so that the dark and light fringes are formed on the retinal surface. These fringes are different from the images formed by the patient's simply viewing a pattern of colored stripes, because when the patient views a striped target, optical aberrations spread light from the bright areas into the dark areas, leading to a loss of contrast in the retinal image. With interference fringes, however, this does not happen. When the waves from the sources are out-of-phase, they cancel, forming a dark area; when they are in-phase, they add, producing a bright area. Consequently, the interference fringes formed by two sources of equal intensity are always of very high contrast, independent of aberrations. It is for this reason that fringes are said to bypass the effects of the eye's dioptrics.

Light scattering might be expected to adversely affect fringes and ordinary images equally, but observation shows this is not the case. If sufficient layers of tissue paper or Mylar drafting sheets are stacked to reduce visual acuity to light perception, interference fringes can still be clearly seen by the normal eye when light is projected through the layers.

Let us consider now the dependency of the retinal pattern on the position of the double sources. In Figure 4, the image-forming properties of the eye are represented by the reduced schematic eye. Two rays parallel to the optic axis are shown. They will be refracted and come to a point focus on the retina. Imagine the sources to be at some arbitrary distance from the observer, with one source on the uppermost ray and the other on the lowermost ray. The rays from the sources parallel to the optic axis are refracted to form angle 0, independent of distance. It is this angle which determines the fineness of the fringe pattern. Thus, for the creme-tropic eye, the fringe frequency is completely independent of the distance from the eye to the double sources. Even if the eye is not emmetropic, when the double sources are imaged near the nodal points, the relationship between the separation of the double images and the fineness of the grating pattern is given by equation 1.

Fig 4. The optics of interference formation in the human eye.


†If two beams of monochromatic light from a coherent source are focused in the plane of the pupil, α, the angular separation of successive maxima in the intensity distribution on the retina can be expressed as follows:
α = λ/a

(1)
where α is in radians, λ is the wavelength of the light in air, and a is the separation between the double sources in air.
Equation 1 is actually an expression for the angular distance between bright fringes, with respect to the point midway between the line connecting the two sources. This angular distance depends only on wavelength and separation between the sources. The distance between fringes on the screen of Figure 2, of course, depends also on the distance, D, from the sources to the screen. If we let x be the distance between maxima in the intensity distribution on the screen, since x is much smaller than D, the angular distance and the linear distance are related by α =x/D
Equation 1 can then be rewritten as

a has a geometric interpretation. It is, for The quantity D small angles, equal to the angle 0 formed by drawing a line from each source to the midpoint on the screen. To understand this, consider the right triangle formed by the midpoint on the screen, the center of the sources, and one of the sources. In this triangle,


For the very small angles the tangent can be approximated by the angle in radians so the following equation is obtained:
= a/D

Back to Top
MEASURING ACUITY
To produce interference fringes on the retina, the output from a low-power laser (usually a helium-neon gas laser, λ = 632.8 nm) is optically divided into two equal parts. Then an ordinary lens is used to project images of the doubled laser source into the eye of the patient. The exact position in the eye, is usually not critical, since for the normal eye the fineness of the pattern on the retina is essentially independent of where the beams come to focus. Angular subtense of the fine detail in the pattern varies directly with the separation between the double sources. Therefore, one can determine the visual acuity by moving the images closer together or farther apart. For a wavelength of λ = 632.8 nm, a 1.1-mm separation between images yields a pattern having stripes that subtend 1 minute of visual angle. This is referred to as a 20/20 (6/6)* target, since one can relate grating acuity and letter acuity by assuming that both targets are equally resolved when the angular subtense of a single bar in the array of parallel alternating dark and light fringes equals the angular width of the strokes in the standard Snellen chart. In some ways, this fractional acuity designation is misleading. The test target is not at 20 feet but is, in fact, formed by interference directly on the retina. Experiment has shown that for patients with clear media, there is sound agreement between test letter and interference fringe determinations of visual acuity (6); this is in itself sufficient to justify its use.
* Metric equivalent given in parentheses after Snellen notation.

Since the interference fringes produced on the retina are essentially independent of the refractive errors of the eye, the patient views the fringes without correction simply by placing his eye before a lens of photographic quality. The lens then forms an image of the double source in the plane of the observer's pupil. Placing his head in the viewing position, the normal observer sees a circular field filled with a system of parallel alternating dark and light stripes (Fig 5). It should be emphasized that in these tests the laser is of very low power. One is using a laser because of its highly monochromatic light and not because of its abilities to produce intense radiation. The power levels on the retina are not greater than those produced by ordinary daylight, so the patient may view the patterns with complete safety.

Fig 5. Interference fringes as they appear normally (top) and with double images focused on a tissue paper placed in front of the eye (bottom). Cataract patients may see continuously changing fringe patterns similar to those patterns shown at bottom. (From Green DG: Testing the vision of cataract patients by means of laser-generated interference fringes. Science 168:1240, 1970.)

The patient's head is restrained by a combination forehead and chin rest. In those patients with opacities of the ocular media, several steps are taken to increase the chances of finding a relatively clear optical pathway for the coherent light. First, the double images are carefully focused into the region of the opacity, ie, either into the cataract or onto the cornea, depending on the nature of the patient's problem. Second, the pupils are dilated with a mydriatic. This allows the light to pass through the periphery when it is less opaque than the central cornea or lens. The peripheral portions of the normal eye usually are of such poor quality that even with careful correction, normal observers have visual acuities as poor as 20/100 (6/30) using the off-axis parts of the refractive apparatus. However, interference fringes generated by passing laser light through these same off-axis areas are not degraded at all. Consequently, after the stimulus intensity is adjusted to correct for the loss in brightness caused by the Stiles-Crawford effect, visual acuity is perfectly normal (10). Third, the light sources are carefully moved in the dilated pupil to seek out the most readily penetrated sites. In assessing whether one area is better than another, it is necessary to have the patient's cooperation.

Prior to testing, photographic representations of the display are shown to the patient, and, where possible, the patient is first “trained” in the task with the better eye. Nonetheless, patients frequently first report seeing only a disordered, moving array of “shooting stars,” “jumble,” or “moving worms.” This disorder is the effect of the opacity on the interference fringes. The motion is induced by the patient's own eye movements, which effectively displace the sources to different areas in the opacity. The spatial structure of this disordered array can give clues as to which sites are least opaque. In the relatively clear areas, the size of the “stars” or “worms” increases. A perfectly clear area is an area in which the “star” increases in size to cover the whole field; this is because the moving “star” is really a fragment of the field in which the light is passing unscattered through opacity. Consequently, the patient is instructed to ignore the disordered and moving patterns and to concentrate his attention on the regular stripes within the bright areas in the field. Patients have varying difficulty in learning to see the fringes, which is not completely correlated with the density of their opacity. If the opacity is unilateral or if there is better vision in the fellow eye, the patient is first shown the fringes through his “good” eye. In addition, photographs of fringes taken through tissue paper are shown to the patient (see Figure 5 ).

The patient is first asked if he can see “stripes.” If the response is affirmative, he then is asked to identify the orientation of the stripes. The acuity is taken to be the finest stripe pattern that the patient can perceive. On occasion, when the random disorder produced by the opacity is too confusing or the visual task is not correctly understood, the patient reports seeing stripes but is unable to identify their orientation correctly. With more patience and longer tutoring, these patients might learn to see the patterns. However, time limitations and patient fatigue usually require that the test be terminated after, at most, 30 minutes. Finally, other patients see no pattern whatsoever since their opacities are too dense to be penetrated, even by the laser acuity technique.

Back to Top
RESULTS
Figure 6 provides a summary comparison of the results achieved by standard letter and interference measurements of acuity in both cataract and corneal patients. Each box indicates one or more patients tested as indicated. If both types of measurement were equally successful, the boxes would fall along the diagonal; the way they actually fall indicates the superiority of the laser acuity technique. For example, the uppermost dark box with a 4 that falls below the diagonal indicates that 4 cataract patients who had a best corrected acuity of 20/50 (6/15) had an acuity for laser fringes of 20/25 (6/7.5).

Fig 6. Comparison of preoperative laser and letter acuity in patients with cataract (dark boxes) and corneal opacities (light boxes). (From Green DG, Cohen MM: Laser interferometry in the evaluation of potential macular function in the presence of opacities in the ocular media. Trans Am Acad Ophthalmol Otolaryngol 75:629, 1971 and Gstalder RJ, Green DG: Laser interferometry in corneal opacification. Arch Ophthalmol 87:269, 1972.)

The laser provides a method for more effectively using the light transmission remaining in the opaque eye to form patterns, the detail of which is finer than that obtainable by other means. In patients with completely opaque media the laser interferometer is of little value. It has been our experience that nearly all the patients who have preoperative visual acuity of 20/400 (6/120) or better are able to see the fringes. Even in those patients in whom vision by ordinary means is reduced to finger counting or hand movements, 70% to 80% are able to detect interference fringes. One of every 4 cataract patients and 2 of 3 patients with corneal opacities who clinically appear to be able just to perceive light will see the fringes.

Back to Top
VALIDATING THE TEST
The predictive value of the interference visual acuity test can be assessed by comparing patients' postoperative acuity with preoperative acuity measured by interference fringe. In Figure 7 the postoperative letter and preoperative interference acuity measurements tend to fall along the diagonal or above it. The boxes above the diagonal indicate patients whose vision was better than predicted. There is a good correlation between predicted and achieved visual acuity for patients who learn to see the fringes. The results for those patients who fail to see the fringes seem to be random: some have good vision after surgery and others do not.

Fig 7. Evaluation of predictive ability of laser acuity determination. Comparison of preoperative and postoperative letter acuity in patients with cataract (dark boxes) and corneal opacities (light boxes). Corneal patients with active graft rejection are not included. (From Green DG, Cohen MM: Laser interferometry in the evaluation of potential macular function in the presence of opacities in the ocular media. Trans Am Acad Ophthalmol Otolaryngol 75:629, 1971 and Gstalder RJ, Green DG: Laser interferometry in corneal opacification. Arch Ophthalmol 87: 269, 1972.)

Consequently, inability to see the fringe pattern, especially in severely opacified eyes, does not necessarily indicate lack of potential for good vision. However, the ability to see fine interference fringes should be considered a favorable sign. For patients who would be operated on only if indications of existing potential visual acuity can be obtained, testing with laser interferometers is invaluable. It succeeds in evaluating macular function in many instances in which the usual methods of testing vision potential, eg, two-light discrimination, projection, color discrimination, electroretinography and ultrasonography, can provide only crude estimates of gross retinal function.

Back to Top
AVAILABILITY OF EQUIPMENT
Although the apparatus required is no more than an optical bench, patient chair, and a laser, this is probably of little comfort to the clinician who is anxious to witness a demonstration or to try this technique on his patients. At this time there is a commercially available instrument. While I have not personally had an opportunity to inspect them, two instruments are being sold in this country. One, developed in Japan, is being marketed by Acuity Systems of Reston, Virginia (11); the other was developed in Germany (9) and is marketed by Coburn Optical Industries, distributors of Rodenstock ophthalmic instruments. It is to be hoped that these instruments will prove to be sufficiently well designed and engineered that the clinician can use them.
Back to Top
REFERENCES

1. Campbell FW, Green DG: Optical and retinal factors affecting visual resolution. J Physiol 187:437, 1966

2. Green DG: Regional variations in the visual acuity for interference fringes on the retina. J Physiol 207: 351, 1970

3. Freeman RD, Mitchell DE, Millodot M: A neural effect of partial visual deprivation in humans. Science 175:1384, 1972

4. Goldmann H: Examination of the fundus of the cataractous eye. Am J Ophthalmol 73:309, 1972

5. Green DG: Testing the vision of cataract patients by means of laser-generated interference fringes. Science 168:1240, 1970

6. Green DG, Cohen MM: Laser interferometry in the evaluation of potential macular function in the presence of opacities in the ocular media. Trans Am Acad Ophthalmol Otolaryngol 75:629, 1971

7. Gstalder R J, Green DG: Laser interferometry in corneal opacification. Arch Ophthalmol 87:269, 1972

8. Cohen MM: Laser interferometry: Evaluation of potential visual acuity in the presence of cataracts. Ann Ophthalmol 8: 845, 1976

9. Rassow B, Wolf D: Die Messung der ‘retinalen Sehschärfe’ mit dem Laserinterferenzgerät als klinische Routinemethods. Adv Ophthalmol 34:116, 1977

10. Green DG: Visual resolution when light enters the eye through different parts of the pupil. J Physiol 190:583, 1967

11. Enoch JM, Bedell HE, Kaufman HE: Interferometric visual acuity testing in anterior segment disease. Arch Ophthalmol 97: 1916, 1979

Back to Top