Chapter 35
Glare and Contrast Sensitivity Testing
DAVID MILLER
Main Menu   Table Of Contents

Search

CONCEPTS OF CONTRAST SENSITIVITY AND GLARE
CLINICAL CONDITIONS AFFECTING GLARE AND CONTRAST SENSITIVITY
ELEMENTS OF TESTING
UNITS OF MEASUREMENT
REFERENCES

Visual acuity testing is relatively inexpensive, takes little time to perform, and describes visual function with a simple ratio, that is, 20/40. Best of all, for over 125 years it has given us a useful endpoint in correcting the patient's refractive error. Yet, contrast sensitivity testing, a time-consuming test, described by a graph rather than a simple notation, has recently become a popular clinical test. Why?

First of all, it describes a number of subtle levels of vision not covered by the visual acuity test. Thus it is more accurate than Snellen visual acuity in documenting the progress of cataracts, corneal edema, neuro-ophthalmic diseases, and retinal diseases. Although the above has been known for a long time, contrast sensitivity has been used by very few clinicians until recently. The test has achieved enhanced popularity because of the patient with a cataract. Because of modern technology, the patient with a cataract grew to expect a safer surgical outcome and a better visual outcome than ever before. As patient expectations rose, tests were needed to document more subtle decreases in vision in the earliest stages of cataract. For example, the patient's complaints of objects appearing faded or objects being more difficult to see in bright light is not accurately described by the Snellen visual acuity score. However, contrast sensitivity tests and glare sensitivity tests do quantitate these complaints. In fact, one may look at contrast sensitivity and glare disability testing as being quite close to the processes of the eye in the act of seeing. The targets are still letters, circles with gaps, and black and white grid patterns to be sure, but many of the subtleties of the real visual world are introduced with these patterns. As we enter this new arena of testing, the following two guiding principles should keep the reader from getting lost. All contrast sensitivity tests can be thought of as being made up of a number of different-size lines of targets presented in different shades of gray. Second, the addition of a glaring light adjacent or surrounding the visual target markedly decreases the contrast of the target if the patient has a cataract, corneal edema, or any other type of light-scattering lesion.

Back to Top
CONCEPTS OF CONTRAST SENSITIVITY AND GLARE

THE CONCEPT OF SPATIAL FREQUENCY

The visual image can be thought of as being made up of pixels (picture elements) much like a computer screen. The finer the pixel size, the better the resolution. For example, look at the nude in Figure 1. Note that the finer the pixel system, the more information is presented. For a black-and-white picture each pixel also contains shades of gray. Thus the pixel system can present different levels of contrast. If the retina performs as a pixel system, how might its information be transmitted to the brain? One popular theory suggests that it is as if a number of different wire services record the retinal picture and then file their story back to the brain. One wire service only has a resolution equivalent to 20/200 and thus only has a large pixel system. You might say that this wire service can only see the big picture. The next wire service has a higher resolution system and reports more detail, with smaller pixels. Still another wire service reports on even finer details and has a 20/20 size pixel. With such a series of wire services, the transmission system must be compatible with a memory filing system, each wire service memo ultimately funneled into memory. In such a system, memory can fill in unreported details when the retinal image is not clear. For example, when life scenes are blurry from fog, snow, rain, or dust, only the large pixel system would carry information. The memory filing system would then be able to add details not actually seen. Such a system of a series of vision channels has another advantage. Even if a few of the nerve channels have been damaged or diseased, some information about every scene has a chance of being registered. Furthermore, if there is a disease or injury to an optical element of the eye (cornea or lens) a fuzzy picture devoid of details gets through the larger pixel channel, and the memory file improves the overall perception of the image. It has even been suggested that in young patients with eye disease, a contrast enhancement mechanism comes into play that can push up sensitivity in the channels that are working.1

Fig. 1. A nude painting reconstructed from pixels of different sizes. As the pixel size gets smaller, more details of the face and body can be seen. (Frisby JP: Seeing: Illusion, Brain and Mind, p 12. New York, Oxford University Press, 1980)

Sine Waves

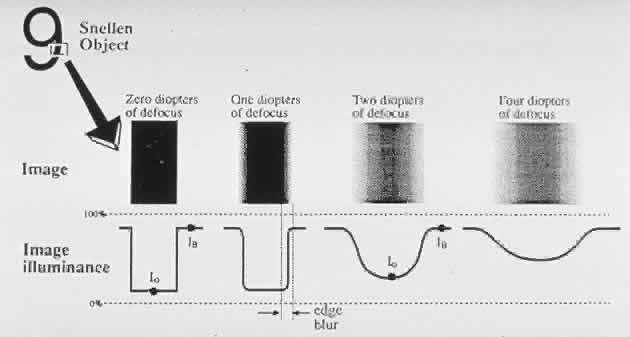
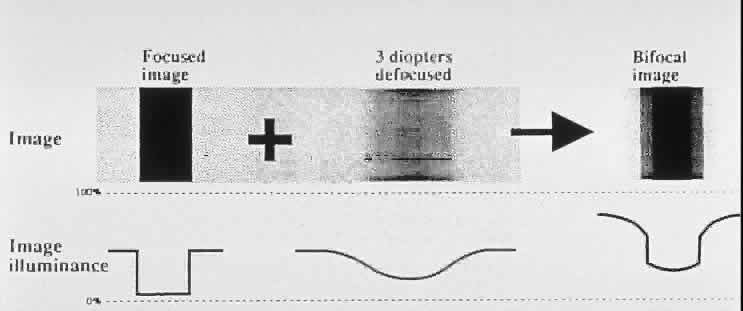
The letter E on the Snellen chart can be considered to be made up of dark horizontal bars against a white background. The spacing between the bars can be described in terms of angular subtense. The visual psychologist would describe the target as a pattern of square waves with a certain spatial frequency (i.e., the 20/20 letter has a spatial frequency of 30 cycles per degree; Fig. 2). Thus spatial frequency refers to the number of black-and-white bars (1 cycle) within a degree of angular subtense. However in optics, very few images can be described as perfect square waves with perfectly sharp edges. Diffraction, chromatic aberration, spherical aberration, and oblique astigmatism tend to make most edges fuzzy. Therefore, if one plotted the light intensity across the retinal image of a black bar against a white background, one would get a modified sine wave pattern. Sine wave patterns have great appeal to the mathematician because they can be combined to produce any desired pattern. In Figure 3 a combination of different sine waves are shown adding up to produce a new sine wave pattern. This trick of being able to break down any alternating pattern (be it an electrocardiogram or a trumpet sound wave) into a unique sum of sine waves is known as a Fourier transformation. A Fourier transformation is based on the assumption that any wave may be described as a sum of sine waves that has different spatial frequencies, amplitudes, and phases.

Fig. 2. Diagram of sine wave and square wave gratings. (Mainster M: Contemporary optics and pathology. Surv Ophthalmol 23: 135, 1978)

Fig. 3. Summation of sine waves can give a square wave pattern. (Bennet AG, Rabbetts RB: Clinical Visual Optics. 2nd ed, p 30. London, Butterworth, 1989)

The visual scientist also feels that the visual system operates by breaking down observed patterns and scenes into sine waves of different frequencies. Present theory suggests that a few thousand patches of the visual image are analyzed into about six different spatial frequencies at around 20 different orientations.2 The brain then adds up all the information to produce the mental impression of a complete picture. Fourier transformations are the way that the visual system encodes and transmits and reconstructs retinal images. Experimental evidence in cats shows that the different channels that exist in the retina, lateral geniculate body, and cortex selectively carry appropriate information related to different spatial frequencies.3 It has also been shown that all channels respond to contrast with the cortex actually showing a linear relationship between the amplitude of the neuronal discharge and the logarithm of the contrast of the sinusoidal grating.

Contrast Sensitivity of Different Spatial Frequencies

One might intuitively think that an optimal visual system would have similar contrast sensitivity thresholds for all the different spatial frequencies. Interestingly, all good optical systems have a better contrast sensitivity for lower spatial frequencies. The contrast sensitivity gradually gets poorer for higher spatial frequencies as diffraction and other aberrations blur finer details. As opposed to a typical optical system, in Figure 4 we note that the retina-brain processing system labeled RTF enhances spatial frequencies from 2 to 6 cycles per degree. Receptive fields, on-off systems, and lateral inhibition are the well-known physiologic mechanisms that influence the different spatial frequency channels and are probably responsible for such enhancement.4–6 Why might middle to larger targets, that is, mid to low-spatial frequency targets, have an enhanced contrast sensitivity threshold? For example, the peak frequency of a normal subject's contrast sensitivity function is about 2 to 4 cycles per degree (cpd). From a survival standpoint some spatial frequencies might be more important than others. The quotation from the American Revolutionary War, “Don't fire 'til you see the whites of their eyes,” brings to mind a crucial facial feature, that is, the detection of eye movements. Given a palpebral width of about 24 mm and a central dark iris area of 12 mm in diameter, the white space from canthus to limbus is about 6 mm. Thus the eye itself can be likened to a thick dark bar straddled by two thinner white spaces framed by the darker skin. A person with a visual acuity of 20/200 would be able to see another person make a large eye movement at about 2 m away. Such clues might help to determine whether that person is friend or foe. Seeing facial expression at a few meters away also would be equivalent to seeing a target of about 3 cpd. Finally, a standing adult Figure ALMOST 100 yards away would also present a target equivalent to about 3 cpd. Being able to discern the presence of such a figure, particularly in rain or mild fog, could also have important survival value. Of course, the above examples merely suggest a possible reason for the unique shape of the contrast sensitivity function in which the spatial frequencies of 2 to 4 cpd are favored.

Fig. 4. The normal human contrast sensitivity function (CSTF) is the sum of the contrast sensitivity of the purely optical contribution (MTF), and the neuroretinal enhancement system (RTF). (Mainster M: Contemporary optics and ocular pathology. Surv Ophthalmol 23:135, 1978)

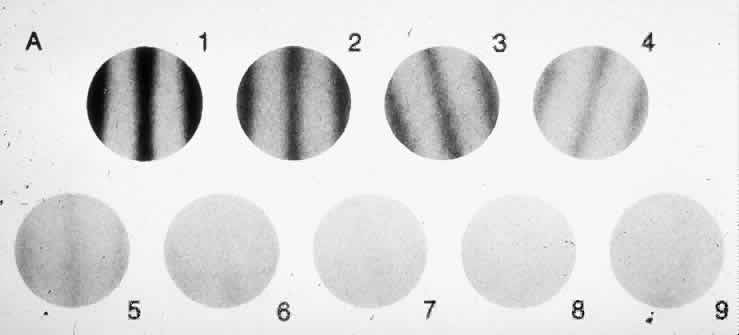
Normal variations are to be found in the human contrast sensitivity function. In Figure 5 contrast sensitivity is seen to decrease with age. Two factors appear to be responsible for the aging changes. First, the normal crystalline lens scatters more light with increasing age, thus blurring the edges of targets and degrading the contrast.7 Second, the retina-brain processing system itself loses its ability to enhance contrast with increasing age.8 The contrast sensitivity function also decreases substantially as the illumination in the scotopic range decreases.9 Finally, it should be noted that the contrast sensitivity impairment is a very sensitive indicator of cerebral or retinal disturbance due to high altitude hypoxia. Studies done on mountain climbers at elevations of over 17,000 feet in the Himalayan mountains demonstrate that a decrease of the contrast sensitivity was seen consistently in all subjects the day they arrived at base camp. The impairment was for the most part evident in the medial spatial frequencies. Contrast sensitivities normalized after 36 hours at the base camp.10

Fig. 5. Contrast sensitivity as a function of age. (Owsly C, Sekuler R, Siemsen D: Contrast sensitivity throughout adulthood. Vis Res 23:689, 1983)

GLARE, TISSUE LIGHT SCATTERING, AND CONTRAST SENSITIVITY

In the body, collagen fibrils, interstitial fluids, and cellular elements all combine to make tendons white, dura opaque, and the epidermis translucent. Yet, combinations of the same ingredients are woven together in the eye to produce transparent corneas, lenses, and vitreous.11 Theoretically, these structures, particularly the corneas, should not be transparent. In the cornea clear, delicate collagen fibrils of index refraction 1.47 (close to that of glass) are surrounded by a mucopolysaccharide matrix with an index of refraction of about 1.33 (similar to water) according to research conducted by Maurice12 and Benedek.13 These two researchers found that the key to transparency is in the arrangement of the elements. Transparency can result from mixing two transparent elements of different refractive indices if the spacing between the elements is less than the distance of half a wavelength of light, and if there is a recognizable pattern or predictable relationship between the fibrils. A similar phenomenon can be seen in Figure 6 in which the diver has been made invisible by a blanket of air bubbles in the water. When a transparent structure loses its clarity, the physicist describes it as a light scatterer rather than a light transmitter. This concept is foreign to the clinician whose textbooks talk about opaque lenses and corneas. The word “opaqueness” conjures up the image of a cement wall that stops light. Of all the experiments demonstrating that most cataracts scatter light rather than stop light, the most graphic involves the relatively new science of holography. If it is true that a cataract splashes or scatters oncoming light so that a poor image is focused on the retina, then it should be theoretically possible to collect all the scattered light with a special optical element and recreate a sharp image. The essence of such an optical element, one that would take the scattered light of the cataract and rescatter it so that a proper image could be formed, would be a special inverse hologram of the cataract itself. Figure 7 shows how such a filter would work. Miller and colleagues14 were able to demonstrate how an extracted cataract (the patient's visual acuity was worse than 20/200) would be made relatively transparent by registering a special inverse hologram of that specific cataract in front of the cataract.

Fig. 6. The diver is almost invisible. enshrouded by a blanket of bubbles. (Nadler MP, Miller D. Nadler DJ (eds): Glare and Contrast Testing for Clinicians. New York, Springer-Verlag,1990)

Fig. 7. Method in which the inverse conjugate hologram of a cataract and the cataract itself could recreate a clear image. (Miller D, Benedek G: lntraocular Light Scattering. Springfield, IL. Charles C Thomas, 1973)

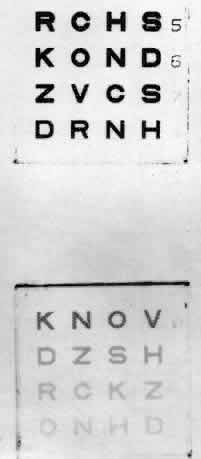
To follow the progress of conditions such as cataracts or corneal edema, a measure of tissue transparency or tissue backscattering is useful. Although it is possible to quantitate the amount of light scattered by various ocular tissues using photoelectric devices, a subjective discrimination system is needed to evaluate patient complaints. The Snellen visual acuity test was the traditional index, but it was not sensitive enough. In Figure 8, LeClaire and co-workers15 illustrated that many patients with cataracts showed good visual acuity but had poor contrast sensitivity in the face of a glare source. In fact, this should not come as a surprise, since the essence of vision is the discrimination of the light intensity of one object as opposed to another, often with a natural glare source present. Thus, a plane is seen against the sky because the retinal image of the plane does not stimulate the photoreceptors to the same degree that the image of the sky does. Terms like “contrast luminance” and “intensity discrimination” are used to describe differences in brightness between an object and its background.

Fig. 8. A study of visual versus glare sensitivity in 144 cataract patients showed that many with 20/40 or better visual acuity had low glare scores. (LeClaire J, Nadler MP, Weiss Set al: A new glare tester for clinical testing. Arch Ophthalmol 100: 153, 1982)

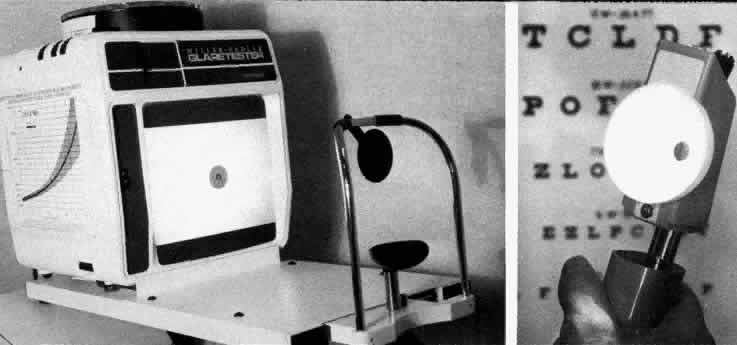
How then can ocular light scattering, glare and contrast sensitivity, be linked together to give the clinician a useful index? The stage had been set to solve this puzzle by an industrial scientist named Hollidy. In 1926, he developed the concept of glare and glare testing to measure the degrading effect of stray light.16 In the 1960s Wolfe, a visual physiologist working in Boston, realized that glare testing could be a useful way to describe the increase in light scattering seen in different clinical conditions.17,18 How does increased light scattering produce a decrease in the contrast of the retinal image in the presence of a glare source? Figure 9 shows how corneal edema splashes light from a naked light bulb onto the foveal image, reducing the contrast of the image of the target. Figure 10 illustrates the way that a patient with a cataract or corneal edema would see a scene in the presence of a glare source. In the mid-1970s, Nadler observed that many of his cataract patients complained of annoying glare. His observations rekindled interest in glare testing and led to the first clinical glare tester (the Miller-Nadler glare tester).

Fig. 9. Corneal edema scatters the light from the peripheral light source onto the fovea. decreasing the contrast of the foveal image. (Miller D. Benedek GB: lntraocular Light Scattering, p 38. Springfield, IL, Charles C Thomas, 1973)

Fig. 10. Photograph of the way the scene would appear to a normal patient (top) and a patient with corneal edema (bottom) in the face Of glare. (Miller D, Benedek GB: lntraocular Light Scattering, p 38. Springfield, IL, Charles C Thomas, 1973)

Back to Top
CLINICAL CONDITIONS AFFECTING GLARE AND CONTRAST SENSITIVITY

OPTICAL CONDITIONS

This section describes how contact lenses, cataracts, opacified posterior capsules, displaced intraocular lenses (IOLs), and multifocal IOLs affect glare sensitivity and contrast. With the exception of IOLs, these conditions primarily diminish contrast sensitivity because of increased light scattering.

Corneal Conditions

CORNEAL EDEMA. Studies tracing the progression of corneal decompensation19 have shown that the stroma increases in thickness before the epithelium changes. The stroma may increase in thickness by up to 30% before the epithelium becomes edematous. Studies have shown that an increase in stromal thickness above 30% need not influence Snellen visual acuity results if there is no epithelial edema.20 Unlike Snellen visual acuity, both contrast sensitivity and glare sensitivity are compromised as soon as the stroma thickens. Mild edema affects only the middle and high frequencies, sparing the low frequencies of a contrast sensitivity test. With further edema, the sparing of the low frequencies disappears and contrast sensitivity is decreased throughout the spatial frequency spectrum.21 Glare sensitivity measurements also detect early epithelial edema. A mildly edematous epithelium is roughly equivalent to an increase of 10% in stromal thickness, whereas moderate to marked epithelial edema has a profound effect on glare and contrast sensitivity.

CONTACT LENS USAGE. The wearing of contact lenses may reduce contrast sensitivity in a number of subtle ways. Patients with significant corneal astigmatism wearing thin soft-contact lenses experience blur that affects their contrast sensitivity. Aging of the plastic material itself or surface-de-posit accumulations can affect soft lens hydration and ultimately influence acuity, glare, and contrast sensitivity. Most important, contact lens-induced epithelial edema produces increased glare disability and reduced contrast sensitivity.21

KERATOCONUS. Patients with keratoconus demonstrate attenuation of contrast sensitivity with relative sparing of low spatial frequencies despite normal Snellen visual acuity. However, once scarring develops in the keratoconic cornea, all frequencies become attenuated. There is also an acute increase in glare sensitivity as soon as scarring develops. Thus, contrast sensitivity testing at a number of spatial frequencies with or without a glare source may be an excellent way of following the progression of keratoconus.21

NEPHROTIC CYSTINOSIS. In a study of patients with infantile-onset cystinosis, contrast sensitivities were reduced at all frequencies although the loss at high frequencies was the greatest. Ten of 12 subjects showed glare disability compared with a control population.22

PENETRATING KERATOPLASTY. Contrast sensitivity or glare testing may also be useful in detecting the earliest signs of graft rejection. In such cases, the earliest corneal damage is corneal edema. Although visual acuity may remain normal, contrast and glare performance starts to slip. As the edema progresses to involve the epithelium, the degradation of these visual functions is accentuated. Similarly, reversal of graft rejection may be followed by an improvement in the contrast sensitivity function.21

REFRACTIVE SURGERY. Some patients who have undergone radial keratotomy have been reported to experience increased glare sensitivity.23–25 The extent of the problem and the number of patients complaining of heightened glare sensitivity varies from study to study and depends on the time that elapsed since the surgery as well as the method by which the glare was assessed. Nevertheless, it can be concluded that glare is a postoperative complication of radial keratotomy and that the proportion of patients who complain about glare and the severity of the problem decreases as the time after surgery increases.

Harper and Halliday reported on four unilaterally aphakic patients, and found significant contrast sensitivity losses in the eyes with epikeratoplasty when compared with the normal fellow eye.26

Cataracts and Opacified Posterior Capsules

Figure 9 demonstrates the way that an edematous cornea or cataract scatters stray light onto the fovea and degrades contrast sensitivity as well as heightening glare disability. Thus, measurements of contrast sensitivity are usually better correlated with patient complaints than a visual acuity measurement. The addition of a glare source to a contrast sensitivity test causes a dramatic decrease in the contrast function as seen in Figure 11. Of the various cataract types, the posterior subcapsular cataract degrades the glare and contrast function the most. It should be noted that the presence of a glare light diminishes both visual acuity and contrast sensitivity in cataract patients. In Figure 12 we see that in the presence of a glare light the contrast sensitivity function gradually diminishes as the simulated cataract increases in severity, whereas the visual acuity function holds steady until an 80% simulated cataract produces a dramatic drop in visual acuity.

Fig. 11. A typical contrast sensitivity function plotted for a normal subject (N) and a cataract subject (C). The test was repeated (dotted lines) with a superimposed glare source. (Sjostrand J, Abrahamson M, Hard AL: Glare disability as a cause of deterioration of vision in cataract patients. Acta Ophthalmol (Copenh) 65: 103. 1987)

Fig. 12. Results of normal subjects looking through progressive light scattering filters (simulated cataracts) at a conventional visual acuity chart (solid circles) and a contrast sensitivity target (open circles). A glare source was placed next to the targets in all cases. Note that while contrast sensitivity gradually decreases as the simulated cataract progresses, visual acuity stays almost constant and then drops steeply when an 80% simulated cataract is reached. (LeClaire J, Nadler MP. Weiss S et al: A new glare tester for clinical testing. Arch Ophthalmol 100:153, 1982; and Miller D. Benedek GB: lntraocular Light Scattering, p 95. Springfield, IL, Charles C Thomas. 1973)

Progressive opacification of the posterior capsule following an extracapsular cataract extraction produces a progressive increase in glare disability.27 A neodymium: yttrium-aluminum-garnet (Nd:YAG) laser capsulotomy in such cases improves the visual function. The improvement of contrast and glare sensitivity after Nd: YAG laser treatment depends on the ratio of the area of the clear opening to the area of the remaining opaque capsule. Thus, a photopic pupil of 4 mm would require a 4-mm capsulotomy for best results in daylight. However, if the pupil dilates to 6 mm at night, an oncoming headlight would induce an annoying glare unless the capsulotomy were enlarged to 6 mm in diameter. Thus the smallest capsulotomy is not necessarily the best from an optical point of view.

lntraocular Lenses

DISLOCATED IOLS. In IOL decentration the light rays entering the eye that create a sharp image on the retina are focused by the cornea and the IOL. However, the light rays coming through the aphakic portion of the pupil are focused only by the cornea and thus degrade the image on the retina by decreasing contrast. The results of an optical bench model of IOL decentration in which the percent contrast was plotted against the area of aphakic space was performed by Kumar and collaborators28 and is seen in Figure 13. The percent contrast was found to decrease in a linear fashion as the percent aphakic space increased. Note that the size of the aphakic space becomes accentuated in enlarged or pharmacologically dilated pupils.

Fig. 13. Graph of percent aphakic space versus percent contrast of the simulated material image. Note the linear relationship. (Kumar S, Miller D: Effect of lntraocular lens decentration on retinal image contrast. J Cataract Refract Surg 16:712, 1990)

MULTIFOCAL IOLS. By and large the level of satisfaction of patients with multifocal IOLs has been high.29 Although the near and distant visual acuity of these patients is good, the contrast sensitivity function in some of these patients is poor. Optical modeling30 and optical bench testing31 have shown that these lenses degrade image contrast, which is related to both pupil size and image distance. Pupil size influences the contrast in two ways. For the concentric configured bifocal design, the pupil size determines the percent of distance and near optical power used to produce the image. Second, Smaller pupils add an element of greater depth of focus, which enhances contrast by Sharpening out-of-focus images. Figure 14 shows the relationship of pupil size to contrast using a concentric bifocal IOL model. These studies support the idea that a multifocal implant, which superimposes a blurred image (from one portion on the IOL) on a sharp image (from the other portion of the implant), degrades contrast.

Fig. 14. Results of experiments in which the contrast of the retinal image was determined for different pupil sizes, in a schematic eye fixed with a simulated monofocal and concentric bifocal lntraocular lens. Note the steep drop in contrast for a near object as the pupil enlarges. (Atebara N: lmage Contrast and the Optics of Multifocal lntraocular Lenses. Senior thesis. Harvard Medical School. 1991)

Yet these in vitro experiments differ from the clinical results, in which most patients show excellent levels of visual function. Atebara32 has attempted to explain this dichotomy. In Figure 15, he illustrates the spread of light as an image is progressively defocused. Note that the dual effect of both edge blur and decline of focus in the middle of the bar provides a flat curve when luminance is plotted across the image. In Figure 16 an out-of-focus image is superimposed on a sharply focused image (the effect of a bifocal implant). Unlike the totally defocused image in Figure 15 which has lost all edge contrast, the curve retains its sharpness even though contrast has dropped. This preservation of edge sharpness in the face of lowered contrast could well account for the good visual function in patients with bifocal implants. It is suggested that these lenses allow high Snellen visual acuities even in the face of lowered contrast because edge sharpness is preserved. We know that the visual cortex can sharpen the impression of an edge by an enhancement mechanism. Perhaps a diminution of such an enhancement system could explain the complaints of the small number of patients dissatisfied with their bifocal implants.

Fig. 15. A graphic representation of what happens to a progressively defocused image. A plot of the light intensity across the image shows a flattening at the edge as the amount of defocus increases. (Atebara N: Image Contrast and the Optics of Multifocal lntraocular Lenses. Senior thesis. Harvard Medical School, 1991)

Fig. 16. A graphic representation of what happens to an image of an object in focus superimposed on an out-of-focus image. This would represent the type of image produced by a bifocal lntraocular lens. Unlike the defocused curve which has lost all edge contrast. these images retain edge sharpness through contrast declines. (Atebara N: Image Contrast and the Optics of Multifocal lntraocular Lenses. Senior thesis, Harvard Medical School, 1991)

Retinal Conditions

DIABETIC RETINOPATHY. Studies33 have shown decreases in contrast function in up to 60% of patients with background retinopathy and in nearly 38% of diabetic patients without retinopathy. One might suspect that this latter group may have had a mild form of macular thickening. Interestingly, some diabetic patients have shown a temporary reduction of contrast sensitivity after panretinal photocoagulation treatment.

MACULAR DEGENERATION. Although the status and progress of advanced age-related macular degeneration can be followed by visual acuity measurements, such testing cannot follow the progress of macular drusen. Kleiner and associates34 were able to show that such patients demonstrated a decrease in contrast sensitivity performance with Regan charts (visual acuity charts presented in different contrasts) as well as with sine wave grating charts. Their study further showed a correlation between drusen severity and degree of contrast sensitivity loss.

In cases of advanced macular disease, it has been found35 that contrast reserve correlated well with reading speed using an optical device such as a video magnification system. Contrast reserve is defined as the ratio of the contrast of the specific reading task (newsprint would be 75% contrast) divided by the patient's peak contrast (usually for spatial frequencies of from 4 to 8 cpd). Thus if a patient had a peak contrast threshold (reciprocal of contrast sensitivity) of 25%, the contrast reserve would be 3 for reading newsprint. These investigators found that a contrast reserve of 3 would allow a reading speed of 20 to 30 words per minute, whereas a contrast reserve of 7 would allow a reading speed of 80 to 100 words per minute and a reserve of 10 would allow a speed of 150 to 200 words per minute. For reference it should be noted that normals would have a contrast reserve of 50.

Optic Nerve and Visual Pathways

Mild forms of a number of diseases affecting the optic nerve may allow the patient to read the 20/20 line yet demonstrate a diminished contrast sensitivity function. A review by Lorance and investigators36 shows that papilledema, optic nerve drusen, early ethambutol and acrylamide toxic optic neuropathy, and pituitary tumors may all degrade contrast sensitivity while leaving visual acuity undisturbed. These reviews also show that contrast sensitivity testing is an accurate method of following the progress of optic neuritis. Interestingly, Fleishman and co-workers37 have shown that in 35 eyes that had recovered from optic neuritis and achieved visual acuities of at least 20/30, 72% still retained some loss of contrast sensitivity. This finding correlated better than any other test with the subjective visual complaints of these patients.

In the field of glaucoma testing, it is known that close to half of the optic nerve fibers may be lost before a scotoma may be detected by routine perimetric testing. Thus there is a need for a more sensitive method of diagnosing early optic nerve disease due to glaucoma. After performing many studies on glaucoma patients, Arden was forced to conclude that his contrast sensitivity plates lacked selectivity in distinguishing diminished visual function due to glaucoma from that of other common conditions of the elderly, namely, cataracts and miosis from prolonged miotic usage.38

Back to Top
ELEMENTS OF TESTING

TARGET

Illumination

LEVEL OF ILLUMINATION. The most important consideration in contrast sensitivity testing is to relate the test to the many real-life tasks that face the patient. For example, the test should have realistic levels of illumination. It is known that normal daylight illumination or well-illuminated indoor settings vary from about 30 to 300 candelas/ m2. These levels are consistent with the recommendations of the International Council of Ophthalmology, which suggests that the display brightness for contrast tests should be 85 candelas/ m2and the British standard that recommends 150 candelas/m2. All the devices currently available to test contrast sensitivity have a target brightness within this range.

CALIBRATION OF ILLUMINATION. Since some bulbs dim as they age, many bulb-illuminated devices feature a system of internal calibration as will video display devices. How important is precise control of illumination? As noted earlier, normal daylight luminance ranges from 30 to 300 candelas/m2. At these levels of illumination the normal contrast threshold varies between 0.5% to 2%.39 This means that for most daylight situations, there is a narrow range of contrast threshold. However, contrast threshold does change dramatically at different levels of dim illumination, that is, below I candela/m2. Such illumination would naturally occur between twilight and nighttime. Consequently, clinical tests in which we want to see the patient's contrast threshold under daylight conditions or well-lit indoor environs probably do not need precise control illumination levels. On the other hand, very precise contrast threshold measurements done under dim illumination with young healthy subjects would be highly dependent on precise levels of target illumination.

Target Details

TYPE OF TARGET. At present the targets for contrast testing are either letter targets or grid targets (Figs. 17 and 18). The grid targets are made of alternating black-and-white lines whose intensity of illumination varies as a sine wave. As noted earlier, Campbell's work4–6 suggested that the visual system decoded all scenes into a sine wave language. Campbell reasoned that if this is the language of the central nervous system, then to simplify testing one should use sine wave gratings for testing contrast sensitivity. The sine wave targets have the added theoretic advantage of offering the subject few clues. However, with the popularization of sine wave targets, a number of problems have surfaced. For example, Thorn40 has shown that very often a spurious resolution takes place in which a patient does not actually see the original sine wave patterns, but because of a probable interference pattern created on the retina by the gratings, the patient is able to correctly identify the direction of the gratings and thus get credit for a correct answer. Other studies41 have shown that in order to properly identify gratings there should be at least six repetitions of pattern. This is easy to present if the bars are very close together but requires a larger testing area if the subject looks at wider bars. It has also been noted that the visual system is far more sensitive to the vertical orientation of gratings than oblique orientation of gratings. Finally, patients with uncorrected astigmatism are able to discriminate gratings parallel to their astigmatic meridian better than other directions. Therefore, a school of thought has arisen that suggests that letters are the better targets for contrast tests. By using letters the subject must guess 1 out of 26 letters rather than 1 of 3 grating orientations. The letters are usually insensitive to the patient's astigmatism and are more familiar to older patients. A study by Pelli and Robson41 may offer a practical solution. They found that the results of grating tests are very similar to the results of contrast tests in which letter targets are used at several different levels of contrast.

Fig. 17. An example of sinusoidal gratings used for contrast sensitivity testing.

Fig. 18. Example of a contrast sensitivity test. (Courtesy of Dr. B. Grollman, Reichert, Inc.)

SIZE OF TARGET. Since contrast sensitivity is not only a foveal function, it is suggested that targets subtend an angle of at least 2° and preferably an angle of 6°.39

GRADATIONS WITHIN A TARGET. HOW many different levels of resolution should be presented to the subject? The average Snellen chart usually goes from 20/200 to 20/20 in eight different steps. On the other hand, the Regan contrast charts use seven different steps in which each succeeding level decreases the size of the letters by 40%.42 Let's look at the patient population. An increase in glare sensitivity in young contact lens patients will only be picked up with a high frequency target, that is, 20/25 or 20/20 letters. Older patients often can only be properly tested using low frequency targets such as the 20/200, 20/100, and 20/80 size letters. On the other hand, neurologic patients often demonstrate deficiencies in the middle range. Therefore, the test should have representative targets of high, medium, and low frequencies.

How many contrast steps should be presented to the subject? This question is handled in different ways by different manufacturers. For example, Ginsburg's sine wave grating patterns43 present nine levels of contrast, while the Regan charts present three levels of contrast. Here again, the type of subjects should determine the test being used. Young industrial workers with good visual acuities should be given targets with a number of steps between 5% to 30% of contrast because some of their work situations are done at levels below 30% of contrast. On the other hand, Pelli and Robson41 suggest a test involving seven contrast levels in which each decreasing level is 70% of the contrast of the level above it. Thus, if the top contrast level is 100%, the second level would be 70%, the third level would be 49%, and so on. A test that presents nine contrast levels for eight different spatial frequencies presents 72 choices for each eye. A test with 144 choices (tests for each eye) may take up to 20 minutes to perform. Aware of this, Pelli and Robson have seized upon a philosophy first suggested by Green, who noted that the contrast sensitivity curve generally has the same shape for all groups of patients. The key question is where does this specifically shaped curve appear on the graph? Is it in its normal position, is it moved a bit lower contrastwise, or is it pushed to the lower frequencies? They suggest that only contrast sensitivity threshold for one spatial frequency and a traditional visual acuity test (high contrast target) will tell you where to place the curve. For example, by testing seven levels of contrast for a target of spatial frequency 2 cpd, you get the highest point in contrast sensitivity (Fig. 19). The Snellen visual acuity threshold then gives the value for the highest spatial frequency at high contrast (which is threshold). These points place the parabola-shaped contrast sensitivity function in its proper location for the individual patient.

Fig. 19. Typical contrast sensitivity function in the shape of a parabola. The position of the high and side points position the curve for the individual subject. (Courtesy of Dr. Denis G. Pelli, 1991)

Test Media

The various clinical tests can be presented as pages in a book, slides put into some sort of projection device, or a video display. In 1918, George Young was the first to present a contrast test of gray circles on gray backgrounds.44 In these tests he diluted the gray ink with varying amounts of white ink. In general, the printed tests are inexpensive but require exact masters, often get dirty, and eventually fade or yellow. With laserjet printers, targets can present different densities of grayness by using different densities of black dots. This strategy would remove the problems of making exact masters. However, since these targets are presented on paper, they ultimately become dirty or fade. Tests requiring slides must also have exact master slides and require an exact mode of reproduction. All of us who retain slides for teaching or patient care realize that over the course of time slides also fade. The video display channel, on the other hand, can always be calibrated to provide reproducible black dot densities as well as reproducible illumination levels and spatial frequency patterns. On the other hand, these devices are expensive and bulky. Therefore, before purchasing a device one must ask, How long will this test be used before it is upgraded or discarded; and How important is the test for the individual practice?

MODE OF TESTING

It is well known in the field of visual psychology that the reproducibility of contrast sensitivity tests follows the form of a sigmoid-shaped curve. Thus there is no sharp cutoff threshold. Which method of testing is most reproducible and least time-consuming?

System of Limits

In Snellen visual acuity testing, a system of limits is used. That is, the patient is given credit for discerning a certain line if he or she sees the majority of letters or meets some consistent endpoint criteria. For example, in one test each contrast level is presented with three letters. If the subject gets two out of the three at that contrast level, the subject is given credit for that contrast level.

Forced Choice

In a forced choice situation, the patient is always asked to compare a blank or control gray target with a legitimate contrast sensitivity target. In this way guessing ultimately is canceled out and a more accurate final threshold is arrived at. Unfortunately, a forced choice test requires more time than a test involving limits.

Staircase

In the staircase method, the tester first uses the system of limits to arrive at a tentative threshold. The patient is then asked to evaluate targets above and below that threshold until the final threshold is secured. This method can be considered to be more accurate than the system of limits but requires more testing time and patient stamina.

GLARE TESTING

Intensity of Glare Source

We all know that a young healthy athlete can lose a tennis ball or a baseball in the sun. Under those circumstances the glare source is the sun, which has luminance of many thousands of candelas/m2(varies with latitude, season, and time of day). Such levels of glare are usually not relevant to the average patient. On the other hand, the luminance of the sky on a clear day is about a thousand foot-lamberts or 340 candelas/m2(varies with season and time of day). We do know that some patients who have contrast problems have difficulty discerning facial expressions in such daylight situations. We are also aware of other patients who report not being able to follow a golf ball against the mid or late afternoon sky. Thus, a glare level of over 300 candelas/m2would represent these conditions in a testing situation. Some impaired patients report difficulty in reading labels on food cans and jars in a well-lighted supermarket. The lighting under these conditions would probably be a quarter or less of the luminance of the sky on a clear day. The surrounding lighting of a supermarket would present a noticeable glare source to patients who are developing significant cataracts. We can see that the intensity of a glare source in a test can legitimately vary over a defined range. In general, it appears as if a test for older patients who are developing cataracts or corneal diseases should be in the range of 100 to 400 candelas/m2.45 Brighter glare sources would be appropriate for specific tasks such as night driving in the face of oncoming headlights.

Position of Glare Source

The position of the glare light in relation to the target is very important. Although a small, bright glare light adjacent to the target may best simulate the effects of an oncoming headlight, the placement of such a light has a distinct disadvantage. Studies have shown that most patients are apt to peek into the glare light during the testing. Once this happens a bleaching out of the macular pigment strongly decreases the level of visual performance. This is particularly true in the case of patients with age-related macular degeneration whose vision may not recover from bleaching for some time. Thus, the safest and most effective configuration of a glare light is to surround the target, much as seen in the brightness acuity tester (BAT) device (Mentor Company, Norwell, MA) or the Miller-Nadler glare tester (Fig. 20).46

Fig. 20. The glare source surrounds the target in the Miller-Nadler glare test (left) or the BAT (right).

Type of Target

A glare source decreases both the visual acuity and the contrast sensitivity function of patients with corneal lesions, coated contact lenses, and varying degrees of cataract. Figure 13 shows the relationship between simulated progressive nuclear sclerosis and visual function (i.e., visual acuity and contrast sensitivity function) under a constant glare source. Note that the visual acuity function stays relatively level until an 80% cataract develops and then drops dramatically, whereas the contrast sensitivity function gradually diminishes as the cataract progresses.11

Standards for Glare Disability

The level of glare disability tolerable to be able to perform safely and efficiently is easy to arrive at for the industrial worker. One would simply simulate the industrial task with a realistic background illumination and find out whether the worker can perform at an acceptable level. How does one transfer these principles to a doctor's office where industrial workers as well as patients with cataracts, corneal diseases, and neurologic problems present? There is no simple answer to this question. Therefore, a decision to operate on a patient with a cataract must take into consideration all of the following: a glare disability score, a visual acuity score, a contrast sensitivity score, as well as the patient's own sense of his or her level of impairment.

Back to Top
UNITS OF MEASUREMENT

ILLUMINATION

Illuminating engineers have taught us to divide lighting into two logical categories: illuminance and luminance. Light incident on a target is known as illuminance (incident and illuminance start with i). Illuminance describes the density of light falling on an area. if you are measuring an area in feet or inches you would talk of lumens per square foot, or foot candles. If the area is measured using the metric system then the illumination would be described by lumens per square meter, or lux. The units of illumination would be used to describe the light incident on a wall chart that is illuminated by ceiling lights or a dedicated lamp. The light leaving the wall target is referred to as luminance (leave and luminance start with l). If you were using feet or inches then the units of luminance would be foot-lamberts, or candelas per square foot. If you are using the metric system you would speak of candelas per square meter, or nits. If one were to convert candelas or nits to foot-lamberts, one would multiply by 3.42.

Let us see how these units are used. The British standards recommend luminance for a visual acuity projector to be 410 foot-lamberts or its equivalent, 120 candelas/m2. The recommended luminance for a contrast target is 291 foot-lamberts, or 85 candelas/m2. Turning to the luminance of natural surroundings we note that the background luminance of the sky on a clear day is 1000 foot-lamberts, or 291 candelas/m2, while an overcast sky provides a background luminance of a mere 100 foot-lamberts or 29.1 candelas/m2. At twilight the sky has been measured to be 1 foot-lambert, or 0.29 candela/m2.

TARGET SPECIFICATION

Size

The size of a letter on the Snellen visual acuity chart depends on the angular subtense of the letter. Thus a 20/20 letter (capital letter E) subtends an angle of 5 minutes of arc, while the white spaces between each black bar of the E subtend 1 minute of arc. The jargon of alternating grid patterns of black-and-white stripes uses cycles per degree (cpd). A cycle consists of a black-and-white stripe. To convert Snellen notation to cycles per degree, divide the Snellen denominator into 600. For example, the 20/20 letter becomes 30 cpd, whereas the 20/200 letter is equivalent to 3 cpd. Occasionally, the term octave is used to describe targets. Doubling the frequency, that is, doubling the cycles per degree, would mean moving up 1 octave. Therefore, going from a frequency of 2 to 4 cpd would be moving up 1 octave. Once again, going from 4 to 8 cpd would move the target 1 octave.

Contrast

The contrast of any pattern is a decimal given by the formula

Contrast will vary from 0 to 1.0. To get percent contrast, multiply the decimal by 100. Thus, if a projected visual acuity chart has a background luminance of 100 candelas/m2and the letters have a luminance of 5 candelas/m2, the contrast is


100 - 5 100 + 5 =0.9

Multiplying this entity by 100 yields the percent contrast (90%). As you can see, if you use percent contrast, then high contrast targets have high numbers and low contrast targets have low numbers. On the other hand, contrast sensitivity refers to the patient's performance. A good performance should have a high number and a poor performance should have a low number. Of course, a good performance implies a threshold of low contrast and a poor performance means a high threshold. The contrast sensitivity is the reciprocal of contrast. A task with a contrast of 0.1 yields a contrast sensitivity of 10. In the same vein, a target threshold of 0.3 (30% contrast) becomes 3 divided into 10 or a contrast sensitivity of 33. A target threshold of 0.1 (1% contrast) becomes a contrast sensitivity of 100. Interestingly, there are rare subjects who can discriminate a contrast threshold of .001 (0.1%), Their contrast sensitivity becomes 1000. Because of such subjects, the vertical axis of the contrast sensitivity function of some charts does not stop at 100 but goes to 1000.

Dealing with ranges from 1 to 1000 on linear graph paper would require a large piece of paper.

To compress the size of the plot, some investigators use a logarithmic scale. In such a scale, the log of 10 is 1, the log of 100 is 2, and the log of 1000 is 3.

Back to Top
REFERENCES

1. Georgeson MA, Sullivan GD: Contrast constancy: Deblurring in human vision by spatial frequency channels. J Physics 252:627, 1975

2. Woodhouse JM, Barlow HB: Spatial and temporal resolution and analysis. In Barlow HB. Mollon JD (eds): The Senses, pp 133–152. Cambridge, Cambridge University Press, 1982

3. Maffei L Fiorentini A: The visual cortex as a spatial frequency analyzer. Vis Res 13:1255, 1973

4. Campbell FW, Green DG: Optical and retinal factors affecting visual resolution. J Physics 181:576, 1965

5. Campbell FW, Gubisch RW: Optical quality of the human eye. J Physics 186:558, 1966

6. Campbell FW. Robson JG: Application of Fourier analysis to the visibility of gratings. J Physics 197:551, 1968

7. Hemenger RP: lntraocular light scatter in normal lens with age. Appl Optics 23: 1972. 1984

8. Owsley C, Sekular R, Siemsen D: Contrast sensitivity throughout adulthood. Vis Res 23:689, 1983

9. Rea MS, Ouellette M J: Visual performance using reaction times. Light Res Technol 20: 139, 1988

10. Nordmann JP, Roncin JP et al: Objective evaluation of mountain sickness through contrast sensitivity testing in the Himalayas. Invest Ophthalmol Vis Sci 32: 1281. 1991

11. Miller D, Benedek GB: Intraocular Light Scattering. Springfield, IL, Charles C Thomas, 1973

12. Maurice D: The structure and transparency of the cornea. J Physics 136:263, 1957

13. Benedek GB: Theory of transparency of the eye. Appl Optics 10:459, 1971

14. Miller D, Zuckerman JL. Reynolds GO: Holographic filter to negate the effect of cataract. Arch Ophthalmol 90:323, 1973

15. LeClaire J, Nadler MP, Weiss S et al: A new glare tester for clinical testing. Arch Ophthalmol 100:153, 1982

16. Hollidy LL: The fundamentals of glare and visibility. J Opt Soc Am [A]. 12:492, 1926

17. Wolfe E: Glare and age. Arch Ophthalmol 64:502, 1960

18. Wolfe E, Gardiner JS: Studies on the scatter of light in the dioptric median of the eye as a basis for visual glare. Arch Ophthalmol 37:450, 1963

19. Miller D, Dohlman CH: The effect of cataract surgery on the cornea. Trans Am Acad Ophthalmol Otol 74:369, 1970

20. Lancon M, Miller D: Corneal hydration, visual acuity and glare sensitivity. Arch Ophthalmol 90:227, 1973

21. Miller D, Sanghvi S: Contrast sensitivity and glare testing in corneal disease. In Nadler MP, Miller D, Nadler DJ (eds): Glare and Contrast Sensitivity for Clinicians, pp 45–52. New York, Springer-Verlag, 1990

22. Katz B, Melles RB, Schneider JA: Glare disability in nephrotic cystinosis. Arch Ophthalmol 105: 1670, 1987

23. Rowsey J J, Balyeat HD: Preliminary results and complications of radial keratotomy. Am J Ophthalmol 93:437. 1982

24. Warlag GO, Lynn M J, Gelender H et al: Results of the progressive evaluation of radial keratotomy (PERK) study one year after surgery. Ophthalmology 92: 177, 1985

25. Sawelscon H, Marks RG: Three year results of keratotomy. Arch Ophthalmol 105:81, 1987

26. Harper RA, Halliday BL: Glare and contrast sensitivity in contact lens corrected aphakia, epikeratophakia and pseudophakia. Eye 3:562, 1989

27. Koch D, Emery J, Jardeleza T et al: Glare following posterior chamber lens implantation. J Cataract Refract Surg 12:480, 1986

28. Kumar S, Miller D: Effect of intraocular lens decentration on retinal image contrast. J Cataract Refract Surg 16:712, 1990

29. Maxwell WA, Nordan LT: Current concepts of multifocal lenses. Thororate, N J, Slack, 1990

30. Atebara N, Miller D: An optical model to describe image contrast with bifocal lenses. Am J Ophthalmol 110:172, 1990

31. Holliday J, van Dijk H, Lang A et al: Optical performance of multifocal lenses. J Cataract Refract Surg 16:413. 1990

32. Atebara N: Image Contrast and the Optics of Multifocal Intraocular Lenses. Senior thesis, Harvard Medical School, 1991

33. Cavallerano JD, Aiello LM: Diabetes and visual function. In Nadler MP. Miller D, Nadler DJ (eds): Glare and Contrast Sensitivity for Clinicians, pp 66–74. New York. Springer-Verlag, 1990

34. Kleiner C, Eager C, Alexander MF et al: Contrast sensitivity in age related macular degeneration. Arch Ophthalmol 106:55, 1988

35. Wittaker SG: Contrast sensitivity requirements for low vision reading. Invest Ophthalmol Vis Sci 32:1282, 1991

36. Lorance RW, Kaufman D, Wray SH et al: Contrast visual testing in neurovisual diagnosis. Neurology 37:923, 1987

37. Fleishman JA, Beck RW, Linares OA et al: Deficits in visual function after resolution of optic neuritis. Ophthalmology 94: 1029, 1987

38. Arden GB: New methods for diagnosis of retinal neural damage associated with primary open-angle glaucoma. In Nadler MP, Miller D, Nadler DJ (eds): Glare and Contrast Sensitivity for Clinicians, pp 76–83. New York, Springer-Verlag, 1990

39. Rea MS: Some basic concepts and field applications for lighting, color and vision. In Nadler MP, Miller D, Nadler DJ (eds): Glare and Contrast Sensitivity for Clinicians, pp 120–138. New York, Springer-Verlag, 1990

40. Thorn F: Effects of dioptric blur on Snellen and grating acuity. Optom Vis Sci 67:3, 1990

41. Pelli Dg, Robson JG, Wilkins AJ: The design of a new letter chart for measuring contrast sensitivity. Clin Vis Sci 2:187. 1988

42. Regan D. Neima D: Low contrast letter charts as a test of visual function. Ophthalmology 90:1192, 1983

43. Ginsburg AP: A new contrast sensitivity vision test chart. Am J Optom Phys Optics 61:403, 1984

44. Young G: Threshold tests. Br J Ophthalmol 2:384, 1918

45. Hirsch RP, Nadler NP. Miller D: Glare measurement as a predictor of outdoor vision among cataract patients. Ann Ophthalmol 16:965, 1984

46. Miller D, Wolfe E, Jernigan ME et al: Laboratory evaluation of a clinical glare tester. Arch Ophthalmol 87:324, 1972

Back to Top