|
|
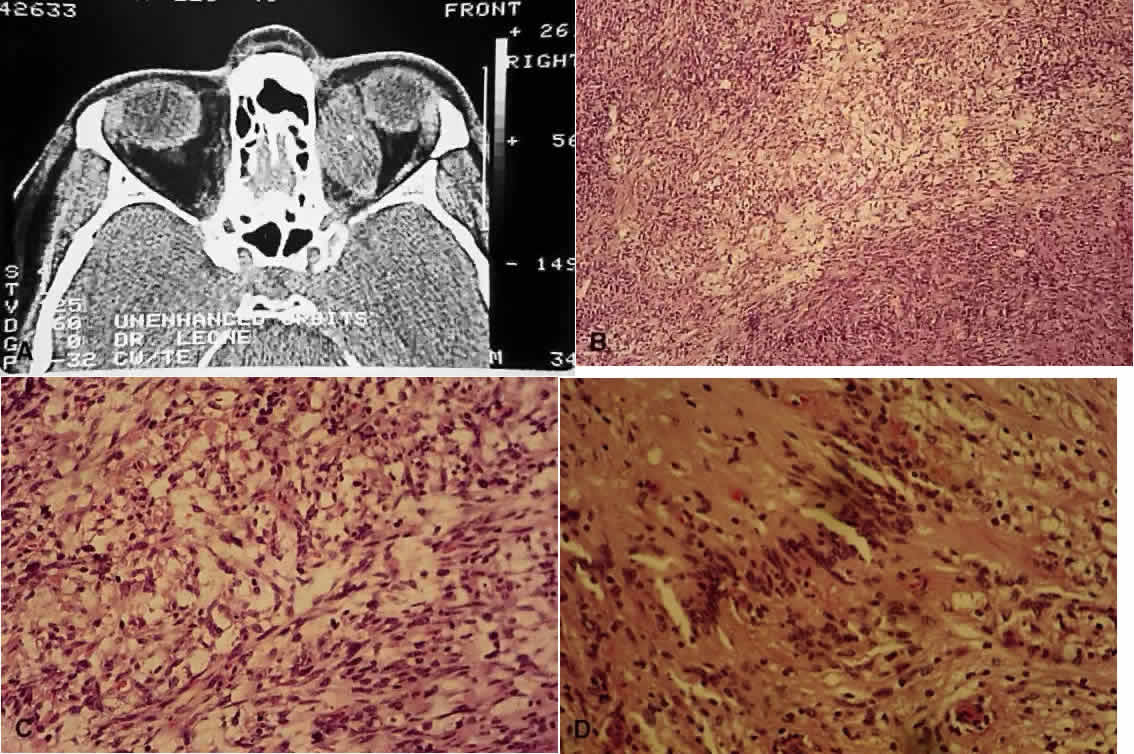
| Fig. 9. Neurilemmoma (schwannoma). A. Computed tomography scan of orbital neurilemmoma. B. Low-power view showing Antoni A (more densely packed cells) and Antoni B (more mucoid, paler areas) patterns (H&E, × 10). C. Higher-power view showing Antoni B pattern (H&E, × 25). D. High-power view of a Verocay body, where the long axes of the cell nuclei line up in register (H&E, × 31). |