
|
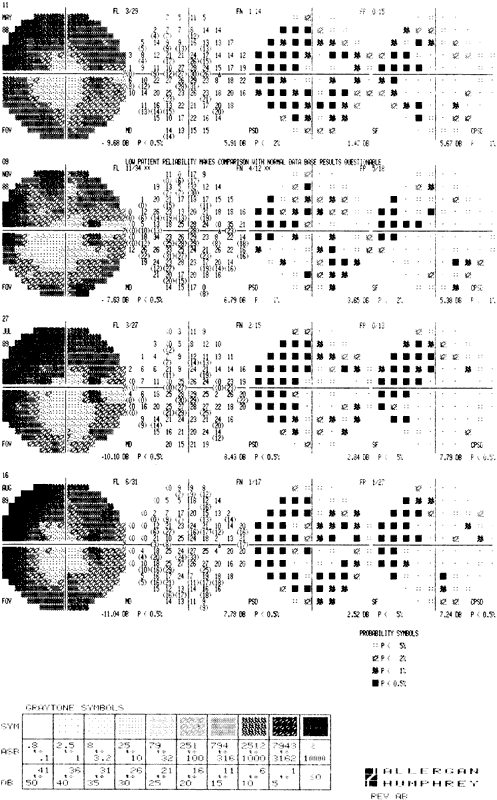
| Fig. 17. This overview printout of the Humphrey Field Analyzer presents data of these four sequential fields in several formats, including gray scale, numeric printout, total deviation probability plot, and pattern deviation probability plot. For each field, false-negative and -positive responses, fixation losses, and global indices are provided. |