
|
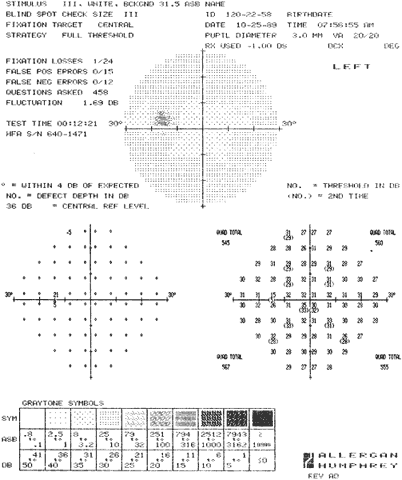
| Fig. 4. Full threshold examination. Program 30-2 of the Humphrey Field Analyzer fully thresholds each of 76 points within the central 30°, spaced 6° apart. Standard data, including program used, testing parameters, patient identification, acuity, pupil diameter, age, and refraction, are given. Reliability parameters and testing time are also recorded. A display of the actual threshold sensitivity values determined for each point tested is given (lower right). Note the quadrant (Quad) totals. In addition, a display of the depth of defect is provided (lower left). In the gray-scale printout (upper), a different symbol is delegated to a series of sensitivity ranges (see key, below). A symbol is assigned to each of the points tested and a printout is generated. In the numeric printout, note the 12 loci at which a threshold sensitivity value has been determined twice. The differences between the first and second determinations are used to determine the degree of short-term fluctuation. |