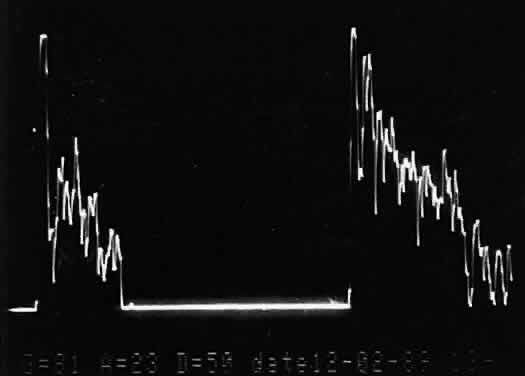
Fig. 1.
A-scan time amplitude ultrasonogram. The horizontal axis represents time or distance. The vertical deflections represent echo amplitude.