|
|
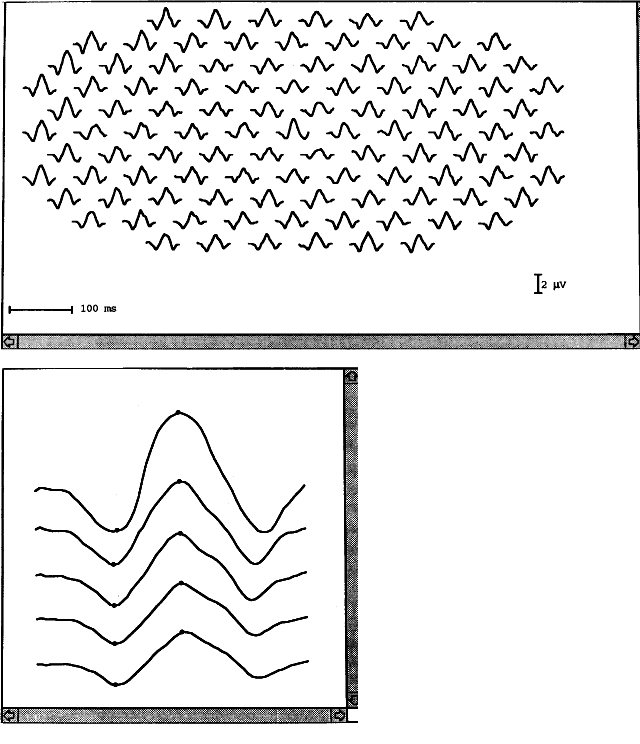
| Fig. 22. ERG tracings from a multifocal ERG system. Top. Tracing array or topographic ERG map. Within a 47° × 39° area, 103 separate areas are represented. Stimulus frequency ≅ 37 Hz. Number of summated runs = 4. Time of each run = 4 min. Bottom. Top trace represents the central response from the topographic map. Succeeding traces represent the average of ERG responses in rings around the central area. Trace 2 represents the 6 traces around the center; trace 3 represents the next 11 traces in a circle around the first ring. The amplitudes are recorded relative to the central response. Implicit times are of major importance and can be easily obtained for both a- and b-waves. |