
|
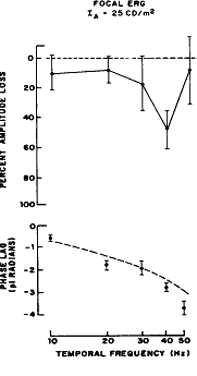
| Fig. 21. Case 15. See text for details. As is true in most cases of macular degeneration, the maximum amplitude loss (upper graph) occurs at the midtemporal frequencies (40 Hz) and there is an increase in the phase lag (lower graph), again most evident in the higher frequencies. |