|
|
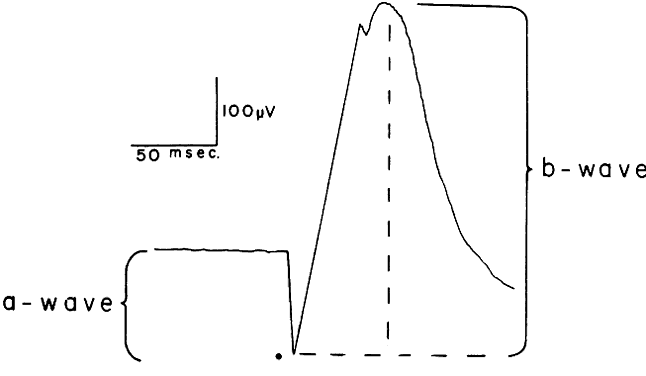
| Fig. 1. Schematic of a dark-adapted ERG in response to a high-intensity light flash (·). The a-wave amplitude is measured from the baseline to the lowest negative excursion of the trace. The b-wave amplitude is measured from the lowest point to the highest positive peak. (Carr RE, Siegel IM: Visual Electrodiagnostic Testing. Baltimore, Williams & Wilkins, 1982) |