
|
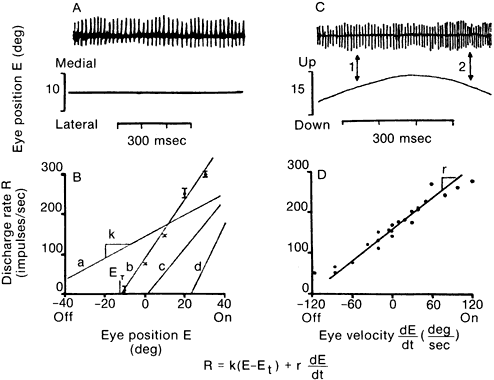
| Fig. 36. behavior of firing rate (R) of eye muscle motor neuron in creating eye position (E) and eye velocity (dE/dt). A. Neuron fires steadily during fixation. B. Rate is plotted against E in rateposition curve for four cells (a, b, c, d) showing extremes of threshold (ET) and slope (k). Typical means and standard deviations of R are shown for cell b. C. Eye has same position at times 1 and 2, but relationship between R and dE/dt causes R to vary considerably, because eye velocity is quite different at the two times 1. D. Rate-velocity relation for motoneuron. Its slope is r. These relationships are expressed simply by equation at bottom of figures. (Robinson DA: In DOG Symposium: Neurophysiologie. Wiesbaden, Carl Ritter, 1978.) |