|
|
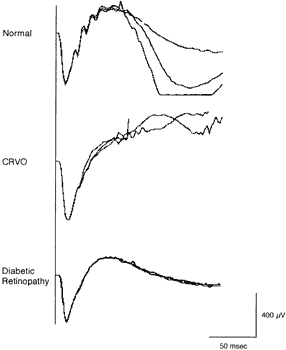
| Fig. 11. Full-field electroretinograms recorded from a normal subject, a patient with central retinal vein occlusion (CRVO), and a patient with diabetic retinopathy in response to a white flash of 1.85 log ft.L-sec after 45 minutes of dark adaptation. These recordings illustrate the diminution of oscillatory potential amplitudes in the two patients compared with the normal subject. Two or three consecutive traces are superimposed for each recording. |