
|
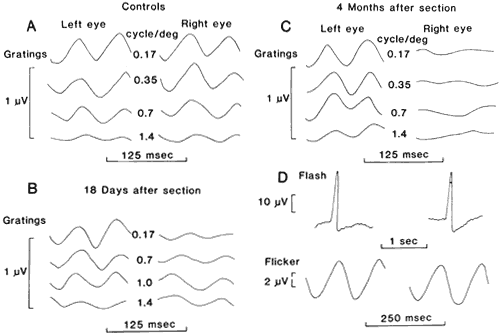
| Fig. 10. Examples of pattern-reversal electroretinograms recorded from one cat before and after the section of the right optic nerve. A. Control records obtained from the two eyes before the section of the optic nerve. B and C. Records obtained 18 days and 4 months after the optic nerve section. Each record is the average of 500 responses. Stimulus: vertical sinusoidal grating reversed in contrast 16 times per second; contrast, 30%; mean luminance, 10 cd/m2. The spatial frequency is indicated next to each record. D. Electroretinogram in response to 50-msec light flashes (250 trolands) and to light flickering at 8 Hz (mean luminance, 10 cd/m2; amplitude of square-wave modulation, 40%) recorded from the two eyes 4 months after section of the right optic nerve. (Maffei L, Fiorentini A: Electroretinographic responses to alternating gratings before and after section of the optic nerve. Science 211:953, 1981) |