
|
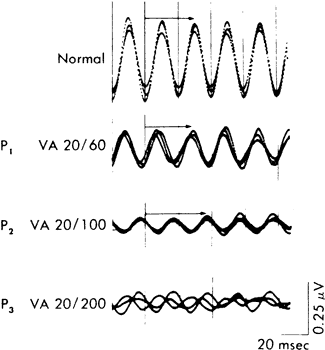
| Fig. 9. Foveal cone electroretinograms for a normal subject and three patients (P1, P2, and P3), ages 11, 13, and 23, respectively, with juvenile hereditary macular degeneration (Stargardt's disease). Responses represent computer summation of 128 sweeps; three consecutive runs are illustrated. Arrows designate b-wave implicit times for detectable responses. (Sandberg MA, Jacobson SG, Berson EL: Foveal cone electroretinograms in retinitis pigmentosa and juvenile macular degenerations. Am J Ophthalmol 88:702, 1979) (Reprinted with permission from Elsevier Science Inc.) |