|
|
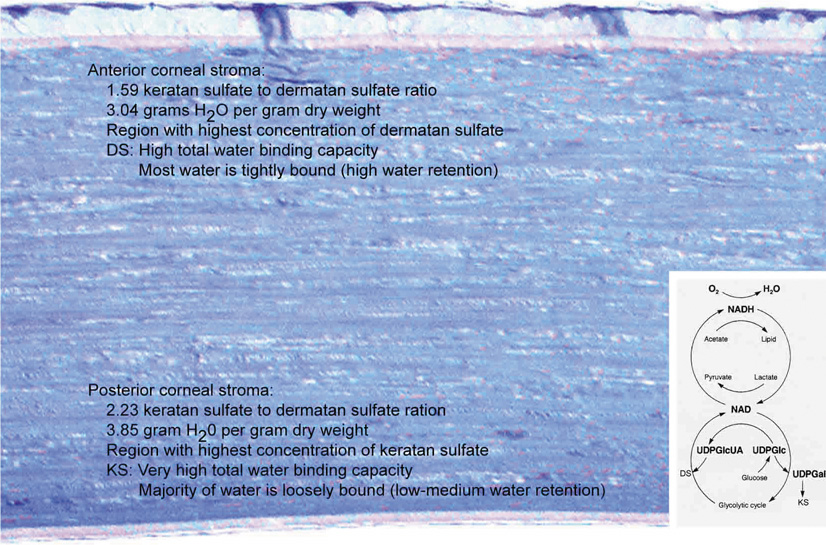
| Fig. 15. Diagram demonstrating the regional differences in the corneal stroma for the proportion of the two types of corneal proteoglycans and the water absorbing properties in these regions. (Inset) Diagram of the metabolic pathways for dermatan sulfate and keratan sulfate production. Notice that the supply of oxygen is the initial factor whether dermatan sulfate is made through an aerobic pathway or whether keratan sulfate is made through an anaerobic alternative pathway. (Modified from Scott JE. Oxygen and the connective tissues. TIBS 17:340, 1992.) |