|
|
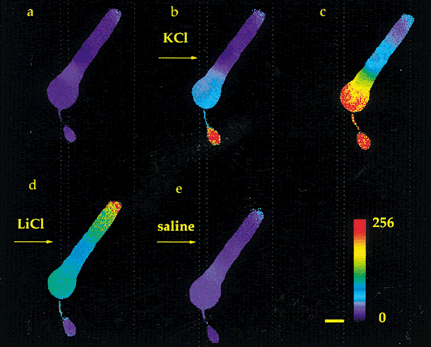
| Fig. 8. Spatiotemporal dynamics of calcium changes in a rod photoreceptor. Sequential images of [Ca2+ ]i changes were recorded from a Fura 2-loaded rod. Between (a) and (b) the rod was superfused with high KCl. The images in (b) and (c) were captured 3 and 21 seconds after KCl application, respectively. The image in (d) was captured 15 seconds after KCl was replaced by LiCl. The image in (e) was captured 7 seconds after the return to control saline. These images show that KCl-evoked increases in [Ca2+ ]i occurred most rapidly in the synaptic terminal region and then in the basal region of the inner segment. In LiCl, the inner segment and synaptic terminal returned to baseline while [Ca2+ ]i in the outer segment rose, most notably at the tip. The pseudocolor scale representing the 256 gray levels of the 340/380 ratios is shown on the bottom; red indicates the largest changes. Scale bar, 10 μm. (Adapted from Krizaj, Copenhagen: Neuron 21:249, 1998, with permission of the authors and Cell Press) |