
|
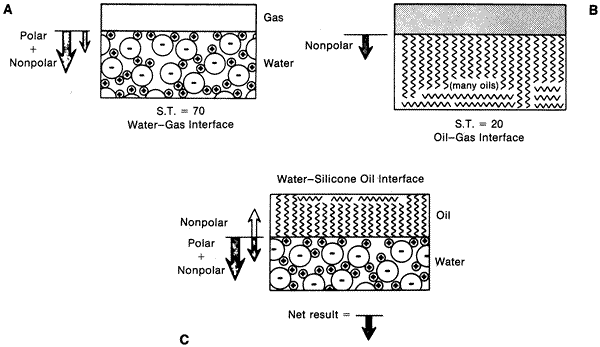
| Fig. 8. A. Diagram showing a gas–water interface. The large arrow indicates strong polar bonding forces on surface molecules causing a net force perpendicular to the interface. The small arrow indicates the weaker nonpolar bonding forces (van der Waals) on the molecules. B. Similar diagram showing gas–oil interface. Note only weaker nonpolar forces acting at surface. C. Diagram showing oil–water interface. Note weak nonpolar attraction of water molecules to oil molecules, thereby decreasing the surface tension at interface. (From DeJuan E, McCuen B, Tiedeman J: Intraocular tamponade and surface tension. Surv Ophthalmol 30:47, 1985.) |