
|
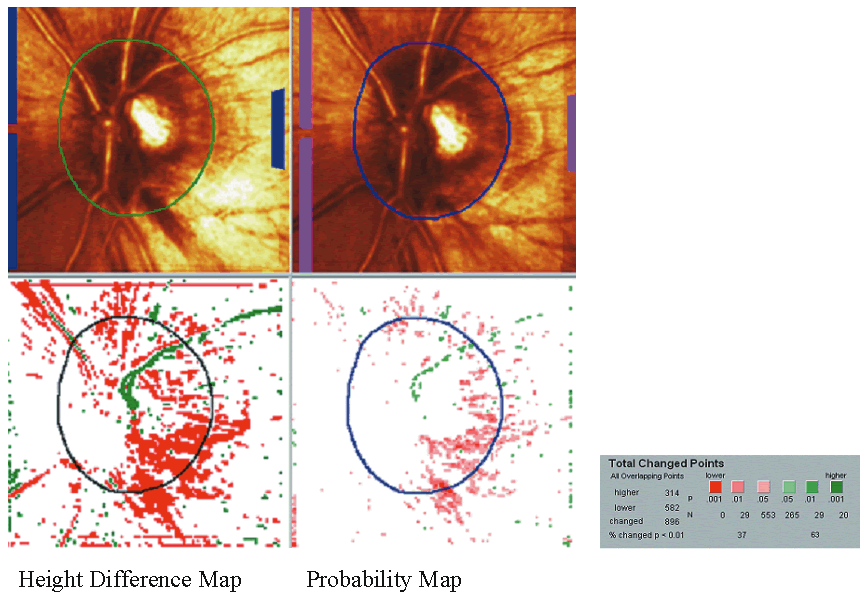
| Fig. 8. Topographic difference images. The baseline and follow-up examination of a glaucomatous eye are shown. The red areas on the height difference map are depressed more than 50 μm on the follow-up examination. The probability map shows the significance of the detected change. |