|
|
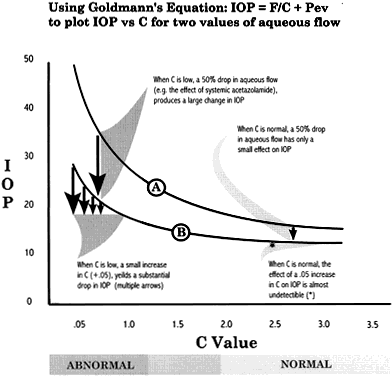
| Fig. 10. Relation of IOP and aqueous outflow. For aqueous flow rates of 2 μL/minute (A) and 1 μL/minute (B), large changes in IOP occur only in the lower (glaucomatous) ranges of aqueous outflow (C Value). This explains the propensity of glaucomatous eyes for large variations in IOP and also demonstrates the difficulty of studying IOP-lowering therapy in normal subjects. |