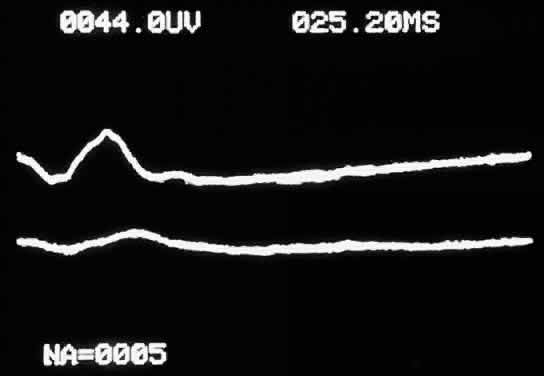
Fig. 7.
Electroretinogram showing normal a- and b-waves in the unaffected right eye (
upper tracing
) and marked reduction in both a and b waves in the eye with ocular ischemic syndrome (
lower tracing
).