|
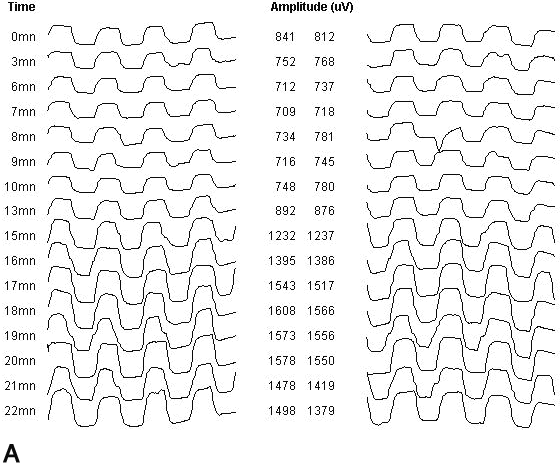
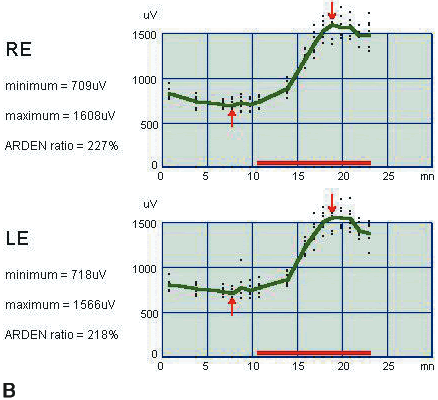
Fig. 12.
A. Brief, raw tracings as they might appear with an ink writer or on a video monitor. B. The processed data. The amplitudes of these tracings are plotted as a function of time. The mean values are connected with a solid green line. The minimum amplitude in the dark and the maximum amplitude in the light are determined. The red line represents time in the light. The red arrows indicate the minimum and maximum values. The ratio of the light peak to the dark trough is calculated as the light/dark or Arden ratio. (RE, right eye; LE, left eye) (Used by permission of Metrovision, Pérenchies, France: http://www.metrovision.fr.)
|


