Fig. 2
An example of “warp tracing.”
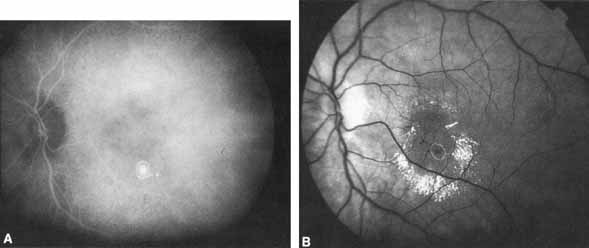
A.
The hyperfluorescent lesion seen on ICGA is encircled.
B.
The tracing is shown superimposed onto the previously aligned, corresponding red-free image.