|
|
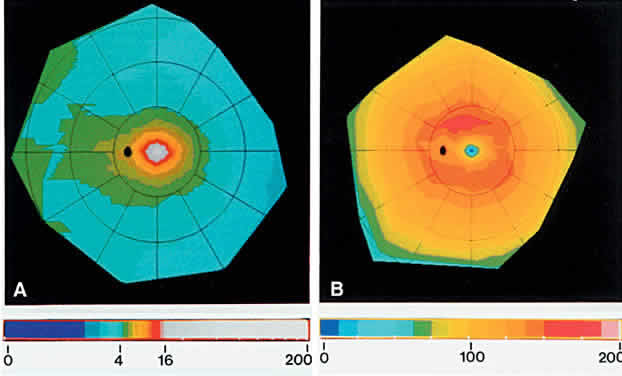
| Fig. 8. Computer-generated color-coded maps of mean photoreceptor density in the human retina. The fovea is in the center and the ora serrata is at the perimeter. Nasal is to the left. Bars below A and B relate color coding for spatial density of photoreceptors (cells × 1000/mm2). They show the range from 0 to 16,000 cells/mm2 at intervals of 1000 cells/mm2. Densities above 16,000 cells/mm2 are represented by white. A. Cones in the retina. Cone density in the fovea is beyond the range of the color scale and shown in white. The black oval is the optic disc. B. Rods in the retina. Note small rod-free zone (black dot) in the fovea and the ring of highest rod density at the eccentricity of the optic disc. (Curcio CA, Sloan KR, Kalina RE, Hendrickson AE: Human photoreceptor topography. J Comp Neurol 292:497, 1990.) |