|
|
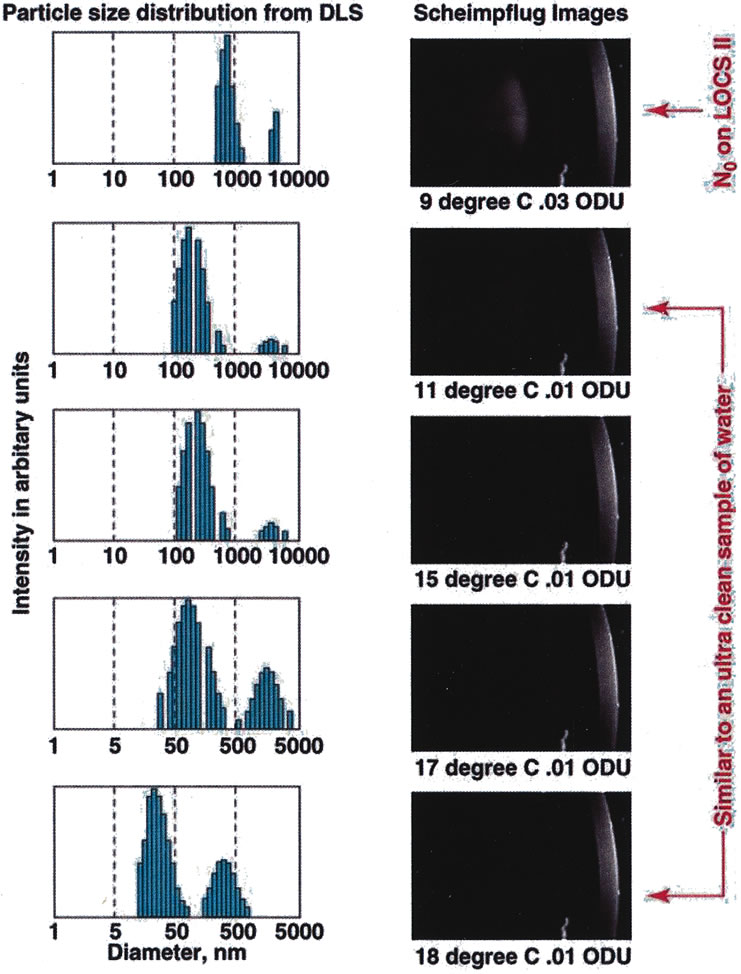
| Fig. 10. Data obtained from a cold-induced cataract study using calf eyes. Data on the left show the size distribution of lens proteins as the cold cataract appears (as the temperature of the calf lens is lowered) showing the shift from small to large molecular weight proteins (data obtained from the dynamic light scattering \[DLS\] device) versus Scheimpflug slit-lamp images of the same calf lens as the temperature is correspondingly lowered and the cold cataract appears. The DLS device picks up a shift in protein size much earlier than the Scheimpflug camera shows the appearance of the cataract.66 |