
|
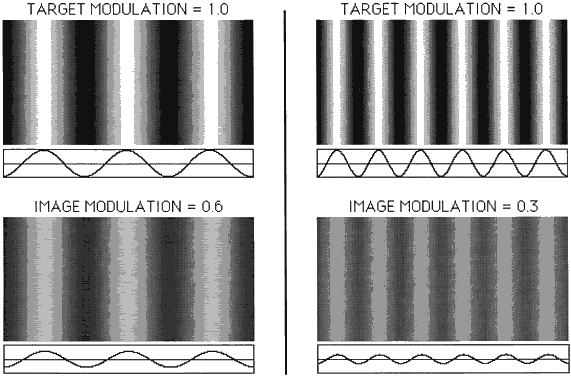
| Fig. 41. Sine-wave gratings are shown at two spatial frequencies (left and right). The top gratings are objects with high contrast (1.0), and contrast is reduced to 0.6 and 0.3 at the bottom. Sinusoidal luminance profiles are shown below each grating. |